The Estimation of
Food Demand Elasticities
in Canada
Authors Ruth Pomboza
Research Economist, Agri-Food Chain and IRM Analysis Msafiri Mbaga
Research Economist, Farm Inputs
The Estimation of Food Demand Elasticities in Canada
January 2007
Research and Analysis Directorate Strategic Research
Agriculture and Agri-Food Canada
The authors would like to thank Dr. Zuhair Hassan, Dr. Sean Cahill, Dr. Cameron Short, Lambert Gauthier, Ian Campbell and Dr. Ellen Goddard for reviewing an earlier draft of this paper.
© Her Majesty the Queen in Right of Canada, 2007
Any policy views, whether explicitly stated, inferred or interpreted from the contents of this publication, should not be represented as reflecting the views of Agriculture and Agri-Food Canada (AAFC).
AAFC does not control the availability of Internet web sites featured in this report.Therefore, it does not take responsibility for severed hyperlinks or discontinued web pages mentioned herein. Links to these web sites are provided solely for the convenience of users.AAFC does not endorse these sites, nor is it responsible for the accuracy, the currency or the reliability of the content. Users should be aware that information offered by sites other than those of the Government of Canada are not subject to the Official Languages Act.
Electronic versions of Research and Analysis Directorate publications are available on the Internet at www.agr.gc.ca/ pol/index_e.php.
Publication 06-071-RB ISBN 0-662-44358-6
Catalogue A38-4/8-2006E-PDF Project 06-071-r
Aussi disponible en français sous le titre :
T
A B L E
O F
C O N T E N T S
Foreword... ix
Executive summary... xi
Section 1
Introduction... 1
Section 2
Demographics and the trends in food
consumption and expenditure in Canada ... 3
Section 3
Previous consumer demand studies in Canada . 9
Section 4
Data used to estimate demand elasticities ... 15
Section 5
Model specification ... 19
Section 6
Econometric results and elasticity estimates ... 23
Section 7
Conclusions and policy implications ... 35
Bibliography... 37
Appendix A
Food groups and food categories... 39
Appendix B
Conversion factors ... 41
Appendix C
Variables used in the modified AIDS model
system... 47
Appendix D
Own price demand elasticities derived from
the modified AIDS model: case of all sample
households (USDA 2000)... 49
L
I S T
O F
T A B L E S
Table 1:
Percentage of total weekly food expenditure per
household in Canada... 5
Table 2:
Percentage of total weekly food expenditure for
selected types of households ... 6
Table 3:
Percentage of total weekly food expenditure on
food purchased from restaurants and from stores... 6
Table 4:
Average weekly expenditure per household by
food group ... 7
Table 5:
Percentage of total food expenditure by province.. 7
Table 6:
Summary of main findings of Canadian literature
on food demand... 12
Table 7:
Estimated coefficients of share equation ... 25
Table 8:
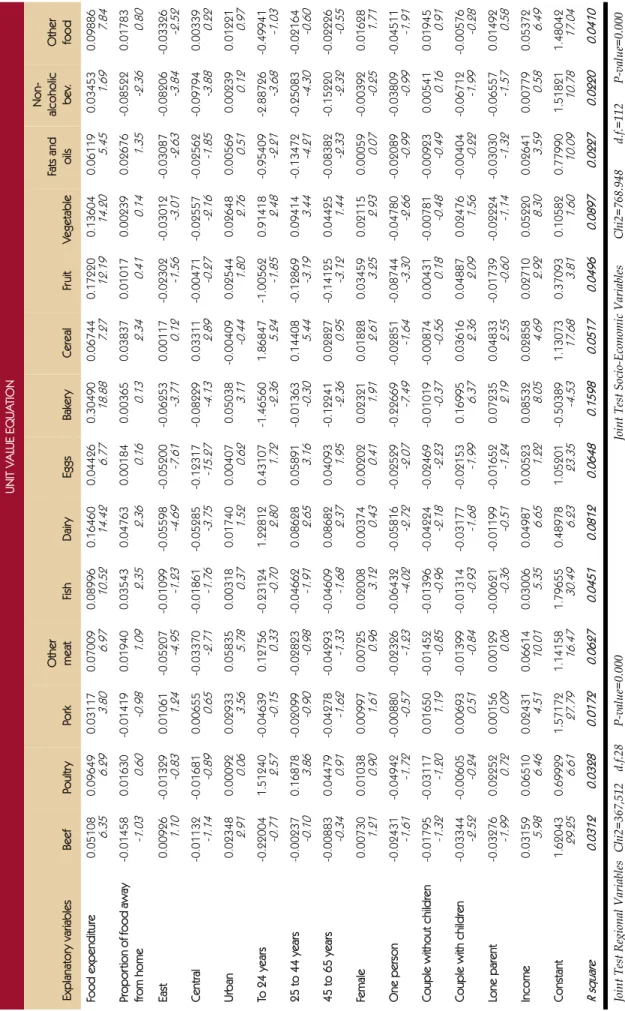
Coefficients of unit value equation... 28
Table 9:
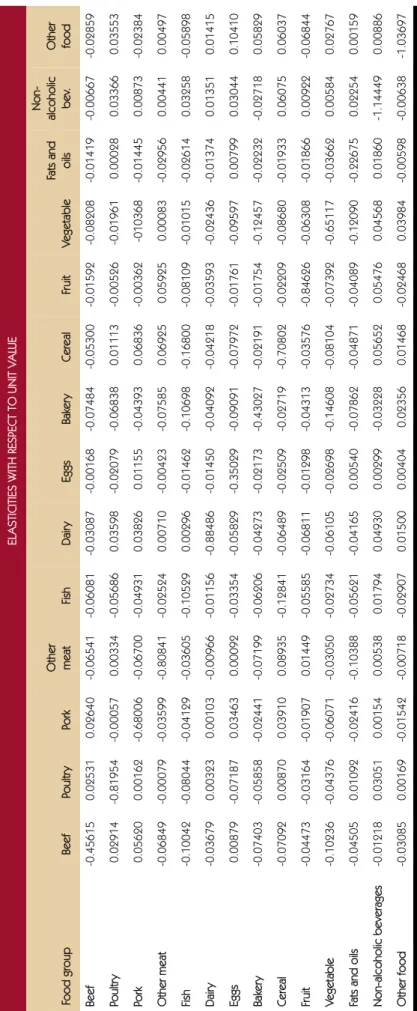
Own and cross price elasticities derived from the
AID model ... 30
Table 10:
Hicksian (compensated) elasticities ... 31
Table 11:
Expenditure elasticities unadjusted and adjusted
for quality effects (foods at home) ... 32
Table 12:
Results of demand estimates from studies done
L
I S T
O F
F I G U R E S
Figure 1:
Real per capita disposable income (2002 dollars) .. 3
Figure 2:
Share of personal disposable income spent
on food... 3
Figure 3:
Consumer price index ... 4
Figure 4:
Share of meals away from home in total family
Foreword
Changing consumer and market demands have been identified as an important driver behind the challenges and opportunities that are facing the agriculture and agri-food sector in Canada and that will influence the sector’s profitability and competitiveness in the future. It is therefore important to understand developments in the consumer demand for agriculture and agri-food products. For example, consumers are increasingly willing to pay for increased convenience in the food items they purchase, such as ready-to-eat meals from grocery stores. They are also inter-ested in the health benefits of food items as they become more concerned about their health and wellness. For both industry, which is concerned about maintaining its competitiveness, and gov-ernment, which is trying to promote the competitiveness of the industry as it develops policies for the sector, it is key to understand consumer behaviour relative to the demand for food. In this context, this paper was developed in an attempt to make use of up-to-date information, i.e. data from the 2001 Family Food Expenditure Survey, to update demand elasticities for food in Canada. Demand elasticities, in the economic literature, quantify the responsiveness of con-sumers and consumer demand to changes in prices and income and other variables of a given food commodity. They are therefore useful for conducting analysis of the changing structure of the agriculture and agri-food sector and can help quantify the impacts that changes in economic variables and policies that impact those economic variables might have. The last time empirical estimates of elasticities were developed at AAFC was in 1993. This paper is a welcome addition to the consumer demand for food literature in Canada.
The report begins with a description of changing trends in many of the demographic and eco-nomic variables that impact the consumer demand for food and food products in Canada, including disposable income, household size, type and age of household head. A literature review provides some background as to the type of research that has been conducted in the past and the results of this research. Then the report presents a description of the data that is used in the empirical analysis, from the Family Food Expenditure Survey. It goes on to describe a modi-fied version of an Almost Ideal Demand System (AIDS) model that is used to estimate demand elasticities. The paper concludes with the empirical results and a comparison with other results that have been estimated at AAFC and elsewhere. It is clear from the results that there are differ-ences across commodities in terms of the responsiveness of consumers to changes in prices and income. In addition, there have been changes over time in this responsiveness. For example,
x
Foreword
The Estimation of Food Demand Elasticities in Canada
according to the study, the demand for beef is less responsive to changes in own prices than for chicken, and this has fallen over time. Pork and fish have also shown a decline in price respon-siveness. Knowing the price responsiveness allows us to anticipate the impact of market devel-opments and policy changes on both the welfare and performance of the agriculture and agri-food sector and on Canadian consumers.
Executive summary
The objective of this paper is to estimate demand elasticities for food in Canada using the Food Expenditure Survey (FOODEX) data. To enrich the analysis, recent trends in food consumption and expenditure in Canada are identified and incorporated in the modeling of consumer demand.
For the purpose of this study we aggregated the 246 food categories in the FOODEX into 14 food groups that include: beef, pork, poultry, other meat, fish, dairy, eggs, bakery, cereal and pasta products, fruit, vegetables, fats and oils, other food, and non-alcoholic beverages.
In the FOODEX data commodity prices were not recorded, we instead used unit values (defined as the ratio of expenditure to quantity) in place of market prices. Since unit values reflect both market prices and consumer choices of food quality, we adjusted the elasticity estimates, as in Deaton (1988) and Huang and Lin (2001), to exclude the food quality effects. With this adjust-ment we obtained a complete set of demand information that include own and cross price elas-ticities, as well as, expenditure elasticities.
Results appear to be consistent with economic theory. Own price elasticities are negative and less than 1 with the exception of other foods. The demand for poultry, other meat, dairy, fruit, non-alcoholic beverages and other food were more price elastic than the rest of the food groups, with elasticities ranging from -0.81 to -1.14 and all are significant at a 5 percent confidence level. Cross price elasticities are also within the acceptable range. Expenditure elasticities (both unadjusted and adjusted for food quality effects) are positive and less than 1 with the exception of fruit and vegetables.
SECTION 1
Analysis of policy decisions related to agricultural food markets requires information about the response of consumers’ demand for food commodities as prices and income change. For instance, the incentive to establish a traceability program for beef production may require the adoption of new technologies or procedures that may imply increasing costs and hence prices. By knowing demand elasticities for beef, policy makers may be able to infer the impact that the government policy on traceability would have on the demand for beef.
There are two objectives for this project. The first objective is to estimate food demand elasticities for major food groups in Canada. This includes own and cross price elasticities and income elas-ticities. The second objective is to identify the quality effects and the factors that influence changes in food expenditure patterns in Canada.
The rest of the paper is organized as follows: the second section summarizes recent trends in food consumption and expenditure in Canada. This is followed by a brief review of the literature on food demand modeling and estimation related to Canada. The fourth section discusses the data, data sources and data limitations. The fifth section gives a brief description of the model used in this study. The sixth section presents the empirical results, while the last section provides a summary of the analysis as well as some policy implications. Tables and bibliographies are appended at the end of the document.
Demographics and the trends in
food consumption and
expenditure in Canada
SECTION 2
We are interested in looking at the various demographic variables that may explain the observed changes in consumers’ demand. As a result, in this section, we look at: changes in income, meals away from home, food quality, household size and type, degree of urbanization and regional factors and how they relate to food consumption in Canada. These factors will be important inputs in the modeling of consumer demand.
Changes in income
Income growth and subsequent changes in food con-sumption are key elements of shifts in food demand. As presented in Figure 1, per capita disposable income grew from $20,172 in 1993 to $22,082 in 2003, which represents an increase of 9.5 percent over 10 years. As real per capita disposable income has increased, the
share of personal disposable income spent on food1 by
Canadians has declined (Figure 2). In 2003 the share of disposable income spent on food reached 10.6 percent, slightly less than the 1993 level of 12.9 percent.
Over the same period of time, food prices increased by 20.4 percent, at about the same rate as the CPI for all items excluding food (Figure 3).
As real per capita disposable income has increased and the share of personal disposable income spent on food by Canadians has decreased, food spending patterns seem to have changed as well.
Share of personal disposable income spent on food 10.0 10.5 11.0 11.5 12.0 12.5 13.0 13.5 1993 1995 1997 1999 2001 2003 Pe rc en t
Share of personal disposable income spent on food 10.0 10.5 11.0 11.5 12.0 12.5 13.0 13.5 1993 1995 1997 1999 2001 2003 Per ce n t
Share of personal disposable income spent on food 10.0 10.5 11.0 11.5 12.0 12.5 13.0 13.5 1993 1995 1997 1999 2001 2003 Pe rc en t FIGURE 2
Source: Statistics Canada, Canada Food Stats 2004.
Share of personal disposable income spent on food 10.0 10.5 11.0 11.5 12.0 12.5 13.0 13.5 1993 1995 1997 1999 2001 2003 Pe rc en t
Share of personal disposable income spent on food 10.0 10.5 11.0 11.5 12.0 12.5 13.0 13.5 1993 1995 1997 1999 2001 2003 Per ce n t
Share of personal disposable income spent on food 10.0 10.5 11.0 11.5 12.0 12.5 13.0 13.5 1993 1995 1997 1999 2001 2003 Pe rc en t FIGURE 2
Source: Statistics Canada, Canada Food Stats 2004.
Real per capita disposable income (2002 dollars) 19 20 21 22 23 1993 1994 1995 1996 1997 1998 1999 2000 2001 2002 2003 Th ou sa n d s
Real per capita disposable income (2002 dollars) 19 20 21 22 23 1993 1994 1995 1996 1997 1998 1999 2000 2001 2002 2003 Th o u sa n d s
Real per capita disposable income (2002 dollars) 19 20 21 22 23 1993 1994 1995 1996 1997 1998 1999 2000 2001 2002 2003 Th o u sa n d s FIGURE 1
Source: Statistics Canada, CANSIM, Table No. 384-0013. Base year changed to 2002=100.
Real per capita disposable income (2002 dollars) 19 20 21 22 23 1993 1994 1995 1996 1997 1998 1999 2000 2001 2002 2003 Th ou sa n d s
Real per capita disposable income (2002 dollars) 19 20 21 22 23 1993 1994 1995 1996 1997 1998 1999 2000 2001 2002 2003 Th o u sa n d s
Real per capita disposable income (2002 dollars) 19 20 21 22 23 1993 1994 1995 1996 1997 1998 1999 2000 2001 2002 2003 Th o u sa n d s FIGURE 1
4
SECTION 2
The Estimation of Food Demand Elasticities in Canada
Meals away from home
Canadian food spending patterns are changing towards more convenient types of food. Canadian households are increasingly spending more on meals away from home. In 2001 for example, the share of meals away from home in the total family food expenditure reached 30.3 percent, up from 27.6 percent in 1996. Overall, from 1982 to 2001 meals away from home shows an
increasing trend with a single spike in 19922, Figure 4.
The shift in household food spending towards ready-to-eat food shows that consumers are buying food that is easy and fast to prepare. Annual growth in sales ranging from 31 to 81 percent for refrigerated entrées, frozen and refrigerated pizza, diet meat and energy
bars and drinks have been recorded3. This seems to
suggest that Canadian consumers are now increasingly looking for convenient food products.
Food quality
Scientific evidence linking diet choices to health, such as dietary fat with cholesterol and transfats with heart disease among others, along with safety aspects of food consumption such as E-coli and salmonella, have increased consumer awareness and concerns.
Food components and attributes identified as key in influencing consumer perceptions for food include: information on nutrition, labelling, packaging, quality, taste, convenience and food safety in relation to the product itself and the production process. Increased health awareness by consumers has resulted in positive changes in the diets of Canadians.
According to a 2001 research study done by the National Institute of Nutrition4 Canadians are
moving towards food that is lower in fats and high in fibre. Canadians are eating leaner meat, more high fibre foods, whole grains, and fresh vegetables and fruits.
Indeed, for some food commodities, household spending seems to follow this trend. For exam-ple, the percentage of total weekly expenditure in meat per household decreased by 6.5 percent-age points between 1982 and 2001 (Table 1). The same decreasing trend in food spending was
1. Food, beverages and tobacco.
2. In this study, we found this spike unusual. According to Statistics Canada, the spike may be explained due to changes in income from 1989 to 2001. Total income and income after tax increased rapidly until 1989; then it started declining until 1993 and returned to the 1989 levels around 1999. It is believed that households may have taken a couple of years after 1989 to adjust their expenditure patterns to lower income levels.
3. AC Nielsen, Marketplace Performance Report/52 Weeks Ending December 29, 2001: Total Grocery, taken from the State of the Industry Report, 2002.
4. National Institute of Nutrition, Canadians are moving toward healthier eating. Retreat from the web site at www.nin.ca/ public_html/Publications/HealthyBites/hb1_94en.html.
Share of meals away from home in total family food expenditure
30.3 27.6 30.2 26.7 25.3 22 23 24 25 26 27 28 29 30 31 32 1982 1986 1992 1996 2001 Pe rc e n t
Share of meals away from home in total family food expenditure
30.3 27.6 30.2 26.7 25.3 22 23 24 25 26 27 28 29 30 31 32 1982 1986 1992 1996 2001 Pe rc e n t
Share of meals away from home in total family food expenditure
30.3 27.6 30.2 26.7 25.3 22 23 24 25 26 27 28 29 30 31 32 1982 1986 1992 1996 2001 Pe rc en t FIGURE 4
Source: Statistics Canada, Food Expenditure in Canada, Catalogue No. 62-554.
Share of meals away from home in total family food expenditure
30.3 27.6 30.2 26.7 25.3 22 23 24 25 26 27 28 29 30 31 32 1982 1986 1992 1996 2001 Pe rc e n t
Share of meals away from home in total family food expenditure
30.3 27.6 30.2 26.7 25.3 22 23 24 25 26 27 28 29 30 31 32 1982 1986 1992 1996 2001 Pe rc e n t
Share of meals away from home in total family food expenditure
30.3 27.6 30.2 26.7 25.3 22 23 24 25 26 27 28 29 30 31 32 1982 1986 1992 1996 2001 Pe rc en t FIGURE 4
Share of meals away from home in total family food expenditure
30.3 27.6 30.2 26.7 25.3 22 23 24 25 26 27 28 29 30 31 32 1982 1986 1992 1996 2001 Pe rc e n t
Share of meals away from home in total family food expenditure
30.3 27.6 30.2 26.7 25.3 22 23 24 25 26 27 28 29 30 31 32 1982 1986 1992 1996 2001 Pe rc e n t
Share of meals away from home in total family food expenditure
30.3 27.6 30.2 26.7 25.3 22 23 24 25 26 27 28 29 30 31 32 1982 1986 1992 1996 2001 Pe rc en t FIGURE 4
Source: Statistics Canada, Food Expenditure in Canada, Catalogue No. 62-554.
Consumer price index
40 50 60 70 80 90 100 110 120 130 1980 1983 1986 1989 1992 1995 1998 2001 In d e x 1 992= 100
Consumer price index
40 50 60 70 80 90 100 110 120 130 1980 1983 1986 1989 1992 1995 1998 2001 In d e x 19 92 = 1 00
Consumer price index
40 50 60 70 80 90 100 110 120 130 1980 1983 1986 1989 1992 1995 1998 2001 In d e x 1 9 9 2= 10 0 FIGURE 3
Source: Statistics Canada, CANSIM Table No. 326-0002.
All-items excluding food Food
Consumer price index
40 50 60 70 80 90 100 110 120 130 1980 1983 1986 1989 1992 1995 1998 2001 In d e x 1 992= 100
Consumer price index
40 50 60 70 80 90 100 110 120 130 1980 1983 1986 1989 1992 1995 1998 2001 In d e x 19 92 = 1 00
Consumer price index
40 50 60 70 80 90 100 110 120 130 1980 1983 1986 1989 1992 1995 1998 2001 In d e x 1 9 9 2= 10 0 FIGURE 3
Source: Statistics Canada, CANSIM Table No. 326-0002.
Consumer price index
40 50 60 70 80 90 100 110 120 130 1980 1983 1986 1989 1992 1995 1998 2001 In d e x 1 992= 100
Consumer price index
40 50 60 70 80 90 100 110 120 130 1980 1983 1986 1989 1992 1995 1998 2001 In d e x 19 92 = 1 00
Consumer price index
40 50 60 70 80 90 100 110 120 130 1980 1983 1986 1989 1992 1995 1998 2001 In d e x 1 9 9 2= 10 0 FIGURE 3
Consumer price index
40 50 60 70 80 90 100 110 120 130 1980 1983 1986 1989 1992 1995 1998 2001 In d e x 1 992= 100
Consumer price index
40 50 60 70 80 90 100 110 120 130 1980 1983 1986 1989 1992 1995 1998 2001 In d e x 19 92 = 1 00
Consumer price index
40 50 60 70 80 90 100 110 120 130 1980 1983 1986 1989 1992 1995 1998 2001 In d e x 1 9 9 2= 10 0 FIGURE 3
Source: Statistics Canada, CANSIM Table No. 326-0002.
All-items excluding food Food
Food consumption and expenditure in Canada
observed for dairy products and eggs and fats and oils. During the same period spending on cereals and vegetables increased slightly.Changes in household size and type
The composition of Canadian households has shifted over the last two decades. Food spending patterns also seem to have changed as a result.
Canadian households have become more heterogeneous and smaller, and more female house-hold members are now part of the labour force. The average size of a Canadian househouse-hold has
declined gradually from 2.76 persons in 1982 to 2.57 in 20015. One-fourth of this household
pop-ulation was made up of either one person or a lone parent; the proportion of this type of house-hold has increased since 1992. Similarly, the participation of women aged 15 and over in the labour force continues to increase from 42 percent in 1976 to 57 percent in 2003 while the
partici-pation rate for men has stabilized at 67 percent6.
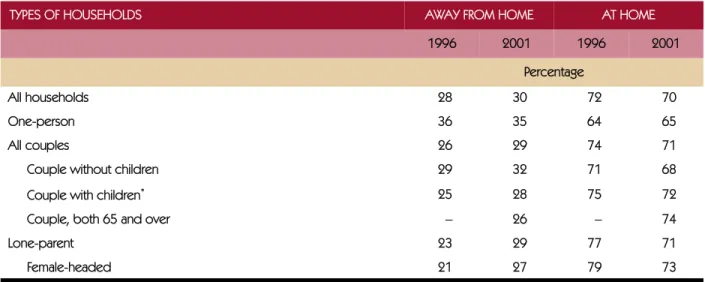
Canadian households also seem to prefer the convenience of eating out and take out food. For instance, couples with and without children and lone parent families headed by a woman now spend more than 27 percent of every dollar spent on food in restaurants, cafeterias or take out food. This is an increase of 3 to 6 percentage points between 1996 and 2001 (Table 2).
Regional factors
Food preferences and spending patterns are also changing in urban and rural areas. Between 1996 and 2001, both rural and urban consumers allocated a bigger share of their budget towards food purchases from restaurants. For example, of every dollar spent on food purchases in 2001,
Table 1: Percentage of total weekly food expenditure per household in Canada (locally and on day trips)
FOOD GROUP 1982 1986 1992 1996 2001
Percentage
Meat 20.5 18.5 16.3 15.7 14.0
Fish and other marine products 2.3 2.3 2.3 2.3 2.3 Dairy products and eggs 13.2 12.9 11.3 11.4 10.2 Bakery and other cereal products 9.3 9.6 10.3 11.2 10.1 Fruit and nuts 7.7 8.0 7.6 8.0 7.9
Vegetables 6.5 6.5 6.5 6.8 7.0
Fats and oils 1.4 1.1 0.9 1.0 0.8 Non-alcoholic beverages 2.4 2.9 3.2 3.3 2.7 Other food* 10.0 10.4 10.5 11.6 12.4
*Includes sugar and sugar preparations; condiments, spices and vinegar; coffee and tea; and other food, materials and food
prep-arations.
Source: Food Expenditure in Canada 2001, Catalogue No. 62-554-XIE.
5. Statistics Canada, Catalogue No. 62-554, Catalogue No. 62-554-XPB and Canada Food Stats CD Rom 2003. 6. Statistics Canada, Catalogue No. 89FO133XIE, 2003.
6
SECTION 2
The Estimation of Food Demand Elasticities in Canada
rural and urban households spent 27 and 31 cents respectively on food purchases from restau-rants. This is an increase of 3 cents from the 1996 share of 24 and 28 cents respectively, for rural and urban households (Table 3).
The spending patterns of urban and rural consumers across food groups seem to have also changed in the last five years. In 2001, urban and rural consumers spent less of their budget on meat, bakery, and fats and oils and more of their budget on fish, fruit, vegetables and other food than they did in 1996.
In the same period, the spending patterns on dairy products and eggs have remained stable for consumers in urban areas while decreasing for rural consumers by 7.7 percent (Table 4). The big-gest percentage increase in food spending by urban consumers between 1996 and 2001 was on other foods.
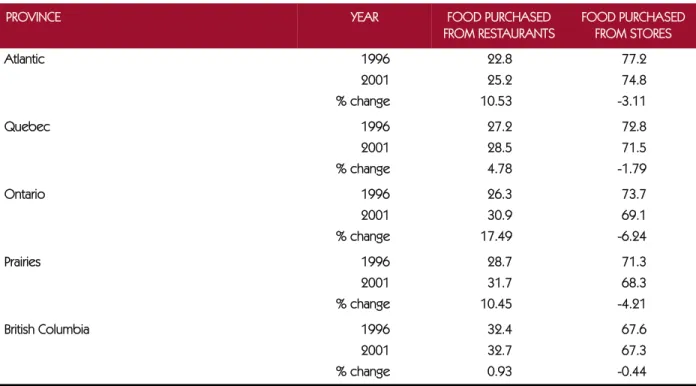
Food preferences are also changing among Canadian regions (Table 5). In 2001, for example, con-sumers in British Columbia, Ontario and the Prairies, spent the largest share of their food budget on food purchases from restaurants. Regionally, Ontario recorded a significant increase in the share of food away from home, more than any other province in Canada. Above average dispos-able income in the provinces of Alberta, British Columbia and Ontario is believed to be behind
the observed higher restaurant sales.7
Table 2: Percentage of total weekly food expenditure for selected types of households
TYPES OF HOUSEHOLDS AWAY FROM HOME AT HOME
1996 2001 1996 2001 Percentage
All households 28 30 72 70
One-person 36 35 64 65
All couples 26 29 74 71
Couple without children 29 32 71 68 Couple with children* 25 28 75 72
Couple, both 65 and over – 26 – 74
Lone-parent 23 29 77 71
Female-headed 21 27 79 73
*Children of any age who are single (never married) include foster children.
Source: Food Expenditure in Canada 2001, Catalogue No. 62-554-XIE (page 10), Family Food Expenditure 1996, Catalogue No. 62-554-XPB (pages 70-79).
Table 3: Percentage of total weekly food expenditure on food purchased from restaurants and from stores
ALL RURAL ALL URBAN
1996 2001 1996 2001 Food purchased from restaurants 0.24 0.27 0.28 0.31 Food purchased from stores 0.76 0.73 0.72 0.69
Food consumption and expenditure in Canada
The observed trends in food consumption and food preferences by various income groups, household size, area, region and gender provide us with interesting insights into some of the
7. Canadian Restaurant and Food Services Association: “Household spending at restaurants cools in 2003”, 2001.
Table 4: Average weekly expenditure per household by food group, (percentage change 1996-2001)
RURAL URBAN
1996 2001 % change 1996 2001 % change Meat 18.59 18.33 -1.40 17.30 17.17 -0.75 Fish and other marine products 2.01 2.46 22.39 2.77 2.87 3.61 Dairy products and eggs 14 12.92 -7.71 12.42 12.64 1.77 Bakery and other cereal products 13.3 12.75 -4.14 12.31 12.47 1.30 Fruit and nuts 8.19 8.47 3.42 9.05 10.06 11.16 Vegetables 7.13 8.3 16.41 7.73 8.73 12.94 Fats and oils 2.33 2.76 -8.63 2.15 2.53 -12.50 Other food* 2.56 3.67 16.15 2.49 2.90 25.18
Non-alcoholic beverages 1.79 1.47 -11.27 1.59 1.40 -7.71
*Includes sugar and sugar preparations; condiments, spices and vinegar; coffee and tea; and other food, materials and food
prep-arations.
Source: Family Food Expenditure in Canada 1996 and 2001, Catalogue No. 62-554-XPB and No. 62-554-XIE.
Table 5: Percentage of total food expenditure, by province, 1996-2001
PROVINCE YEAR FOOD PURCHASED
FROM RESTAURANTS FOOD PURCHASED FROM STORES
Atlantic 1996 2001 % change 22.8 25.2 10.53 77.2 74.8 -3.11 Quebec 1996 2001 % change 27.2 28.5 4.78 72.8 71.5 -1.79 Ontario 1996 2001 % change 26.3 30.9 17.49 73.7 69.1 -6.24 Prairies 1996 2001 % change 28.7 31.7 10.45 71.3 68.3 -4.21 British Columbia 1996 2001 % change 32.4 32.7 0.93 67.6 67.3 -0.44
Source: Statistics Canada, Food Expenditure 1996, Catalogue No. 62-554-XPB and Food Expenditure in Canada 2001, Cata-logue No. 62-554-XIE.
8
SECTION 2
The Estimation of Food Demand Elasticities in Canada
forces behind the changing consumer demands for food in Canada. Eating habits of Canadians today are significantly different from what they were a decade or two ago.
These changes in food consumption will be incorporated into the consumer demand model that will be used in this study. Proxies that explain changes in urbanization, regionalization, income, household size and type will also be considered.
SECTION 3
Previous consumer demand
studies in Canada
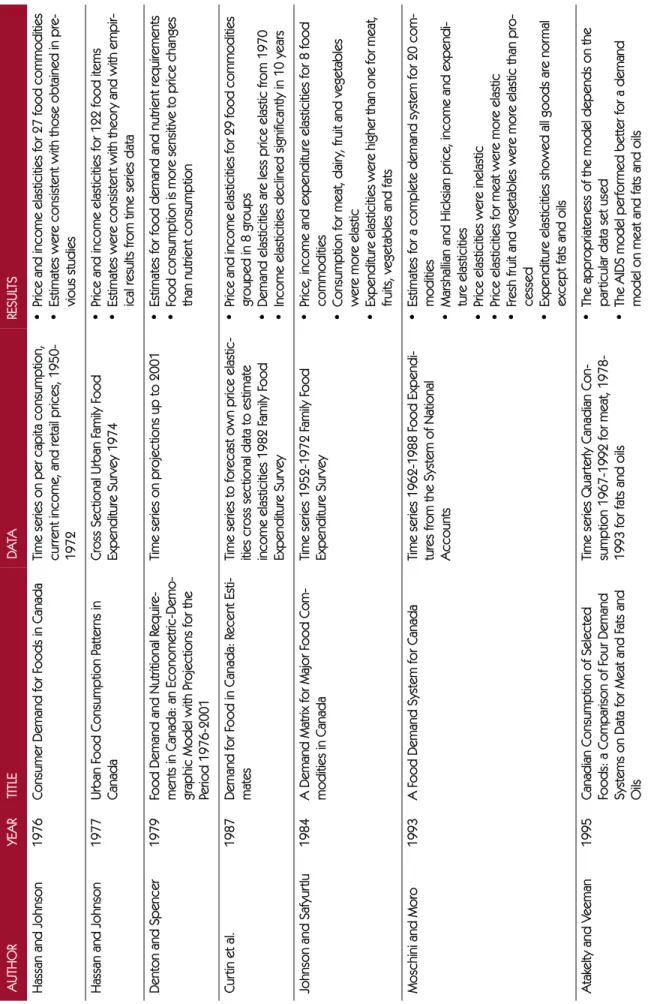
This section provides a brief summary of previous consumer demand studies for Canada. A number of studies have been conducted in Canada since the early 1970’s and 1980’s to estimate the consumer demand for food.
Hassan and Johnson (1976) estimated individual demand functions for important food commod-ities in Canada and developed a full demand matrix. By employing time series data, for the period 1950 to 1972, on per capita consumption, current income and retail prices, the authors derived price and income elasticities of demand for the various food commodities included in the study. Using individual estimated parameters as augmented by results from a previous study by Hassan and Lu (1974), the authors developed a complete set of demand parameters for 27 food commodities. Results showed that demand for food is inelastic with respect to price and income, and the estimates were consistent with those obtained in previous studies in Canada. Hassan and Johnson (1977) estimated direct price elasticities from cross sectional data. They ana-lyzed food consumption patterns of urban families in Canada using the 1974 Urban Family Food Expenditure Survey. A semi-logarithmic function was used to estimate Engel curves and esti-mate direct price and income elasticities for 122 food items. Results showed that the estiesti-mated elasticities were consistent with theory and with other available empirical estimates from time series data.
Denton and Spencer (1979) developed an econometric model of food demand and nutritional requirements in Canada. The objective was to model nutrient requirements and to provide pro-jections up to 2001, under different scenarios of economic and demographic developments. The authors reported a series of 13 projections and provided insights into the effects of changes in demographic, technology and income. Results indicated that while food consumption patterns are sensitive to price changes, nutrient consumption was less responsive to changes in price and income. The average per capita daily nutrient requirements were found to be sensitive to changes in age distribution and the number of pregnant and nursing women in the population, but barely responsive to differences in immigration levels. The projections also suggested that the future rates of technical progress in the economy would alter food expenditures and eating habits of Canadians. These results are actually supported by recent trends in food consumption and expenditure in Canada, as presented in the previous section.
10
SECTION 3
The Estimation of Food Demand Elasticities in Canada
Using Canadian data, Curtin et al. (1987) updated most of the elasticities estimated by Hassan and Johnson in 1976. The study estimated demand elasticities for 29 food commodities grouped in meats, beverages, vegetables, fats and oils, cheese, ice cream and eggs. Own price elasticities were estimated by ordinary least squares using time series data. Income elasticities were derived based on the results of Engel analysis using cross sectional data. The authors found that demand elasticities were less price elastic than in the 1970’s while income elasticities has declined signifi-cantly during the previous 10 years.
Johnson and Safyurtlu (1994) estimated a set of final demand parameters for major food groups in Canada for the period 1960 through 1981. By using restricted least squares to impose the Slut-sky conditions on the model and by using the stochastic restrictions represented by the sample data, the authors estimated price, income and expenditure elasticities. Result showed that elas-ticity estimates have the predicted signs. Consumption for meats, dairy, and fruit and vegetables were more responsive to changes in price than consumption for cereals, sugar and fat. Food expenditure elasticities were higher than one for meat, fruits and vegetables and fat.
Moschini and Moro (1993) specified and estimated a complete demand system for Canadian food consumption. They specified and estimated a set of 20 equations, two stage model relying on explicit separability assumptions within the parametric form of the Almost Ideal Demand System. The authors computed price elasticity matrices using annual food expenditures from the system of national accounts, food away from home and non-food expenditure data. Results showed a system of food demand that is generally inelastic to both own price and total expendi-tures with cross elasticity effects. Their estimates of food expenditure elasticities showed that all goods were normal, with the exception of fats and oils. Meat products appeared to be somewhat more expenditure elastic than dairy products, bread and bakery, sugar and other food. Fresh fruits and vegetables were more expenditure elastic than processed fruit and vegetables.
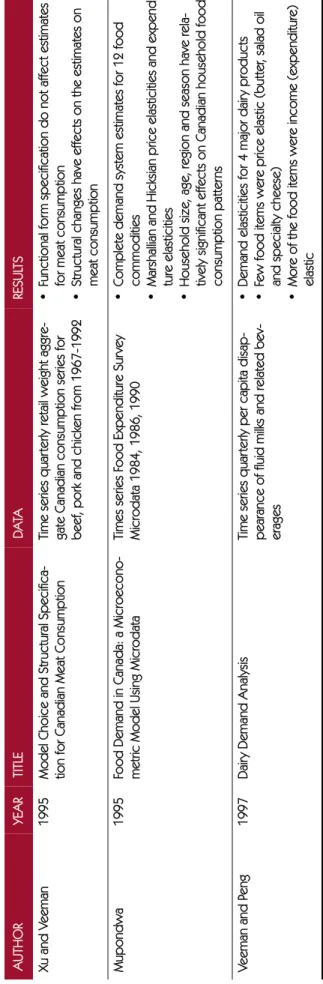
Hailu and Veeman (1995) compared the empirical performance of the Rotterdam, Almost Ideal Demand System (AIDS), Central Bureau of Statistics (CBS) and National Bureau of Research (NBR) demand models using two sets of quarterly Canadian consumption data expressed in per capita terms and prices: one set for meat, included beef, chicken and pork consumption and prices from 1967 to 1992; the second set, for fats and oils, included margarine, butter, shortening and salad oil from 1978 to 1993. The authors concluded that the appropriateness of the model may depend in large measure on the particular data set that is subject to analysis. However, the results on Canadian meats and fats and oils suggested that the AIDS model performs the best among the four applied demand models.
Xu and Veeman (1995) studied the choice of functional form and structural specification in the demand analysis of meat. The data used in this study were quarterly retail weight aggregate Canadian consumption series for beef, pork and chicken, expressed in per capita terms from 1967 to 1992. The authors used two sets of non-nested tests to test the AIDS and Rotterdam mod-els with and without structural changes in Canadian meat consumption patterns. The authors found that the functional specification did not greatly affect estimated elasticities for meat con-sumption but the effects of structural change on the estimates were significant. After structural change, chicken becomes less income elastic and more price elastic while the changes for pork are in the other direction. The changes in elasticities indicated that structural change has been biased in favour of white meat.
Mupondwa (1995) estimated a complete matrix of price, expenditure and demographic parame-ters for a system of 12 food commodities. The study uses 1984, 1986 and 1990 Canadian Food Expenditure Survey microdata. Applying a derivation of the AIDS and the Translog model the
Previous consum
er demand studies in Canada
author generates elasticities for 12 disaggregated food commodities (beef, pork, poultry, other meat, fish, cereals, vegetables, sugars, dairy, fats and oils, non alcoholic beverages and other processed food) and tested for functional form. The results show that the two models are more or less identical in terms of both explanatory power and estimated parameters. Second, Marshallian and Hicksian elasticities agree with economic theory. Third, household size, age, region and sea-son have relatively significant effects on Canadian household food consumption patterns. Veeman and Peng (1997) derived demand estimates for four major dairy product groups using the linearized version of the Almost Ideal Demand System, incorporating seasonality and habit formation variables for each subgroup. The study used quarterly per capita disappearance of fluid milks and related beverages from 1979 to 1993. From the results, both the signs and magni-tudes of the elasticities were according to economic theory, as expected. Only butter, salad oil and specialty cheese were price elastic. Most of the items were income elastic such as soft drinks, coffee and tea, butter, salad oil and pork (albeit barely), ice cream, yoghurt, cheddar cheese and specialty cheese. The authors also found that the estimates of concentrated milk and skim milk powder were income elastic, which reflected the increasing use as inputs in the processing of manufactured and specialty food.
Table 6 summarizes the main results from this literature review on demand estimation in Can-ada.
The Estimation of Food Demand Elasticities in Canada
SECTION 3
12 Ta ble 6: S ummar y of main findings of Canadian lite
rature on food demand AU THOR YEAR TITLE DA TA RESUL TS Ha ssan an d Johnson 1976 Con sumer Dema nd fo r F ood s in C an ad a Ti m e s eri es o n p er ca pi ta co nsu m p tio n, cur rent i ncome , and retai l prices, 19 50-197 2 • Price an d income ela st iciti es fo r 27 fo od c omm odit ie s • Es timates were con sist en t with thos e ob tained in p re-vi ou s s tu d ies Ha ss an an d J ohns on 1977 Urba n F ood Consumption P atter ns in Canada Cross Secti onal Ur ban F ami ly F ood Ex pendi ture S ur vey 1974 • Price an d income elastici ties for 1 22 foo d items • Es timates w ere cons istent w ith theor y and with empir-ica l r esult s from t ime ser ies da ta De nton and Spencer 19 79 Food De mand and Nutr itional R equire-me nt s i n C ana da : an Ec on om et ric-D emo -gr aphic Model wi th Pr ojecti ons for the Pe riod 1 976-20 01 Time ser ies on pr ojecti ons up to 2 001 • Estimat es f or food d ema nd a nd nu tri ent re qu irem ent s • Fo od co ns um pt io n is m ore s ens itiv e to p rice c han ge s th an n utrient consumption Cur tin et al. 19 87 D emand for F ood in Cana da : R ec en t Es ti-ma te s Time seri es to forecast own pr ice elasti c-ities cros s s ectional data to es timate income e last icit ies 19 82 F am ily F oo d Expendit ure Su rv ey • Price and in come elast ic iti es fo r 2 9 food commod ities gro up ed i n 8 gro up s • D emand el asti cities ar e less pri ce elastic fro m 19 70 • Income e lasticities decl ined signifi cantl y i n 1 0 ye ar s
Johnson and Saf
yur tlu 1984 A Deman d Ma
trix for Major F
ood Com-m odit ie s i n Canada Time ser ies 195 2-197 2 F ami ly Food Expendit ure Su rv ey • Pr ice, i ncome and expe nd itur e elastici ties for 8 food commod ities • Consum p tion for m eat, d ai ry , fr ui t and vegetabl es we re mo re el as tic • Expend itur e elasti ci ties wer e higher than o ne fo r meat, fruit s, vegeta bles an d fa ts M
oschini and Moro
1993
A F
ood Demand System
for Canada Time ser ies 196 2-198 8 F ood E xp end i-ture s fro m the S ystem of National Accoun ts • Est ima tes f or a com p let e dem and sy st em f or 20 com-mod ities • M arsh allian and Hick sian pri ce, income and ex pendi-tu re ela st ic iti es • Pr ice el asti citi es wer e inel asti c • Pr ice el asti citi es fo r meat wer e mo re el asti c • Fre sh fr ui t a nd v ege tabl es w ere m ore e la st ic th an pr o-cessed • Expend itur e elastici ties showed all g
oods are nor
m al ex ce pt fat s an d o ils At ak el ty an d Veem an 19 95 Ca na d ian Consumption of Selected Fo od s: a C om p ar ison of F our De m and Sy st ems on D ata fo r Mea t an d F ats a nd Oils Time ser ies Qu ar te rly Ca na di an Con -sump tion 1967 -1 992 fo r meat , 19 78-199 3 for fat s and oi ls • The app ropr iateness of the mo del depend s on the par tic ular data se t us ed • The AID S m ode l pe rfo rme d be tte r f or a d ema nd mod el on me at and fats and oi ls
Previous consum
er demand studies in Canada
Xu and V eeman 1995 Model Choice and Str uctural
Specifica-tion for Cana
dian M eat Consumpt ion Ti me s eri es q uar te rly retai l weig ht aggr e-ga te Cana dian consu m pt
ion series for
beef , pork and chi ck en fr om 19 67-199 2 • Fu nct io na l f or m s p ec ifi cat io n d o no t af fe ct e sti ma te s for meat consu m pt ion • Str uctu ra l ch anges h ave effect s on t he es timat es on mea t consumption Mupondwa 1995 Fo od Demand in Cana da : a Microec on o-metric Mod el Usi ng Microd ata Ti mes ser ies F ood Expe nd itur e Sur vey Micr odata 19 84, 198 6, 19 90 • Compl ete dem and system estim ates fo r 12 food commodit ies • M arsha llian and Hicks ian pric e ela st icit ies and expendi-ture ela sticities • H ousehol d size, ag e, reg ion and se ason have re la-tively si gnificant effects on Canadi an househol d food consumpt ion pat ter ns Veeman a nd P eng 1997 Da iry Deman d Analysis Ti me s eri es q uar te rly per capi ta d isap-pe ar an ce o f fl ui d m ilk s an d r ela te d b ev-er ag es • Dema nd elas ticities for 4 major da iry p rod uct s • Few
food items wer
e pr ice el as tic (bu tter , s al ad oil
and specialty cheese)
• M or e of the food ite m s wer e income ( expendi ture ) el astic Ta ble 6: Summar y of main findings of Cana dian literature on food d emand (Continued) AU THOR YEAR TIT LE DA TA RE SU LT S
SECTION 4
Data used to estimate demand
elasticities
The food expenditure survey
Since 1953, Statistics Canada has conducted 17 household Food Expenditure Surveys. Starting in 1972, these surveys were carried out in a periodic base but were restricted to selected cities. The Food Expenditure Surveys for 1969, 1982, 1986, 1992, 1996 and 2001 included small urban and rural areas to provide a better coverage of Canada. The 2001 survey covered the 10 Canadian provinces as well as Whitehorse, Yellowknife and Iqaluit.
The data were collected by personal interview of one or more household member. In the inter-view households were asked to record expenditures on food for a period of two consecutive weeks. The sample size for the Food Expenditure Survey was 9,488 dwellings of which 8,414
were eligible households8. After screening, a total of 5,999 households participated in the
interviews from which 5,643 are included in FOODEX. The response rate for the 2001 Household Food Expenditure Survey was 71.3 percent.
The Food Expenditure Survey 2001 classifies food consumption in two categories: food con-sumed at home and food concon-sumed away from home. Data on food concon-sumed at home includes food purchased locally and on day trips and food purchased while on trips overnight or longer. In this study, we focus on food consumed at home that corresponds to purchases on day trips. This is because households did not report expenditures on each food item while on trips over-night or in restaurants; rather they reported total food expenditures.
Food consumed at home9 and on day trips data, which were collected under purchases from
stores in quantity and in dollar value, is defined in more than 246 food categories and aggregated into 12 food groups. The groups include: meat, fish and other marine products, dairy products
8. Eligible households were those selected and were occupants of the selected dwelling. A total of 1,074 dwellings were not con-sidered because they were vacant, under construction, demolished, moved, abandoned, or converted to business premises or were occupied by persons not to be interviewed or living temporarily.
9. Food consumed at home is sometimes consumed as purchased but more often is converted into meals. This home production element is important but not addressed here.
16
SECTION 4
The Estimation of Food Demand Elasticities in Canada
and eggs, bakery and other cereal products, fruits and nuts, vegetables, condiments, spices and vinegar, sugar and sugar preparations.
The FOODEX database
FOODEX is a compiled micro-database of the 2001 Food Expenditure Survey that provides the basis for this study. The FOODEX database includes 5,643 households from the total of 5,999 households that were interviewed. It excludes records from Whitehorse, Yellowknife and Iqaluit. FOODEX is comprised of two files, the summary household file and the detailed food category file. The summary household file has 11,034 weekly records for every household (1 or 2 weeks) and 79 variables. It summarizes the dollar expenditure of each household in 14 food groups. The detailed food category file has 456,219 records and 7 variables. Each food category has a record by week and by store for each household. The detailed food category file presents dollar expend-iture value and quantities of 257 food categories by household. Quantities of each of the food cat-egory in FOODEX are expressed by different units of measurement such as litres, kilograms and number of units.
FOODEX 2001 also provides data on various socio-economic and demographic characteristics of Canadian households. It collects data on each household by:
• Region
• Size of area of residence: rural and urban
• Characteristics of reference person: marital status, age, and gender • Characteristics of spouse of reference person: age of spouse
• Household description: household type, household size, number of seniors (65 years or more), number of adults (25 to 64 years), number of youths (15 to 24 years), number of children (under 15 years), number of economic families in households and income group.
Estimation database
For the purpose of this study, we grouped the 246 food categories into 14 food groups: beef, pork, poultry, other meats, fish, dairy, eggs, bakery, cereal and pasta products, fruits and nuts, vegetables, fats and oils, other food-food materials and preparations, and non-alcoholic bever-ages (see Appendix A for details).
In calculating weekly averages, the number of weeks reported by each household was consid-ered. For the households that reported two weeks, an average weekly expenditure was calcu-lated by simple average. For the households that reported only one week, the value reported was assumed to be representative of average weekly expenditure. This procedure corresponds to the one recommended by Statistics Canada, under the guidelines for Data Tabulation, Analysis and Dissemination in the 2001 Food Expenditure Survey Public-use Micro-data Files.
Quantities of each of the various food categories in the detailed food category file in the database are expressed in different units of measurement such as litres, kilograms and number of units. Prior to aggregation, quantities of each food item were converted to kilograms. The conversion factors used are those developed by Agriculture Agri-Food Canada’s Value Chain (see Appendix B).
D
a
ta use
d
to estim
ate dem
a
nd elasticitie
s
Since not all households reported consumption of all food categories, the unit value for those non-consuming households is treated as missing. In dealing with missing data, the mean value
was used to replace missing values. Bernier et al. (2002) recommended this approach10.
In calculating the unit value for a food group, unit values for individual categories in the groups were calculated and then aggregated using weighted average unit value.
Shares of total food expenditure for each of the 14 food groups were calculated by dividing the expenditure of each food group by the sum of expenditures of all 14 food aggregates. The expen-ditures include food purchased from stores while on trips overnight or longer and food pur-chased locally and on day trips. Since consumers did not report quantities with total expenditures while on overnight trips, these expenditures were allocated proportionately to pur-chases from local stores based on the respective shares of each food group.
In FOODEX, household11 disposable income includes income from all sources for all household
members in a year. Twelve income groups were defined in the Food Expenditure Survey. Respondents were asked to indicate in which of these income groups their household income fell. In our analysis, only households with positive incomes were considered. As a result, 456 households were eliminated from the sample. Eliminating the 456 observations left us with a sample of 4,685 households.
For each income group, the upper and lower income levels are reported. In this study we per-form sensitivity analysis on the upper and lower income levels to identify the income level to be
included in the model12. Estimates were significant for the lower level of each income group. As
a result, this is the level that was used as a proxy for income for each household.
Household size data are used to calculate per capita values. For example, the per capita at home food expenditure is derived by dividing the average weekly at home food expenditure by house-hold size.
Not all observations available were used. Households with zero total weekly food expenditure, zero total weekly food expenditure in stores, and income not stated were excluded. Similarly, households with expenditure share of a food group equal to 1 (29 in total) were removed. Extreme values (5 percent in total) were deleted as these were considered to be outliers. A sam-ple of 4,685 households remained.
In this analysis the following socio-economic and demographic characteristics are considered: the lower range of disposable income per household, per household expenditure at home, away from home share of the food budget, gender of the head of the household (household reference
person13), age of the head of the household (less than 25 years, 25 to 44, 45 to 64, and 65 and over),
household composition (one person household, couple with children, couple without children,
10. This is when the absence of information in a survey is limited to some variables and when the probability of response for a var-iable of interest is the same for all units in the population. Use of mean value is an option among others given by Bernier et al. (2002).
11. Statistics Canada defines a household as a person or group of persons occupying one dwelling unit.
12. A sensitivity analysis was performed by first running the demand model with the upper limit of income and later running the same model with the lower limit of income. We found that most of the coefficients were significant in the model when we use the lower limit of income.
13. Household reference person is the member of the household who has been chosen by the respondents to be responsible for the household financial maintenance.
18
SECTION 4
The Estimation of Food Demand Elasticities in Canada
single (either one person or a lone parent household) with children), size of area of residence
(rural and urban) and region (West, Central, East)14. Appendix C contains the summary of the
variables used in this study. Dummy variables were created to represent socio-economic and demographic characteristics of the households.
14. For the purposes of this paper Central region refers to respondents who reside in Manitoba, Saskatchewan or Alberta; East region refers to respondents who reside in Quebec, Ontario or the Atlantic.
SECTION 5
Model specification
At a grocery store/local market, food commodities are purchased in elementary products where each product is homogeneous and has its own distinctive price. The traditional utility maximiza-tion problem facing a household, in this case, can be expressed in terms of the elementary
com-modities as follows:
where is the price of the elementary commodity, S is the number of commodities, and M
is household income.
In practice, a large number of elementary commodities are available in the market/grocery
store15. This prohibits the estimation of a system of all of them. These commodities are, as a
result, aggregated into 14 food aggregates. Let N=14 be the number of aggregate food categories where N<S.
Then under the weak separability assumption, equation (1) can be written in terms of the N
aggregate food commodities as follows:
where , , which is the unit value of the aggregate commodity , and
, which is the expenditure on aggregate commodity .
15. The Food Expenditure Survey data used in this study, for example, are comprised of more than 246 elementary commodities.
q
s (1) . . .. ,... , 1 2 1 q q st P q M q U MAX s S s s sP
ss
thQ
j(
,
,...
..
)
.
.
(2)
1 2 1Q
Q
s
t
V
Q
M
Q
U
MAX
j N j j N∑
=
= ∑ = ∈y i i j q QQ
Y
V
j j j=
Q
j q P Y i j i i j = ∑ ∈Q
j20
SECTION 5
The Estimation of Food Demand Elasticities in Canada
The solution to equation (2) gives:
Estimated elasticities from equation (3) will not be correct because, as demonstrated by Deaton
1988 (page 421, equation (4)), the unit value of an aggregate commodity is a product of
aver-age market prices and a quality choices index, as indicated in equation (4):
Following Deaton (1988) and Huang and Lin (2000) it is clear that unit values can be used in place of market prices to estimate prices provided the resulting elasticities are adjusted to remove the quality effects (the last item in equation (4)) embodied in the unit values.
In this study we assumed that food consumption decisions (for various food categories) are made separately from consumption decisions for other goods and services. In other words, con-sumption decisions are made in a two-stage budgeting process, as a result, we allocated food expenditures to various food categories.
The demand for each food category is expressed as a function of food expenditures and a set of prices for food categories. In the FOODEX data, prices of each food category are not reported. We instead used unit values in place of market price as in Deaton (1988) and Huang and Lin (2000), where unit value is calculated as a ratio of expenditure to quantity.
The empirical model employed in this study is similar to the Almost Ideal Demand System model (AIDS) suggested by Huang and Lin (2000). The model consists of a modified version of an AIDS and a set of unit value equations. By applying Shepard’s lemma, Huang and Lin (2000) derived a modified version of an AIDS, in which food expenditure share of a food category is a function of unit values and the related food expenditures as follows:
where: is at home food expenditure share of aggregate commodity i for household h.
is the unit value of the food category is per capita at home food expenditures
is a unit value aggregate index derived using the following formula:
where: is at home food expenditure share. All subscripts of variables and summation
throughout this paper refer to a total of N aggregate food commodities (i, j = 1,2, …., N).
(
1, 2,... ,)
, j=1,2,...N (3) =Q V V V M Qj j NV
jP
jπ
j( )
(
5
)
ln
ln
V
X
V
*W
ih=
α
i+
∑
jβ
ij j+
ϕ
i Wih VjX
V*)
6
(
ln
ln
V
*=
∑
jW
jV
jW
jM
o
del specification
The system of share equations (equation 5) also includes household demographics as independ-ent variables. The following properties of a theoretically consistindepend-ent demand function were
directly imposed on the system16:
Symmetry: Adding up: Homogeneity:
The second set of equations following the approach by Deaton (1988) and thereafter Huang and Lin (2000) is the set of unit values. This equation captures the influence of economic and socio-demographic factors on unit values. Two proxies are used: per capita food expenditure and the proportion spent on food away from home. Per capita food expenditure captures the link between income, consumption and quality. Our prior expectation is that there is a positive rela-tionship between unit value and per capita food expenditure. Thus, a consumer who is well off will spend more on better quality food products. The second proxy is the proportion spent on food away from home. This variable captures the value consumers attach to taste and conven-ience. A consumer who values more convenience will spend more on food away from home. Therefore, a positive relationship will exist between unit values and the proportion of food away from home.
where: is the portion of the total food budget spent on food away from home by
household h.
is a vector of household socio-demographic variables17.
is the elasticity of unit value with respect to per capita expenditure for food consumed at home. It is obtained by taking the following derivative:
.
Price and expenditure elasticities are derived by differentiating equations (5) and (6) with respect to unit values and expenditure to obtain the following expressions. Note that price elasticities are uncompensated or Marshallian.
Own price elasticity: Cross price elasticity: Expenditure elasticity:
16. The restrictions mean that the cost/expenditure function is homogeneous of degree one in prices and income. 17. Definitions of the socio-demographic variables are in Appendix C.
ji ij
β
β
= 1 ∑iα
i= 0 = ∑ = ∑ = ∑iϕ
i iβ
kj jβ
ijH
1,2,...,
h
and
N
1,2,...,
i
)
7
(
log
ln
=
=
∑
+
+
=
X
FAFH
HSDV
V
ihψ
iφ
i ih kγ
ik kh FAFHih HSDVhψ
i X Vi log log ∂ ∂(
-
)
/
W
-
1
(8)
:
ty
:
Ω
ii=
(
β
ii-
ϕ
iW
i)
/
W
i-
1
(8)
ty
Ω
ii=
β
iiϕ
iW
i i(
-)
/ W (9) : y :Ωij=(
β
ij-ϕ
iWj)
/ Wi (9) y Ωij=β
ijϕ
iWj i(
ij- i)
j( )
1- i (10) i i : yη ϕ β ϕ ψ + ψ ⎥⎦ ⎤ ⎢⎣ ⎡ +∑ = i j(
ij- iW j)
j Wi( )
1- i (10) i : yη ϕ β ϕ ψ + ψ ⎥⎦ ⎤ ⎢⎣ ⎡ +∑ = j W j Wi22
SECTION 5
The Estimation of Food Demand Elasticities in Canada
Equation (1) was estimated as a system of thirteen equations by Seemingly Unrelated Regression
(SUR). The fourteenthequation was dropped to ensure non-singularity, since household shares
sum to one i.e. . The parameters of the fourteenth equation are
however, recoverable using the symmetry, adding up and homogeneity restrictions. Equation (7) was estimated by Ordinary Least Squares (OLS). In both cases SHAZAM Version 9 Econometric Software is used.
The uncompensated, or Hicksian elasticities can be derived from the Marshallian elasticities using the formula:
Hicksian elasticity:
where: is the compensated (Hicksian) elasticity of demand of food commodity i with respect
to the price of commodity j, is the uncompensated (Marshallian) elasticity of demand of food
commodity i with respect to the price of commodity j, is the expenditure elasticity for
com-modity i and is the share of total expenditure accounted for by the purchase of commodity j.
The compensated elasticities have the property that and will always have the same sign.
H) 1,2,..., (h h. 1 ∀ = = ∑ i W ih (11) W N i ij j H ij =Ω +
ε
ij NiWj (11) H ij =Ω +ε
ε
H ij ΩijN
i Wjε
H ijε
H jiSECTION 6
Econometric results and
elasticity estimates
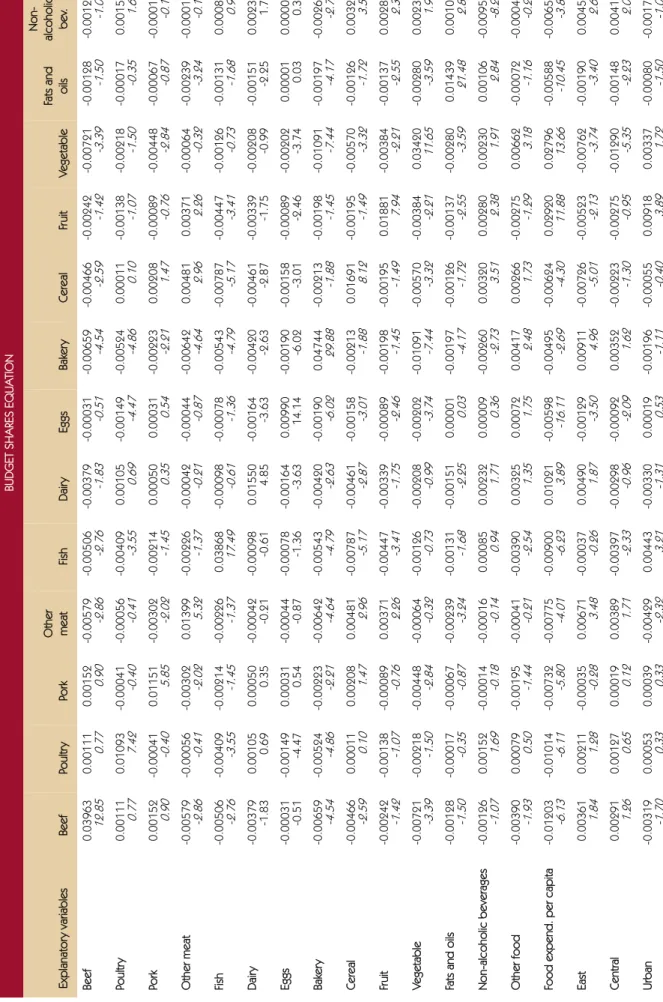
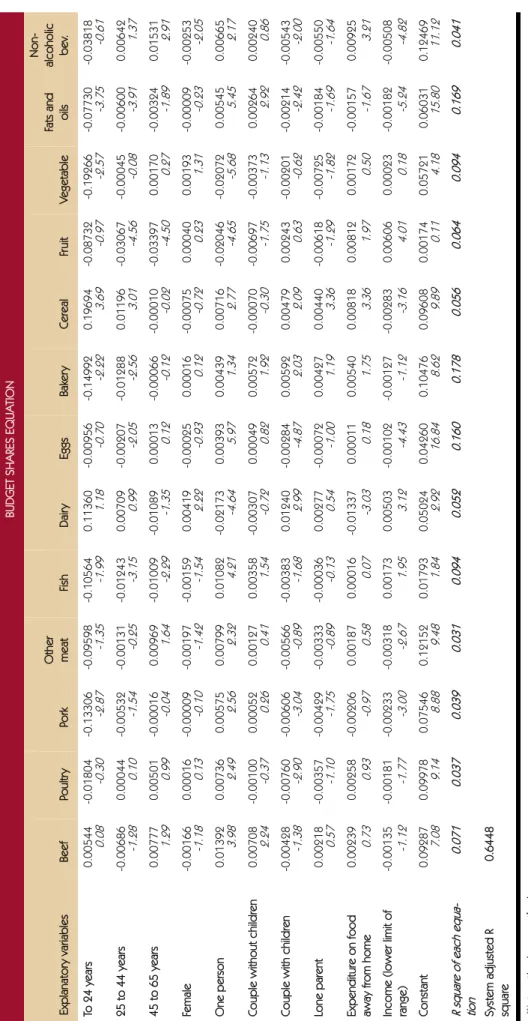
System of share equations
The estimated coefficients of the at home food expenditure share equation (5), are presented in Table 7. The R-squares calculated independently for each equation are relatively low ranging from 0.03 (for the other meat equation) to 0.18 (for the bakery equation). Whereas these coeffi-cients measure the fit of changes in shares of each food group, they are not useful indicators of fitness of the model as it is the overall adjusted R-square of the system which is 0.64.
The standard errors of all the estimated coefficients for the share equations are low ranging from 0.0002 (for the cross non-alcoholic beverage-egg coefficient) to 0.0032 (for the own dairy coeffi-cient). The smaller standard error indicates the lower margin of error of these estimates to the true value. Because the estimated coefficients in the share equation are relatively high compared to the cross coefficients, t- values for the own estimated coefficients are highly significant. Never-theless, most of the estimated coefficients are statistically significant at a 95 percent level.
The estimated coefficients for unit values have positive effects on the budget shares within each particular food group with the exception of non-alcoholic beverages, which has a negative effect. This may indicate that as the average market price changes and consumer choices of food quality improve, households assign more of the budget to the expenditure of all food groups and less on non-alcoholic beverages.
Per capita food expenditure coefficient (as a measure of household budget) is negative for beef, poultry, pork, other meat, fish, eggs, bakery, cereal, fats and oils, and non-alcoholic beverages, and positive for dairy, fruit and vegetables. This appears to suggest that as the per capita food expenditure increases the share of beef, poultry, pork, other meat, fish, eggs, bakery, cereal, fats and oils, and non-alcoholic beverages in the food budget decreases, whereas that for dairy, fruit and vegetables increases.
Before assessing the impacts of socio-demographic18 variables on budget shares, it is important
to recall that one category within each group of socio-economic variables was used as a base