ARC AND PLC AS A SAFETY NET: HOW EFFECTIVE ARE THEY?
A Thesis by
BRAD WEDDELMAN
Submitted to the Office of Graduate and Professional Studies of Texas A&M University
in partial fulfillment of the requirements for the degree of MASTER OF SCIENCE
Chair of Committee, Joe L. Outlaw Committee Members, David Anderson
Monty Dozier Head of Department, David J. Leatham
August 2019
Major Subject: Agricultural Economics Copyright 2019 Brad Weddelman
ii
ABSTRACT
The 2014 Farm Bill allowed farmers to choose between Agriculture Risk Protection (ARC) and Price Loss Coverage (PLC). The choice between ARC and PLC was made in a high commodity price environment that did not require a safety net for farmers. The purpose of a farm safety net is to pay farmers in need but avoid making payments when payments are not needed.
The study analyzes the decision made by farmers and determines if ARC and PLC provide a viable safety net. The study utilizes data collected by the Agricultural and Food Policy Center (AFPC) from representative farms across the country as well as data from farmdoc at University of Illinois. The study analyzes the economic loss seen by the representative farms and if ARC or PLC provide the support needed when facing such economic loss. The analysis is done by looking at historic data as well as a stochastic simulation of the farms going forward.
ARC was described as a shallow loss program and proved to help farmers in the years of decline from the record high prices leading up to the 2014 Farm Bill. However, the analysis shows that ARC provides support at times when no loss is seen while not providing support at times when support is needed. PLC provides support to a farmer whenever the price of corn falls below $3.70 and shows to provide better long-term support.
iii
ACKNOWLEDGEMENTS
I would like to thank my committee chair, Dr. Joe Outlaw, and my committee members, Dr. David Anderson, and Dr. Monty Dozier for their help and support throughout this research. I would also like to thank Dr. James Richardson for his guidance and being my original committee chair up to his retirement. I would remiss to not mention your amazing patience in this process. After more than two long years I am finally completing this process and none of it would have been possible without your guidance. I am greatly appreciative of all your tutelage while I was at Texas A&M and continued tutelage as I started work in Washington D.C. Your expertise in helping build my simulation model was the basis of my thesis and I would never have been able to complete this research without your help in initiating my research.
I would like to thank Dr. Joe Outlaw for his assistance and support over the past four years. The background to all of my farm policy data was first learned through your guidance while assisting with you policy class. I would quite literally never be where I am today without the amazing opportunities that you made available to me. Your support and encouragement to make the move to Washington D.C. will be forever appreciated as will your patience after delaying my thesis. I will continue to rely on your advice going forward in agricultural policy as well as everything else.
I cannot leave out the entire Combest, Sell and Associates crew as they have been patient with me over the past two years as I continued to say my thesis will be finished soon. Without their support and encouragement throughout this entire process I would not have been able to continue to work on this research. I was also able to use much of what I learned while with Combest, Sell and Associates to improve my research.
iv
Finally, thank you to all of my friends and family who have continued to encourage me to continue my research through very busy times. Without all of you continuously reminding me that I needed to get back to my research and be sure to finish, I am not sure that I would have had the drive to come to a finalized product.
v
CONTRIBUTORS AND FUNDING SOURCES
Contributors
This work was supervised by a thesis committee consisting of Professor Joe Outlaw and Professor David Anderson of the Department of Agricultural Economics and Professor Monty Dozier of the Department of Soil and Crop Sciences.
The data analyzed was provided by the Agricultural and Food Policy Center. The analyses were done with the assistance of Simetar, provided by Dr. Joe Outlaw.
All other work conducted for the thesis was completed by the student independently.
Funding Sources
Graduate study was supported by a fellowship from Texas A&M University as well as an assistantship from Texas A&M University.
vi
TABLE OF CONTENTS
ABSTRACT... ii
ACKNOWLEDGEMENTS ... iii
CONTRIBUTORS AND FUNDING SOURCES ... v
LIST OF FIGURES ... vii
LIST OF TABLES ... viii
INTRODUCTION ... 1 Objective ... 3 LITERATURE REVIEW ... 4 METHODOLOGY ... 11 Data ... 12 Model Development ... 14 RESULTS ... 18
Individual Farm Results ... 19
CONCLUSIONS ... 37
BIBLIOGRAPHY ... 40
vii
LIST OF FIGURES
FIGURE Page
1 Zulauf and Orden ARC and PLC Estimates ... 7 2 Corn Price Forecast ... 18 3 Historical MYA Corn Price ... 28 4 Probability that ARC payment did not cover economic loss (red) and probability
that ARC payment more than covered economic loss (green) for Southern Illinois farm ... 30 5 Probability that PLC payment did not cover economic loss (red) and probability
that PLC payment more than covered economic loss (green) for Southern Illinois farm ... 30
viii
LIST OF TABLES
TABLE Page
1 Annual ARC, PLC, and Net Income Projections for the Iowa Grain Farm
(IAG1350), 2014-2026 ... 20 2 Annual ARC, PLC, and Net Income Projections for the Iowa Grain Farm
(IAG3400), 2014-2026 ... 20 3 Annual ARC, PLC, and Net Income Projections for the Missouri Grain Farm
(MOCG2300), 2014-2026... 21 4 Annual ARC, PLC, and Net Income Projections for the Missouri Grain Farm
(MOCG4200), 2014-2026... 21 5 Annual ARC, PLC, and Net Income Projections for the Nebraska Grain Farm
(NEG2400), 2014-2026 ... 22 6 Annual ARC, PLC, and Net Income Projections for the Nebraska Grain Farm
(NEG4300), 2014-2026 ... 22 7 Annual ARC, PLC, and Net Income Projections for the Indiana Grain Farm
(ING1000), 2014-2026 ... 23 8 Annual ARC, PLC, and Net Income Projections for the Indiana Grain Farm
(ING2200), 2014-2026 ... 23 9 Annual ARC, PLC, and Net Income Projections for the Texas Grain Farm
(TXWG1600), 2014-2026... 24 10 Annual ARC, PLC, and Net Income Projections for the Texas Grain Farm
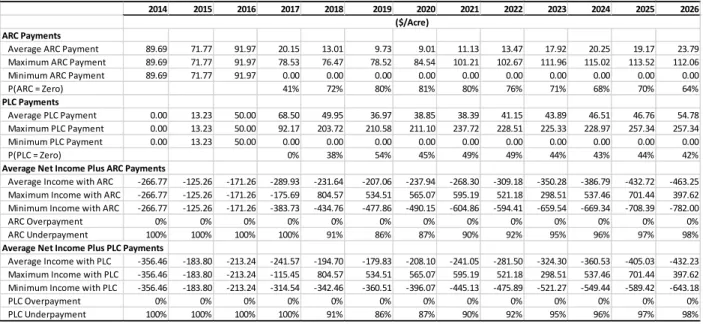
(TXNP3450), 2014-2026 ... 24 11 Annual ARC, PLC, and Net Income Projections for the Texas Grain Farm
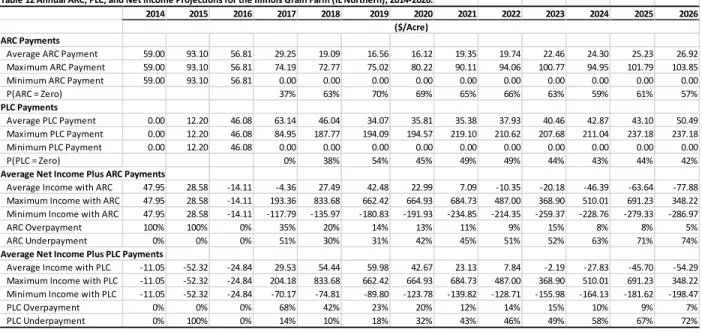
(TXNP10640), 2014-2026 ... 25 12 Annual ARC, PLC, and Net Income Projections for the Illinois Grain Farm
(IL Northern), 2014-2026 ... 25 13 Annual ARC, PLC, and Net Income Projections for the Illinois Grain Farm
(IL Central High), 2014-2026 ... 26 14 Annual ARC, PLC, and Net Income Projections for the Illinois Grain Farm
ix
15 Annual ARC, PLC, and Net Income Projections for the Illinois Grain Farm
(IL Southern), 2014-2026 ... 27 16 Annual ARC, PLC, and 50/50 Scenario Projections for the Iowa Grain Farm
(IAG1350), 2014-2026 ... 33 17 Annual ARC, PLC, and 50/50 Scenario Projections for the Iowa Grain Farm
(IAG3400), 2014-2026 ... 33 18 Annual ARC, PLC, and 50/50 Scenario Projections for the Missouri Grain Farm
(MOCG2300), 2014-2026... 34 19 Annual ARC, PLC, and 50/50 Scenario Projections for the Missouri Grain Farm
(MOCG4200), 2014-2026... 34 20 Annual ARC, PLC, and 50/50 Scenario Projections for the Nebraska Grain Farm
(NEG2400), 2014-2026 ... 34 21 Annual ARC, PLC, and 50/50 Scenario Projections for the Nebraska Grain Farm
(NEG4300), 2014-2026 ... 34 22 Annual ARC, PLC, and 50/50 Scenario Projections for the Indiana Grain Farm
(ING1000), 2014-2026 ... 34 23 Annual ARC, PLC, and 50/50 Scenario Projections for the Indiana Grain Farm
(ING2200), 2014-2026 ... 34 24 Annual ARC, PLC, and 50/50 Scenario Projections for the Texas Grain Farm
(TXWG1600), 2014-2026... 35 25 Annual ARC, PLC, and 50/50 Scenario Projections for the Texas Grain Farm
(TXNP3450), 2014-2026 ... 35 26 Annual ARC, PLC, and 50/50 Scenario Projections for the Texas Grain Farm
(TXNP10640), 2014-2026 ... 35 27 Annual ARC, PLC, and 50/50 Scenario Projections for the Illinois Grain Farm
(IL Northern), 2014-2026 ... 35 28 Annual ARC, PLC, and 50/50 Scenario Projections for the Illinois Grain Farm
(IL Central High), 2014-2026 ... 35 29 Annual ARC, PLC, and 50/50 Scenario Projections for the Illinois Grain Farm
x
30 Annual ARC, PLC, and 50/50 Scenario Projections for the Illinois Grain Farm
1
INTRODUCTION
The Agricultural Act of 2014, also referred to as the 2014 Farm Bill, was written in a time of historically high crop prices. High crop prices caused difficulty in writing a farm bill because legislators felt less pressure to provide a safety net for American farmers when the need was not eminent. The safety net provided by the farm bill is not designed to always make
payments to farmers, but rather only in the times of need caused by events outside of a farmer’s control. Therefore, in 2014, Congress passed a farm bill which gave farmers a choice between two different programs, Price Loss Coverage (PLC) and Agricultural Risk Coverage (ARC) as a safety net against low prices and incomes.
PLC covers commodities much like the Counter Cyclical Payments program (CCP) that was used from 2002 until 2013, where a farmer will receive assistance if the marketing year average (MYA) price falls below a reference price. For example, the reference price of corn is $3.70, and wheat is $5.50. The payment yield is set at the 2008 Farm Bill CCP program yield that can be updated to the average yield from 2008 to 2012 if higher. PLC is paid on 85 percent of the base acres for that particular commodity.
The ARC program has two options, county or individual coverage, the county option calculates payments based on average county yields; whereas, the individual option calculates payments based on individual farm yields. ARC payments are made when the ARC county revenue guarantee is higher than the actual county revenue. The actual county revenue is the MYA price multiplied by the average county yield for that particular year. The ARC county revenue guarantee benchmark is calculated by taking a five year historic Olympic average of the MYA price and yield for a particular county. An Olympic average is calculated by taking the
2
average of the past five years and dropping the highest and lowest figure. The ARC county revenue guarantee is 86 percent of the benchmark revenue. The total ARC payment is capped at 10 percent of the benchmark revenue; therefore, the ARC payment covers from 76 to 86 percent of the benchmark revenue. The county ARC program pays on 85 percent of base acres, and individual ARC pays on 65 percent of base acres.
Corn was a major point of focus in the debate between ARC and PLC selection when the 2014 Farm Bill was being debated. With record high corn prices in 2012 nearing the seven dollar per bushel mark many did not see corn reaching the reference price of $3.70 per bushel in the PLC program. However, the ARC program took into account those record high years that
preceded 2014 and would all but guarantee payments for farmers at lower prices which were still higher than the PLC reference price. This led to high enrollment in the ARC county program for Midwestern corn farmers. As reported by the USDA for corn, 91 percent of farms elected ARC county compared to only 9 percent choosing PLC (USDA, 2015). When comparing base acres, these percentages move to 93 percent choosing ARC and only 7 percent choosing PLC (USDA, 2015). Due to the almost guaranteed payments farmers were assumed to receive in 2014 and 2015 because of the five year Olympic average, ARC had a much higher enrollment rate.
The decision to choose ARC or PLC for Midwest corn farmers was made based on which would provide higher payments, rather than which would provide payments when farmers were facing economic losses. When the cost of producing a crop outweighs the income received by that crop, a farmer is faced with an economic loss. When farmers are facing such economic losses, the farm bill is designed to assist and help farmers through these tough economic times. On the other hand, the farm bill is also be designed to ensure this assistance is not being provided while farmers are not facing these economic losses. Taxpayers do not want to be expected to
3
provide assistance when farmers are making money off of their crop. However when farmers are facing economic losses it is in the best interest of the entire country to provide assistance to farmers to ensure that the United States continues to provide the safest and most affordable food supply to its citizens.
Objective
This study will analyze the ARC and PLC options of the 2014 Farm Bill with a focus on corn. The study will test whether the ARC program makes payments to farmers when they are not warranted based on economic loss. The structure of the ARC program uses a rolling five year Olympic average that makes payments as prices and/or yields decrease, but due to the
benchmark using a rolling 5 year average of prices, it is not designed to make payments at low prices if prices have remained low for several years. The high election rate for the ARC program was due to the high corn prices in 2011 and 2012 that neared the seven dollar per bushel mark. However, prices fell rather quickly after the 2014 Farm Bill was passed and the moving average will no longer account for the high prices of 2011 and 2012. The objective of this study is to test whether or not corn farmers across the country received ARC payments when they did not have an economic loss.
4
LITERATURE REVIEW
The literature germane to this study can be broken down into two major categories. The first category is the analysis of the ARC vs PLC programs at the time of farm bill approval and during the decision time farmers had to choose between ARC and PLC. The second area of literature that must be reviewed is the importance of including risk in a model that analyzes farm bill programs. Literature at the time of passage and during the time the decision between the programs was being made is important to determine what affected decisions farmers were making. Reviewing this literature also allows to see what general forecasts were at the time for price of corn. The second area is important because without including risk in the decision between PLC and ARC a farmer is unable to take the full issue into perspective.
At the time of the 2014 Farm Bill, American agriculture was coming off of the best years it had ever seen for the majority of commodities. Corn in particular saw prices of $5.18, $6.22, $6.89, and $4.46 in 2010, 2011, 2012, and 2013, respectively. The bill was passed in February of 2014 which means most of the analysis was made without a 2014 price and only a projected price for 2013. Times of high prices make writing a farm bill difficult because farmers generally had a high net cash income (NCI). This created an issue of fashioning a safety net in a time that no safety net was needed. A farm bill is typically designed to help farmers and ranchers in times of need not in times of prosperity. Agriculture is cyclical in nature meaning the agricultural economy goes through cycles of good and bad economic times.
Another way to describe the business cycle that is seen in agriculture is by using the term “boom or bust.” Henderson, Gloy, and Boehlje (2011) use this term in their paper entitled
Agriculture’s Boom-Bust Cycles: Is This Time Different? Agriculture often goes through periods of high profitability followed by low profitability. Their paper outlines three of these cycles
5
1910s to 1930s, 1940s to 1960s, and 1970s to 1990s, as well as the current cycle as the paper was written in 2011. At that particular time, the farm economy was in a period of “boom” as opposed to currently where the time would be considered a “bust.” Agriculture being a “boom or bust” industry creates difficulty in writing a farm bill that provides enough support to survive a
production year but not so much support as to help farmers when financial support is not needed, thus creating a situation where farm programs encourage excess production.
The 2014 Farm Bill was a perfect example of policy being written to try to avoid
providing assistance when it was not needed. There were record high commodity prices with the previous farm bill still in place that distributed direct payments to producers. The 2014 Farm Bill however removed direct payments and replaced them with the ARC and PLC program. The ARC and PLC programs were implemented to help farmers and ranchers in times of need rather than on a continuous basis.
ARC and PLC both guard against poor economic times in agriculture, however the programs go about it in different manners. ARC guards against falling income using a moving Olympic average of the past five years revenue but does not guard against sustained low prices. PLC on the other hand does not provide assistance until a low price threshold is reached but pays the difference each year’s prices are below said threshold. These starkly contrasting
methodologies of ARC and PLC are compared in Zulauf and Orden’s paper “The US
Agricultural Act of 2014 Overview and Analysis.” The authors analyze the 2014 Farm Bill and focus on ARC and PLC and the potential costs of the programs.
The interesting approach to the analysis in the Zulauf and Orden paper is that they use three deterministic price forecasts to get a low, average, and high price scenario. Using different price scenarios allows the analysis to take into account multiple price scenarios and how those
6
price scenarios affect payments. However, what their study does not take into account is the variability of other data. By using only one set of predicted yields the results ignore the high variability in yields experienced in the agricultural sector and the different yield risks in different counties and states. The model developed for the present study will treat both price and yield as stochastic variables to account for the high variability (risk) the agricultural sector faces on a regular basis.
When analyzing the cost of ARC and PLC under each price scenario for years 2014 to 2018, the differences between the two programs can be seen. The cost of PLC stays the same throughout the years for each price scenario whereas the ARC payments start higher and then shrinks to zero in both the low and middle price scenario. However, the total payments made by ARC from 2014 to 2018 under a low price scenario were $16.9 billion compared to $5 billion in PLC payments. The middle price scenario yielded $6.3 billion in ARC payments compared to $2.8 billion in PLC payments. The high price scenario yielded $0 in ARC payments and $1.1 billion in PLC payments. PLC payments were still made under a high price scenario because rice prices were under PLC reference price in the high scenario.
7
Figure 1 Zulauf and Orden ARC and PLC Estimates (Zulauf, Orden; 2014)
ARC payments outpaced PLC payments in both the low and middle price scenario for the five-year projection, but payments were only projected for the first three years of the five-year analysis. Zulauf and Orden show how ARC payments were projected to help absorb losses when prices declined but, were not projected to help during sustained low prices. This same
observation can be made when looking at CBO’s June 2017 Baseline for Farm Programs. ARC payments in 2016 are $4.5 billion compared to PLC payments of $0.8 billion in 2016. Going forward into the projections by CBO, ARC payments are projected to again outpace PLC payments in 2017 with the gap closing considerably thereafter and PLC payments overtaking ARC payments in 2020. When looking at the CBO baseline it is important to keep in mind that payments are on a federal fiscal year basis and not indicative of the year that the crop is grown. CBO fiscal year 2016 payments are for the crop that was harvested in 2014. For example, 2016
8
is the first year to have ARC and PLC payments in the CBO baseline compared to the analysis by Zulauf and Orden that began in 2014.
Both the analysis by Zulauf and Orden, and the actual payments reported in the CBO baseline show how ARC was designed to be front loaded on payments with very little to no protection against the sustained low prices projected in agriculture. Zulauf and Orden showed sustained low prices by using the same projected prices and yields for each year analyzed while the CBO shows varying prices in the years going forward. By doing so, Zulauf and Orden show that PLC payments will be stagnant at a price floor while ARC payments will dissolve as the five year moving Olympic average no longer uses the high prices in the years preceding 2014. The Zulauf and Orden study shows that farmers had an option to take ARC payments that were almost surely going to pay in the initial years, or PLC payments that would protect them against long-run low prices should they occur.
As observed by program signup/election between ARC and PLC most (93%) corn producers chose to take large upfront payments from ARC instead of the protection offered by PLC. Apparently, producers could not pass up the opportunity for large payments in the near term in exchange for a true safety net with a price floor.
The CBO’s June 2017 Baseline for Farm Programs is also useful to see the changing dynamics in the choice between ARC and PLC. The baseline assumes producers would be allowed to change their selection with a new farm bill that was to be developed in 2018. Currently 93 percent of producers chose ARC and only 7 percent chose PLC, however in the updated CBO Baseline, the new projected election is 18 percent enrolled in ARC compared to 82 percent enrolled in PLC. This assumption is made based on the low price market price forecast indicating PLC would be projected to pay better than ARC going forward. The analysis done in
9
this study will analyze payments going into the future as well as highlighting which program will be more beneficial to producers. Including risk in the model will allow for this analysis to be thorough and analyze many possible price and yield scenarios.
Including risk in a model that analyzes price and yield is extremely important because deterministic price forecasts are generally “steady state.” What is meant by the term “steady state” is that the forecasts often forecast prices near the current price without large fluctuations. Irwin and Good discuss this issue in their paper “Long-Term Corn, Soybeans, and Wheat Price Forecasts and the farm bill Program Choice.” Irwin and Good analyze past predictions of price to show that many of the forecasts are “steady state” unless a near term downturn is highly
probable. However, even with an immediate decline in price the forecasts often tend to level off with rather stagnant forecasts. Much of this is to do to the fact supply and demand shocks are incredibly difficult to predict.
Not being able to predict shocks to price, creates a need to include risk when building a model. A stochastic price and yield forecast allows the model to analyze many possible
combinations of price and yield to take into account price and yield fluctuations that cannot be forecasted. The model developed for the present study will take risk into consideration by analyzing many possible price and yield scenarios by using 500 alternative corn prices for each year as well as 500 alternative county and farm yields. In their paper, Irwin and Good compare both USDA predictions and futures predictions with the actual MYA prices. By comparing the Mean Absolute Percent Errors (MAPE) of the USDA and Futures forecasts, it is easy to see as forecasts get longer accuracy decreases. The MAPE values for both USDA and Futures forecasts are near 40 percent when nearing 8 years and are roughly 15 percent for a one-year forecast.
10
When forecasting a 10-year budget regarding the farm bill a 40 percent error rate will skew the projected vs. actual spending.
Using a stochastic model does not fix this error completely but helps give a range of forecasts with associated probabilities instead of a deterministic point forecast. Richardson, Klose, and Gray write about the importance of simulation and Multivariate Empirical probability distributions in their paper “An Applied Procedure for Estimating and Simulation Multivariate Empirical (MVE) Probability Distributions In Farm-Level Risk Assessment and Policy
Analysis”. Richardson, Klose, and Gray explain the process of using MVE probability distributions to forecast price and yield in a four-crop model. The same MVE method will be used in this model to forecast yields for ten years. Richardson, Klose, and Gray also go on to note the importance that simulation plays in farm-level policy analysis by both the House and Senate Agricultural Committees. This shows the importance of farm-level policy analysis, and the importance of this study to analyze ARC and PLC payments going forward.
11
METHODOLOGY
This study uses fifteen corn farms across the country to analyze past and future ARC and PLC corn payments. Eleven of these farms are be representative farms managed by Texas A&M’s AFPC, and the other four are four regions of Illinois gathered for FarmDoc by the University of Illinois faculty. ARC and PLC payments on these farms are analyzed with a stochastic simulation model created in excel using Simetar. The stochastic simulation model allows for the comparison of ARC and PLC payments with stochastic corn prices and yields.
The corn per acre cost of production is used for all of the farms. The cost of production is separated into variable costs that are dependent upon simulated yield, and fixed costs dependent upon on budgeted yields. These costs are then analyzed against projected prices and yield in a stochastic simulation model. The model is evaluated on a per acre basis for every farm to determine the loss or gain per planted corn acre.
ARC and PLC payments are included in the analysis to determine how much the
payments are contributing to profit or at least helping to reduce losses. This analysis is important to determine if ARC and PLC payments are being paid when they are needed and if they cover the farmer’s losses. The payment rate for simulated ARC and PLC payments are based on the stochastic forecasted prices and yields.
The forecasted prices come from the 2017 March FAPRI (Food and Agriculture Policy Research Institute) projections of national corn prices. The model is simulated for 10 years. Stochastic prices are simulated about the means and stochastic farm and county yields are simulated annually. The distributions for yields are multivariate empirical based on historical
12
data. Stochastic prices come from the FAPRI baseline. The farm level history is based on the representative farms, and the county yields come from USDA RMA data.
The model analyzes the potential profit or loss faced by farmers across the country, and the extent that ARC and PLC payments assist each farm. The results will include the probability of loss or profit, probability of receiving either ARC or PLC payment, dollar value for loss or profit, and dollar value for ARC and PLC payments. The model shows which program has been more helpful and what program is projected to be more helpful going forward.
Data
Cost of production data for each farm is gathered from the AFPC database of crop farms and selected farm information provided from the University of Illinois. AFPC manages nearly 100 representative farms across the country. For this analysis, 11 corn farms were chosen. The farms are in the states of: Iowa, Missouri, Nebraska, Indiana, and Texas. The remaining four farms’ data is gathered from the FarmDoc system representing four different areas in Illinois including; Northern, Central High, Central Low, and Southern. Using farms dispersed across the country allows for variation in cost of production, yield risk, and local corn prices received.
The input data included from each farm includes:
• Variable Costs: seed, fertilizer, herbicides, insecticides, irrigation, fuel, drying, and hauling
• Fixed Costs: rent, labor, maintenance and repairs, taxes, fuel, utilities, and insurance
• Crop Insurance level: Most common level of revenue insurance purchased in the county.
13
• PLC Payment Yield: PLC payment yield reported by each farm. Average of Iowa and Indiana for Illinois farms.
• Price Wedge: Price discount or premium from national price received by each farm. Average of Iowa and Indiana for Illinois farms.
• Actual Production History: 11 years of yield and APH for each farm.
• Actual ARC Payments: ARC county payments received for 2014 and 2015 by each county.
• Revenue Protection Final Prices: Final revenue price for crop insurance in 2014 and 2015
• Revenue Protection Election Prices: Price election for revenue protection up to 2017. Price election for 2017 was used for simulated years.
• Budgeted Yields: Long term average yields used by the farmers to budget costs. The past 11 years of yields for each farm were gathered from the AFPC database for the 11 AFPC farms. For the four Illinois farms, a random farm within the study county was chosen from the crop insurance database. The county yields were gathered from USDA RMA data to create an 11 year history for every study county. Using the historical yields from a particular farm and the county, an empirical distribution was created as percent deviations from trend using Simetar. Using this output, correlated uniform standard deviates were calculated using the
correlation matrix developed from the detrended yields data. Using the intercept and slope from the trend regression, deterministic forecasts were made for the next 11 years. The formulas to simulate farm and county yields as multivariate empirical are:
14
Deterministic Forecasts: Intercept + (Slope * period)
Deviates: EMP (Sorted Deviations Array, Probability of Deviates, CUSD) Stochastic Forecast: Deterministic Forecast * (1 + Deviate)
Prices for the model were obtained from FAPRI which allowed for the direct use of their stochastic corn prices rather than simulating the prices. FAPRI provides 500 iterations of
projected prices for each year to 2026, allowing the model to perform out to 2026.
Model Development
The most important element of building this model is determining each farm’s net cash income per corn acre. With that in mind, stochastic corn price received by each farm is
multiplied by the forecasted stochastic yield to project producer market receipts for each year. The total cost of production is then subtracted from total market receipts to determine the net cash income for producing an acre of corn.
Once the net cash income is determined, a potential insurance payment will be calculated. The insurance payment is calculated with the following formulas:
Revenue Guarantee: MAX (Harvest Price, Projected Planting price) * Approved Yield * Coverage Level
Harvest Price: Projected Planting Price * 𝑒𝑒𝜎𝜎√∆𝑡𝑡𝜀𝜀 Notes (Δt = .75) (ε = N (0,0.17))
Realized Revenue: Harvest Price * Actual Farm Yield
15
The ARC payment per acre for each year is calculated following the insurance payment. The actual ARC payment for the county that each farm is located is used for 2014, 2015, and 2016 and the following years are simulated using stochastic forecasts. The following formulas are used to calculate the annual ARC payment per acre.
Price 5 Year Olympic Average: (Sum of previous 5 years – min – max) / 3
County Yield 5 Year Olympic Average: (Sum of previous 5 years – min – max) / 3 Guaranteed Revenue: Price 5 year Olympic Average * County Yield 5 Year Olympic Average * 0.86
Max Payment Rate: Price 5 year Olympic Average * County Yield 5 Year Olympic Average * 0.10
County Actual Revenue: National Price * County Yield
Payment Rate Formula: MAX (Guaranteed Revenue – County Actual Revenue, 0) Payment Rate: MIN (Max Payment Rate, Payment Rate Formula)
The PLC payment rate is then simulated. The PLC payment rate is based off the reference price set for corn which is statutorily set at $3.70/bu. The following formulas are used to
simulate the annual PLC payment rate per acre.
Reference Price less Market Price or Loan Rate: MAX (3.70 – MAX (Loan Rate, National Price), 0)
16
An additional option is calculated as well. A 50/50 option will be calculated by combining half of the ARC and half of the PLC payment into one payment. This option is analyzed due to discussions being had during the time of analysis of possible options for ARC and PLC going forward into the next Farm Bill.
Additionally the coefficient of variation is analyzed for ARC payments, PLC payments, and the 50/50 option. The formula for coefficient of variation is ((Standard Deviation / Mean) *100).
After all of these calculations are made, the key output variables for the model will be calculated. These key output variables are the basis of the results to determine if farmers receive payments when they need them. The following formulas will be used to determine the key output variables.
Economic Loss with Insurance: IF (Net Cash Income + Insurance Indemnity per Acre < 0, 1, 0) (If a farmer faces a loss a 1 will be returned and if not a 0 will be returned) Received ARC: IF (ARC Payment Rate > 0, 1, 0)
Received ARC with no Economic Loss: IF (AND (Net Cash Income + Insurance Indemnity per Acre > 0, ARC Payment Rate > 0), 1, 0)
Dollar Value for Economic Loss: IF (Net Cash Income + Insurance Indemnity per Acre < 0, - Net Cash Income + Insurance Indemnity per Acre, 0)
Dollar Value for ARC: ARC Payment Rate
Economic Loss after ARC: Dollar Value for Economic Loss – Dollar Value for ARC Dollar Value for PLC: PLC Payment Rate
17
Economic Loss after PLC: Dollar Value for Economic Loss – Dollar Value for PLC ARC Income: Net Cash Income + Insurance Indemnity per Acre + ARC Payment Rate PLC Income: Net Cash Income + Insurance Indemnity per Acre + PLC Payment Rate + Loan Deficiency Payment
The key output variables listed above have important differences. The one important difference to note is that the Economic Loss after ARC and ARC Income are not the same. The only way that Economic Loss after ARC can be positive is if the ARC payment is larger than the economic loss. ARC Income on the other hand can be positive if the farmer realizes a profit without the ARC payment. The dollar value for the Economic Loss variable can only be positive or zero, this is to account for the possibility that ARC is paying when farmers are not
experiencing a loss. The purpose of the safety net is to provide farmers with financial assistance when in times of need. This is also true of the PLC payment formulas.
The key output variables are then simulated using Simetar. Simetar uses Latin Hypercube to simulate 500 iterations using a random number seed of 31517. Latin Hypercube is used
opposed to Monte Carlo simulation, because the Latin Hypercube draws random values using a systematic approach, sampling all regions of the probability distribution. Simetar calculates values for mean, standard deviation, covariance, minimum, and maximum of the 500 iterations for each of the key output variables, as well as a list of the 500 iterations.
18
RESULTS
The results are presented for each of the 15 representative farms utilized in the analysis. The purpose of these results is to compare the ARC and PLC program and how each program is able to protect farmers from projected losses resulting from the analysis of stochastic prices and yields. Production costs were gathered from 2016 for each representative farm and then adjusted for inflation for the rest of the years analyzed. Values for 2014, 2015, and 2016 are historic figures so the actual payments for ARC and PLC for these years were used in the calculation.
Figure 2: Corn Price Forecast from FAPRI and CBO
Figure 1 contains price forecasts of corn from CBO for the years 2014, 2015, 2016, and 2017, along with the FAPRI 2017 projections used for this analysis. As can be seen at the time of
19
passage of the 2014 Farm Bill, prices were projected to recover and not fall near the $3.70 reference price. However, in the 2015 CBO projection the prices in 2014 and 2015 are much lower and below the $3.70 reference price. Similar to the 2014 CBO projection, the 2015 CBO projection has prices recovering and rising above the $3.70 reference price. The most current CBO projection, from June of 2017, has prices slowly recovering after 2017 but tapering off and hovering just above the $3.70 reference price, between $3.80 and $4.00. The trend that can be seen in the progressive analysis of the CBO projections for the price of corn is that nearly every year the projected prices fall. The last projection in Figure 1 is the average FAPRI yearly corn price projections used in this analysis. The FAPRI projection is similar to the 2017 CBO projection, but does not recover as high as the CBO projection and hovers around the $3.70 reference price.
Individual Farm Results
Tables 1-15, contain the projected ARC and PLC payments from 2014 to 2026 and net cash farm income with payments added to market receipts and insurance indemnities minus cash costs. The costs used are for 2016 and are adjusted for inflation in 2017-2026 as well as 2014-2015. There is a general trend in all of the farm results that shows average ARC payments being higher in the first two or three years but then tapering off in the remaining years. The opposite is true of PLC in that it starts off low in the first two or three years and then begins to increase going into the later years.
20
Table 1 Annual ARC, PLC, and Net Income Projections for the Iowa Grain Farm (IAG1350), 2014-2026.
2014 2015 2016 2017 2018 2019 2020 2021 2022 2023 2024 2025 2026
ARC Payments
Average ARC Payment 46.80 43.24 53.01 40.14 25.87 21.95 22.13 17.32 18.39 22.30 21.62 23.12 24.43 Maximum ARC Payment 46.80 43.24 53.01 70.90 72.68 72.68 77.24 84.56 83.86 90.63 90.63 90.40 87.41
Minimum ARC Payment 46.80 43.24 53.01 0.00 0.00 0.00 0.00 0.00 0.00 0.00 0.00 0.00 0.00
P(ARC = Zero) 21% 52% 61% 59% 66% 65% 59% 60% 56% 55% PLC Payments Average PLC Payment 0.00 12.75 48.18 66.01 48.13 35.62 37.44 36.99 39.65 42.29 44.82 45.06 52.78 Maximum PLC Payment 0.00 12.75 48.18 88.81 196.30 202.92 203.41 229.06 220.19 217.13 220.63 247.97 247.97 Minimum PLC Payment 0.00 12.75 48.18 0.00 0.00 0.00 0.00 0.00 0.00 0.00 0.00 0.00 0.00 P(PLC = Zero) 0% 38% 54% 45% 49% 49% 44% 43% 44% 42%
Average Net Income Plus ARC Payments
Average Income with ARC -98.37 -96.25 -26.61 -89.25 -51.97 -29.60 -52.44 -81.49 -104.50 -126.51 -142.45 -166.75 -182.56 Maximum Income with ARC -98.37 -96.25 -26.61 107.21 672.29 531.16 538.16 533.57 551.96 470.80 468.61 447.93 363.20 Minimum Income with ARC -98.37 -96.25 -26.61 -175.46 -226.45 -266.74 -279.50 -303.44 -334.28 -369.48 -374.40 -383.10 -444.18
ARC Overpayment 0% 0% 0% 9% 5% 4% 2% 1% 0% 0% 1% 0% 0%
ARC Underpayment 100% 100% 100% 84% 68% 61% 67% 75% 79% 85% 87% 91% 91%
Average Net Income Plus PLC Payments
Average Income with PLC -145.17 -126.74 -31.45 -63.38 -29.71 -15.93 -37.14 -61.82 -83.24 -106.52 -119.26 -144.73 -154.18 Maximum Income with PLC -145.17 -126.74 -31.45 94.10 672.29 531.16 538.16 533.57 551.96 470.80 468.61 447.93 363.20 Minimum Income with PLC -145.17 -126.74 -31.45 -142.62 -147.86 -155.85 -176.90 -190.54 -214.11 -230.61 -258.86 -262.71 -299.06
PLC Overpayment 0% 0% 0% 11% 8% 7% 3% 2% 1% 1% 1% 1% 0%
PLC Underpayment 100% 100% 100% 80% 63% 57% 66% 73% 78% 84% 86% 90% 90%
($/Acre)
Table 2 Annual ARC, PLC, and Net Income Projections for the Iowa Grain Farm (IAG3400), 2014-2026.
2014 2015 2016 2017 2018 2019 2020 2021 2022 2023 2024 2025 2026
ARC Payments
Average ARC Payment 46.80 43.24 53.01 40.14 25.87 21.95 22.13 17.32 18.39 22.30 21.62 23.12 24.43 Maximum ARC Payment 46.80 43.24 53.01 70.90 72.68 72.68 77.24 84.56 83.86 90.63 90.63 90.40 87.41
Minimum ARC Payment 46.80 43.24 53.01 0.00 0.00 0.00 0.00 0.00 0.00 0.00 0.00 0.00 0.00
P(ARC = Zero) 21% 52% 61% 59% 66% 65% 59% 60% 56% 55% PLC Payments Average PLC Payment 0.00 13.01 49.13 67.32 49.09 36.33 38.18 37.72 40.44 43.13 45.70 45.95 53.83 Maximum PLC Payment 0.00 13.01 49.13 90.57 200.19 206.93 207.44 233.60 224.55 221.42 225.00 252.88 252.88 Minimum PLC Payment 0.00 13.01 49.13 0.00 0.00 0.00 0.00 0.00 0.00 0.00 0.00 0.00 0.00 P(PLC = Zero) 0% 38% 54% 45% 49% 49% 44% 43% 44% 42%
Average Net Income Plus ARC Payments
Average Income with ARC -119.70 -116.48 -22.06 -107.55 -70.37 -48.70 -71.64 -101.22 -124.86 -147.52 -163.90 -188.79 -204.57 Maximum Income with ARC -119.70 -116.48 -22.06 58.20 662.93 531.23 538.14 522.67 539.47 462.45 455.27 432.81 355.36 Minimum Income with ARC -119.70 -116.48 -22.06 -205.02 -237.14 -267.59 -288.98 -310.48 -344.68 -399.46 -379.10 -402.85 -447.18
ARC Overpayment 0% 0% 0% 4% 1% 2% 0% 0% 0% 0% 0% 0% 0%
ARC Underpayment 100% 100% 0% 92% 74% 68% 74% 79% 83% 88% 89% 93% 92%
Average Net Income Plus PLC Payments
Average Income with PLC -166.50 -146.71 -25.94 -80.38 -47.15 -34.32 -55.59 -80.82 -102.81 -126.69 -139.82 -165.87 -175.15 Maximum Income with PLC -166.50 -146.71 -25.94 85.60 662.93 531.23 538.14 522.67 539.47 462.45 455.27 432.81 355.36 Minimum Income with PLC -166.50 -146.71 -25.94 -176.66 -182.04 -184.40 -217.76 -225.10 -257.19 -279.45 -306.95 -312.76 -338.56
PLC Overpayment 0% 0% 0% 6% 5% 5% 2% 1% 0% 0% 0% 0% 0%
PLC Underpayment 100% 100% 100% 88% 68% 65% 72% 77% 83% 87% 89% 93% 92%
21
Table 3 Annual ARC, PLC, and Net Income Projections for the Missouri Grain Farm (MOCG2300), 2014-2026.
2014 2015 2016 2017 2018 2019 2020 2021 2022 2023 2024 2025 2026
ARC Payments
Average ARC Payment 0.00 65.07 1.28 27.35 19.44 16.61 14.03 16.20 14.76 17.48 19.34 18.56 21.18 Maximum ARC Payment 0.00 65.07 1.28 56.66 61.42 69.00 72.28 71.36 77.45 90.98 82.58 81.35 82.45
Minimum ARC Payment 0.00 65.07 1.28 0.00 0.00 0.00 0.00 0.00 0.00 0.00 0.00 0.00 0.00
P(ARC = Zero) 44% 56% 66% 68% 64% 69% 62% 60% 63% 58% PLC Payments Average PLC Payment 0.00 10.73 40.53 55.54 40.50 29.97 31.50 31.12 33.36 35.58 37.70 37.91 44.41 Maximum PLC Payment 0.00 10.73 40.53 74.72 165.16 170.72 171.14 192.72 185.25 182.67 185.63 208.62 208.62 Minimum PLC Payment 0.00 10.73 40.53 0.00 0.00 0.00 0.00 0.00 0.00 0.00 0.00 0.00 0.00 P(PLC = Zero) 0% 38% 54% 45% 49% 49% 44% 43% 44% 42%
Average Net Income Plus ARC Payments
Average Income with ARC 125.68 -259.66 24.23 -91.48 -66.29 -47.93 -70.39 -86.80 -106.78 -120.06 -133.09 -167.25 -180.10 Maximum Income with ARC 125.68 -259.66 24.23 15.91 489.79 580.32 517.01 532.95 540.88 573.53 569.89 395.47 698.79 Minimum Income with ARC 125.68 -259.66 24.23 -199.93 -229.26 -224.94 -262.07 -267.25 -290.66 -356.66 -346.18 -363.86 -375.82
ARC Overpayment 0% 0% 100% 1% 1% 1% 0% 0% 0% 0% 0% 0% 0%
ARC Underpayment 0% 100% 0% 92% 79% 70% 76% 78% 84% 86% 87% 92% 91%
Average Net Income Plus PLC Payments
Average Income with PLC 125.68 -314.00 63.48 -63.29 -45.24 -34.57 -52.93 -71.88 -88.18 -101.96 -114.73 -147.85 -156.85 Maximum Income with PLC 125.68 -314.00 63.48 40.70 489.79 580.32 517.01 532.95 540.88 573.53 569.89 395.47 698.79 Minimum Income with PLC 125.68 -314.00 63.48 -158.11 -164.40 -181.57 -197.84 -217.72 -233.77 -233.49 -268.46 -312.85 -306.93
PLC Overpayment 0% 0% 100% 9% 6% 3% 3% 1% 0% 0% 0% 0% 0%
PLC Underpayment 0% 100% 0% 83% 73% 66% 72% 76% 84% 86% 86% 91% 91%
($/Acre)
Table 4 Annual ARC, PLC, and Net Income Projections for the Missouri Grain Farm (MOCG4200), 2014-2026.
2014 2015 2016 2017 2018 2019 2020 2021 2022 2023 2024 2025 2026
ARC Payments
Average ARC Payment 0.00 65.07 1.28 27.35 19.44 16.61 14.03 16.20 14.76 17.48 19.34 18.56 21.18 Maximum ARC Payment 0.00 65.07 1.28 56.66 61.42 69.00 72.28 71.36 77.45 90.98 82.58 81.35 82.45
Minimum ARC Payment 0.00 65.07 1.28 0.00 0.00 0.00 0.00 0.00 0.00 0.00 0.00 0.00 0.00
P(ARC = Zero) 0% 44% 56% 66% 68% 64% 69% 62% 60% 63% 58% PLC Payments Average PLC Payment 0.00 10.73 40.53 55.54 40.50 29.97 31.50 31.12 33.36 35.58 37.70 37.91 44.41 Maximum PLC Payment 0.00 10.73 40.53 74.72 165.16 170.72 171.14 192.72 185.25 182.67 185.63 208.62 208.62 Minimum PLC Payment 0.00 10.73 40.53 0.00 0.00 0.00 0.00 0.00 0.00 0.00 0.00 0.00 0.00 P(PLC = Zero) 0% 0% 38% 54% 45% 49% 49% 44% 43% 44% 42%
Average Net Income Plus ARC Payments
Average Income with ARC 204.50 -172.15 111.68 -32.12 -2.48 17.65 -1.08 -15.76 -33.81 -48.23 -59.56 -90.17 -99.96 Maximum Income with ARC 204.50 -172.15 111.68 100.71 564.80 672.94 610.79 628.31 642.01 678.71 676.57 507.10 813.61 Minimum Income with ARC 204.50 -172.15 111.68 -149.83 -156.27 -181.03 -201.58 -211.99 -259.96 -265.31 -273.04 -307.44 -289.39
ARC Overpayment 0% 0% 100% 10% 6% 5% 2% 2% 2% 2% 1% 1% 0%
ARC Underpayment 0% 100% 0% 58% 52% 48% 56% 59% 66% 68% 73% 80% 81%
Average Net Income Plus PLC Payments
Average Income with PLC 204.50 -226.49 150.93 -3.93 18.58 31.01 16.39 -0.84 -15.21 -30.13 -41.20 -70.77 -76.72 Maximum Income with PLC 204.50 -226.49 150.93 128.89 564.80 672.94 610.79 628.31 642.01 678.71 676.57 507.10 813.61 Minimum Income with PLC 204.50 -226.49 150.93 -99.20 -119.89 -118.38 -164.50 -150.43 -181.45 -189.50 -195.36 -205.50 -217.72
PLC Overpayment 0% 0% 100% 41% 25% 16% 12% 8% 7% 7% 4% 2% 2%
PLC Underpayment 0% 100% 0% 39% 34% 38% 46% 53% 60% 64% 70% 79% 80%
22
Table 5 Annual ARC, PLC, and Net Income Projections for the Nebraska Grain Farm (NEG2400), 2014-2026.
2014 2015 2016 2017 2018 2019 2020 2021 2022 2023 2024 2025 2026
ARC Payments
Average ARC Payment 89.69 71.77 91.97 20.15 13.01 9.73 9.01 11.13 13.47 17.92 20.25 19.17 23.79 Maximum ARC Payment 89.69 71.77 91.97 78.53 76.47 78.52 84.54 101.21 102.67 111.96 115.02 113.52 112.06
Minimum ARC Payment 89.69 71.77 91.97 0.00 0.00 0.00 0.00 0.00 0.00 0.00 0.00 0.00 0.00
P(ARC = Zero) 41% 72% 80% 81% 80% 76% 71% 68% 70% 64% PLC Payments Average PLC Payment 0.00 14.15 53.47 73.26 53.42 39.53 41.55 41.05 44.01 46.94 49.74 50.01 58.58 Maximum PLC Payment 0.00 14.15 53.47 98.56 217.85 225.19 225.74 254.21 244.36 240.96 244.86 275.19 275.19 Minimum PLC Payment 0.00 14.15 53.47 0.00 0.00 0.00 0.00 0.00 0.00 0.00 0.00 0.00 0.00 P(PLC = Zero) 0% 38% 54% 45% 49% 49% 44% 43% 44% 42%
Average Net Income Plus ARC Payments
Average Income with ARC 18.97 122.46 79.79 -29.92 35.58 70.62 51.74 33.68 5.57 -22.25 -45.49 -78.54 -95.90 Maximum Income with ARC 18.97 122.46 79.79 79.63 1076.91 817.60 854.43 901.05 836.34 628.60 884.42 1062.49 771.72 Minimum Income with ARC 18.97 122.46 79.79 -129.91 -173.97 -204.93 -203.64 -298.04 -273.93 -339.00 -322.73 -347.31 -409.28
ARC Overpayment 100% 100% 100% 11% 2% 1% 1% 0% 1% 1% 0% 0% 0%
ARC Underpayment 0% 0% 0% 53% 44% 35% 45% 48% 52% 58% 64% 72% 72%
Average Net Income Plus PLC Payments
Average Income with PLC -70.72 64.84 41.29 23.18 75.98 100.42 84.27 63.59 36.11 6.76 -16.01 -47.61 -61.07 Maximum Income with PLC -70.72 64.84 41.29 145.44 1076.91 817.60 854.43 901.05 836.34 628.60 884.42 1062.49 771.72 Minimum Income with PLC -70.72 64.84 41.29 -55.08 -71.64 -82.49 -104.69 -122.52 -158.32 -185.77 -203.29 -231.66 -263.07
PLC Overpayment 0% 100% 100% 73% 41% 24% 21% 11% 7% 4% 0% 1% 0%
PLC Underpayment 100% 0% 0% 17% 12% 15% 26% 33% 45% 53% 62% 70% 72%
($/Acre)
Table 6 Annual ARC, PLC, and Net Income Projections for the Nebraska Grain Farm (NEG4300), 2014-2026.
2014 2015 2016 2017 2018 2019 2020 2021 2022 2023 2024 2025 2026
ARC Payments
Average ARC Payment 89.69 71.77 91.97 20.15 13.01 9.73 9.01 11.13 13.47 17.92 20.25 19.17 23.79 Maximum ARC Payment 89.69 71.77 91.97 78.53 76.47 78.52 84.54 101.21 102.67 111.96 115.02 113.52 112.06
Minimum ARC Payment 89.69 71.77 91.97 0.00 0.00 0.00 0.00 0.00 0.00 0.00 0.00 0.00 0.00
P(ARC = Zero) 41% 72% 80% 81% 80% 76% 71% 68% 70% 64% PLC Payments Average PLC Payment 0.00 13.23 50.00 68.50 49.95 36.97 38.85 38.39 41.15 43.89 46.51 46.76 54.78 Maximum PLC Payment 0.00 13.23 50.00 92.17 203.72 210.58 211.10 237.72 228.51 225.33 228.97 257.34 257.34 Minimum PLC Payment 0.00 13.23 50.00 0.00 0.00 0.00 0.00 0.00 0.00 0.00 0.00 0.00 0.00 P(PLC = Zero) 0% 38% 54% 45% 49% 49% 44% 43% 44% 42%
Average Net Income Plus ARC Payments
Average Income with ARC -266.77 -125.26 -171.26 -289.93 -231.64 -207.06 -237.94 -268.30 -309.18 -350.28 -386.79 -432.72 -463.25 Maximum Income with ARC -266.77 -125.26 -171.26 -175.69 804.57 534.51 565.07 595.19 521.18 298.51 537.46 701.44 397.62 Minimum Income with ARC -266.77 -125.26 -171.26 -383.73 -434.76 -477.86 -490.15 -604.86 -594.41 -659.54 -669.34 -708.39 -782.00
ARC Overpayment 0% 0% 0% 0% 0% 0% 0% 0% 0% 0% 0% 0% 0%
ARC Underpayment 100% 100% 100% 100% 91% 86% 87% 90% 92% 95% 96% 97% 98%
Average Net Income Plus PLC Payments
Average Income with PLC -356.46 -183.80 -213.24 -241.57 -194.70 -179.83 -208.10 -241.05 -281.50 -324.30 -360.53 -405.03 -432.23 Maximum Income with PLC -356.46 -183.80 -213.24 -115.45 804.57 534.51 565.07 595.19 521.18 298.51 537.46 701.44 397.62 Minimum Income with PLC -356.46 -183.80 -213.24 -314.54 -342.46 -360.51 -396.07 -445.13 -475.89 -521.27 -549.44 -589.42 -643.18
PLC Overpayment 0% 0% 0% 0% 0% 0% 0% 0% 0% 0% 0% 0% 0%
PLC Underpayment 100% 100% 100% 100% 91% 86% 87% 90% 92% 95% 96% 97% 98%
23
Table 7 Annual ARC, PLC, and Net Income Projections for the Indiana Grain Farm (ING1000), 2014-2026.
2014 2015 2016 2017 2018 2019 2020 2021 2022 2023 2024 2025 2026
ARC Payments
Average ARC Payment 0.00 76.71 67.63 41.58 26.53 18.82 15.84 17.88 18.26 21.19 22.10 22.67 24.37 Maximum ARC Payment 0.00 76.71 67.63 66.02 65.61 66.89 73.35 72.32 79.99 80.16 85.01 85.01 85.96
Minimum ARC Payment 0.00 76.71 67.63 0.00 0.00 0.00 0.00 0.00 0.00 0.00 0.00 0.00 0.00
P(ARC = Zero) 28% 49% 62% 67% 64% 64% 59% 57% 56% 54% PLC Payments Average PLC Payment 0.00 12.08 45.63 62.53 45.59 33.74 35.46 35.04 37.56 40.06 42.45 42.68 50.00 Maximum PLC Payment 0.00 12.08 45.63 84.12 185.94 192.20 192.68 216.97 208.57 205.66 208.99 234.88 234.88 Minimum PLC Payment 0.00 12.08 45.63 0.00 0.00 0.00 0.00 0.00 0.00 0.00 0.00 0.00 0.00 P(PLC = Zero) 0% 38% 54% 45% 49% 49% 44% 43% 44% 42%
Average Net Income Plus ARC Payments
Average Income with ARC -252.72 -143.08 -73.05 -119.37 -84.67 -70.07 -97.84 -108.33 -130.43 -152.18 -176.52 -205.07 -215.86 Maximum Income with ARC -252.72 -143.08 -73.05 48.24 779.71 596.83 446.06 480.53 672.85 300.23 471.76 314.38 575.27 Minimum Income with ARC -252.72 -143.08 -73.05 -231.90 -257.23 -293.82 -301.35 -314.97 -362.47 -366.18 -400.02 -410.20 -427.04
ARC Overpayment 0% 0% 0% 1% 2% 1% 1% 0% 1% 0% 0% 0% 0%
ARC Underpayment 100% 100% 100% 97% 81% 74% 78% 81% 86% 89% 90% 93% 94%
Average Net Income Plus PLC Payments
Average Income with PLC -252.72 -207.71 -95.04 -98.42 -65.61 -55.16 -78.22 -91.18 -111.13 -133.30 -156.17 -185.01 -190.22 Maximum Income with PLC -252.72 -207.71 -95.04 49.51 779.71 596.83 446.06 480.53 672.85 300.23 471.76 314.38 575.27 Minimum Income with PLC -252.72 -207.71 -95.04 -193.34 -206.99 -217.37 -246.82 -258.20 -268.16 -289.07 -311.87 -338.96 -344.30
PLC Overpayment 0% 0% 0% 1% 2% 1% 1% 0% 0% 0% 0% 0% 0%
PLC Underpayment 100% 100% 100% 96% 79% 73% 77% 80% 86% 89% 90% 93% 94%
($/Acre)
Table 8 Annual ARC, PLC, and Net Income Projections for the Indiana Grain Farm (ING2200), 2014-2026.
2014 2015 2016 2017 2018 2019 2020 2021 2022 2023 2024 2025 2026
ARC Payments
Average ARC Payment 0.00 76.71 67.63 41.58 26.53 18.82 15.84 17.88 18.26 21.19 22.10 22.67 24.37 Maximum ARC Payment 0.00 76.71 67.63 66.02 65.61 66.89 73.35 72.32 79.99 80.16 85.01 85.01 85.96
Minimum ARC Payment 0.00 76.71 67.63 0.00 0.00 0.00 0.00 0.00 0.00 0.00 0.00 0.00 0.00
P(ARC = Zero) 28% 49% 62% 67% 64% 64% 59% 57% 56% 54% PLC Payments Average PLC Payment 0.00 10.95 41.38 56.70 41.35 30.60 32.16 31.77 34.06 36.33 38.50 38.71 45.34 Maximum PLC Payment 0.00 10.95 41.38 76.29 168.63 174.31 174.74 196.77 189.15 186.52 189.53 213.01 213.01 Minimum PLC Payment 0.00 10.95 41.38 0.00 0.00 0.00 0.00 0.00 0.00 0.00 0.00 0.00 0.00 P(PLC = Zero) 0% 38% 54% 45% 49% 49% 44% 43% 44% 42%
Average Net Income Plus ARC Payments
Average Income with ARC -328.74 -206.85 -107.81 -162.44 -129.06 -116.07 -145.47 -160.78 -189.33 -214.19 -241.19 -270.82 -287.54 Maximum Income with ARC -328.74 -206.85 -107.81 0.04 759.10 573.53 419.69 434.97 639.30 260.20 422.85 238.86 527.52 Minimum Income with ARC -328.74 -206.85 -107.81 -282.01 -342.64 -327.56 -353.28 -393.79 -434.92 -425.90 -490.04 -504.29 -498.84
ARC Overpayment 0% 0% 0% 0% 0% 0% 0% 0% 0% 0% 0% 0% 0%
ARC Underpayment 100% 100% 100% 100% 87% 82% 85% 86% 91% 94% 94% 96% 96%
Average Net Income Plus PLC Payments
Average Income with PLC -328.74 -272.60 -134.06 -147.31 -114.24 -104.30 -129.15 -146.89 -173.53 -199.05 -224.79 -254.73 -266.56 Maximum Income with PLC -328.74 -272.60 -134.06 -4.95 759.10 573.53 419.69 434.97 639.30 260.20 422.85 238.86 527.52 Minimum Income with PLC -328.74 -272.60 -134.06 -261.05 -271.06 -284.34 -308.97 -329.66 -351.63 -375.04 -408.24 -418.64 -438.27
PLC Overpayment 0% 0% 0% 0% 0% 0% 0% 0% 0% 0% 0% 0% 0%
PLC Underpayment 100% 100% 100% 100% 87% 82% 85% 87% 91% 94% 94% 96% 96%
24
Table 9 Annual ARC, PLC, and Net Income Projections for the Texas Grain Farm (TXWG1600), 2014-2026.
2014 2015 2016 2017 2018 2019 2020 2021 2022 2023 2024 2025 2026
ARC Payments
Average ARC Payment 0.00 44.97 37.36 13.80 7.39 5.93 5.06 6.83 9.18 12.17 12.02 12.29 12.82 Maximum ARC Payment 0.00 44.97 37.36 30.84 30.71 35.39 37.97 41.11 44.72 47.85 51.89 54.30 51.21
Minimum ARC Payment 0.00 44.97 37.36 0.00 0.00 0.00 0.00 0.00 0.00 0.00 0.00 0.00 0.00
P(ARC = Zero) 52% 69% 74% 77% 74% 67% 61% 60% 61% 59% PLC Payments Average PLC Payment 0.00 6.28 23.73 32.51 23.71 17.54 18.44 18.22 19.53 20.83 22.07 22.19 26.00 Maximum PLC Payment 0.00 6.28 23.73 43.74 96.68 99.94 100.18 112.81 108.45 106.93 108.66 122.12 122.12 Minimum PLC Payment 0.00 6.28 23.73 0.00 0.00 0.00 0.00 0.00 0.00 0.00 0.00 0.00 0.00 P(PLC = Zero) 0% 38% 54% 45% 49% 49% 44% 43% 44% 42%
Average Net Income Plus ARC Payments
Average Income with ARC 28.27 -25.42 -79.39 -59.08 -28.38 -10.46 -25.33 -47.02 -58.77 -78.05 -96.90 -135.43 -152.42 Maximum Income with ARC 28.27 -25.42 -79.39 90.89 506.25 616.96 630.47 600.92 669.38 451.76 950.89 488.77 636.11 Minimum Income with ARC 28.27 -25.42 -79.39 -141.74 -196.48 -230.53 -221.89 -280.64 -322.57 -300.49 -363.23 -545.23 -544.70
ARC Overpayment 0% 0% 0% 2% 1% 2% 1% 2% 4% 4% 3% 1% 2%
ARC Underpayment 0% 100% 100% 77% 60% 53% 63% 65% 68% 73% 77% 81% 83%
Average Net Income Plus PLC Payments
Average Income with PLC 28.27 -64.11 -93.02 -40.36 -12.07 1.14 -11.95 -35.64 -48.42 -69.39 -86.85 -125.41 -139.23 Maximum Income with PLC 28.27 -64.11 -93.02 106.23 506.25 616.96 630.47 600.92 669.38 451.76 950.89 488.77 636.11 Minimum Income with PLC 28.27 -64.11 -93.02 -123.15 -133.26 -145.50 -159.00 -199.76 -235.78 -232.63 -297.31 -400.21 -440.01
PLC Overpayment 0% 0% 0% 16% 10% 5% 5% 3% 4% 2% 0% 1% 0%
PLC Underpayment 0% 100% 100% 64% 56% 51% 60% 64% 68% 74% 78% 83% 83%
($/Acre)
Table 10 Annual ARC, PLC, and Net Income Projections for the Texas Grain Farm (TXNP3450), 2014-2026.
2014 2015 2016 2017 2018 2019 2020 2021 2022 2023 2024 2025 2026
ARC Payments
Average ARC Payment 104.74 91.05 92.45 53.69 30.60 23.51 24.30 21.90 22.88 25.69 28.23 27.05 28.62 Maximum ARC Payment 104.74 91.05 92.45 82.36 78.44 79.22 83.83 94.66 98.59 100.66 104.26 99.64 98.34
Minimum ARC Payment 104.74 91.05 92.45 0.00 0.00 0.00 0.00 0.00 0.00 0.00 0.00 0.00 0.00
P(ARC = Zero) 14% 51% 61% 59% 62% 63% 58% 54% 55% 54% PLC Payments Average PLC Payment 0.00 13.54 51.15 70.09 51.11 37.82 39.75 39.27 42.10 44.91 47.58 47.85 56.04 Maximum PLC Payment 0.00 13.54 51.15 94.30 208.43 215.45 215.98 243.22 233.80 230.54 234.27 263.29 263.29 Minimum PLC Payment 0.00 13.54 51.15 0.00 0.00 0.00 0.00 0.00 0.00 0.00 0.00 0.00 0.00 P(PLC = Zero) 0% 38% 54% 45% 49% 49% 44% 43% 44% 42%
Average Net Income Plus ARC Payments
Average Income with ARC 304.96 70.00 154.61 101.83 118.98 126.49 104.47 86.62 70.41 40.58 15.88 -4.91 -14.44 Maximum Income with ARC 304.96 70.00 154.61 339.01 996.23 642.83 741.00 748.23 626.89 701.81 603.13 788.22 478.66 Minimum Income with ARC 304.96 70.00 154.61 -91.95 -103.53 -127.37 -125.73 -167.49 -203.80 -228.41 -199.86 -238.10 -275.21
ARC Overpayment 100% 100% 100% 81% 42% 31% 28% 27% 25% 26% 21% 17% 16%
ARC Underpayment 0% 0% 0% 4% 7% 8% 16% 17% 22% 27% 39% 48% 50%
Average Net Income Plus PLC Payments
Average Income with PLC 200.22 -7.51 113.32 118.22 139.49 140.80 119.92 104.00 89.64 59.81 35.24 15.95 13.00 Maximum Income with PLC 200.22 -7.51 113.32 330.97 996.23 642.83 741.00 748.23 626.89 701.81 603.13 788.22 478.66 Minimum Income with PLC 200.22 -7.51 113.32 -12.11 -26.28 -46.30 -62.94 -74.32 -101.09 -112.58 -129.63 -138.84 -166.66
PLC Overpayment 0% 0% 100% 98% 61% 41% 42% 37% 35% 31% 26% 24% 24%
PLC Underpayment 0% 0% 0% 0% 0% 1% 5% 9% 12% 20% 35% 41% 39%
25
Table 11 Annual ARC, PLC, and Net Income Projections for the Texas Grain Farm (TXNP10640), 2014-2026.
2014 2015 2016 2017 2018 2019 2020 2021 2022 2023 2024 2025 2026
ARC Payments
Average ARC Payment 104.74 91.05 92.45 53.69 30.60 23.51 24.30 21.90 22.88 25.69 28.23 27.05 28.62 Maximum ARC Payment 104.74 91.05 92.45 82.36 78.44 79.22 83.83 94.66 98.59 100.66 104.26 99.64 98.34
Minimum ARC Payment 104.74 91.05 92.45 0.00 0.00 0.00 0.00 0.00 0.00 0.00 0.00 0.00 0.00
P(ARC = Zero) 14% 51% 61% 59% 62% 63% 58% 54% 55% 54% PLC Payments Average PLC Payment 0.00 16.45 62.13 85.14 62.08 45.94 48.29 47.70 51.14 54.55 57.80 58.12 68.08 Maximum PLC Payment 0.00 16.45 62.14 114.54 253.18 261.71 262.35 295.43 283.99 280.04 284.56 319.81 319.81 Minimum PLC Payment 0.00 16.45 62.14 0.00 0.00 0.00 0.00 0.00 0.00 0.00 0.00 0.00 0.00 P(PLC = Zero) 0% 38% 54% 45% 49% 49% 44% 43% 44% 42%
Average Net Income Plus ARC Payments
Average Income with ARC 110.65 -28.87 43.80 -49.71 -19.55 -3.21 -20.46 -44.98 -64.03 -93.21 -113.80 -133.90 -146.68 Maximum Income with ARC 110.65 -28.87 43.80 207.70 889.88 536.14 635.12 646.14 522.63 598.48 506.28 686.46 342.38 Minimum Income with ARC 110.65 -28.87 43.80 -174.13 -244.44 -247.94 -267.31 -290.06 -335.33 -321.26 -354.67 -352.86 -396.45
ARC Overpayment 100% 0% 100% 20% 12% 8% 6% 4% 4% 4% 2% 1% 0%
ARC Underpayment 0% 100% 0% 70% 53% 50% 58% 65% 71% 77% 82% 88% 88%
Average Net Income Plus PLC Payments
Average Income with PLC 5.91 -103.47 13.48 -18.27 11.92 19.22 3.52 -19.17 -35.76 -64.34 -84.23 -102.77 -107.21 Maximum Income with PLC 5.91 -103.47 13.48 202.87 889.88 536.14 635.12 646.14 522.63 598.48 506.28 686.46 342.38 Minimum Income with PLC 5.91 -103.47 13.48 -125.59 -141.53 -132.09 -158.71 -177.49 -224.27 -199.82 -225.68 -254.17 -256.34
PLC Overpayment 0% 0% 100% 27% 19% 10% 8% 6% 7% 4% 3% 4% 3%
PLC Underpayment 0% 100% 0% 52% 41% 44% 55% 59% 65% 74% 80% 84% 85%
($/Acre)
Table 12 Annual ARC, PLC, and Net Income Projections for the Illinois Grain Farm (IL Northern), 2014-2026.
2014 2015 2016 2017 2018 2019 2020 2021 2022 2023 2024 2025 2026
ARC Payments
Average ARC Payment 59.00 93.10 56.81 29.25 19.09 16.56 16.12 19.35 19.74 22.46 24.30 25.23 26.92 Maximum ARC Payment 59.00 93.10 56.81 74.19 72.77 75.02 80.22 90.11 94.06 100.77 94.95 101.79 103.85
Minimum ARC Payment 59.00 93.10 56.81 0.00 0.00 0.00 0.00 0.00 0.00 0.00 0.00 0.00 0.00
P(ARC = Zero) 37% 63% 70% 69% 65% 66% 63% 59% 61% 57% PLC Payments Average PLC Payment 0.00 12.20 46.08 63.14 46.04 34.07 35.81 35.38 37.93 40.46 42.87 43.10 50.49 Maximum PLC Payment 0.00 12.20 46.08 84.95 187.77 194.09 194.57 219.10 210.62 207.68 211.04 237.18 237.18 Minimum PLC Payment 0.00 12.20 46.08 0.00 0.00 0.00 0.00 0.00 0.00 0.00 0.00 0.00 0.00 P(PLC = Zero) 0% 38% 54% 45% 49% 49% 44% 43% 44% 42%
Average Net Income Plus ARC Payments
Average Income with ARC 47.95 28.58 -14.11 -4.36 27.49 42.48 22.99 7.09 -10.35 -20.18 -46.39 -63.64 -77.88 Maximum Income with ARC 47.95 28.58 -14.11 193.36 833.68 662.42 664.93 684.73 487.00 368.90 510.01 691.23 348.22 Minimum Income with ARC 47.95 28.58 -14.11 -117.79 -135.97 -180.83 -191.93 -234.85 -214.35 -259.37 -228.76 -279.33 -286.97
ARC Overpayment 100% 100% 0% 35% 20% 14% 13% 11% 9% 15% 8% 8% 5%
ARC Underpayment 0% 0% 0% 51% 30% 31% 42% 45% 51% 52% 63% 71% 74%
Average Net Income Plus PLC Payments
Average Income with PLC -11.05 -52.32 -24.84 29.53 54.44 59.98 42.67 23.13 7.84 -2.19 -27.83 -45.70 -54.29 Maximum Income with PLC -11.05 -52.32 -24.84 204.18 833.68 662.42 664.93 684.73 487.00 368.90 510.01 691.23 348.22 Minimum Income with PLC -11.05 -52.32 -24.84 -70.17 -74.81 -89.80 -123.78 -139.82 -128.71 -155.98 -164.13 -181.62 -198.47
PLC Overpayment 0% 0% 0% 68% 42% 23% 20% 12% 14% 15% 10% 9% 7%
PLC Underpayment 0% 100% 0% 14% 10% 18% 32% 43% 46% 49% 58% 67% 72%
26
Table 13 Annual ARC, PLC, and Net Income Projections for the Illinois Grain Farm (IL Central High), 2014-2026.
2014 2015 2016 2017 2018 2019 2020 2021 2022 2023 2024 2025 2026
ARC Payments
Average ARC Payment 0.00 68.66 21.37 60.11 32.89 24.06 20.95 20.99 19.66 23.53 23.57 24.58 24.88 Maximum ARC Payment 0.00 68.66 21.37 79.86 78.32 79.83 81.63 87.71 90.15 101.45 96.64 105.82 99.22
Minimum ARC Payment 0.00 68.66 21.37 0.00 0.00 0.00 0.00 0.00 0.00 0.00 0.00 0.00 0.00
P(ARC = Zero) 9% 47% 58% 63% 63% 65% 62% 60% 60% 57% PLC Payments Average PLC Payment 0.00 12.20 46.08 63.14 46.04 34.07 35.81 35.38 37.93 40.46 42.87 43.10 50.49 Maximum PLC Payment 0.00 12.20 46.08 84.95 187.77 194.09 194.57 219.10 210.62 207.68 211.04 237.18 237.18 Minimum PLC Payment 0.00 12.20 46.08 0.00 0.00 0.00 0.00 0.00 0.00 0.00 0.00 0.00 0.00 P(PLC = Zero) 0% 38% 54% 45% 49% 49% 44% 43% 44% 42%
Average Net Income Plus ARC Payments
Average Income with ARC -46.59 28.46 -28.20 30.82 59.59 76.65 57.45 48.96 15.70 1.06 -31.28 -57.38 -74.36 Maximum Income with ARC -46.59 28.46 -28.20 216.86 930.14 717.97 734.33 778.58 636.34 568.93 687.69 805.87 532.64 Minimum Income with ARC -46.59 28.46 -28.20 -96.90 -157.46 -171.97 -204.65 -277.56 -270.32 -272.31 -341.09 -324.50 -365.10
ARC Overpayment 0% 100% 0% 69% 29% 22% 17% 15% 11% 13% 9% 8% 5%
ARC Underpayment 100% 0% 100% 13% 21% 19% 33% 33% 45% 46% 60% 66% 69%
Average Net Income Plus PLC Payments
Average Income with PLC -46.59 -28.00 -3.49 33.85 72.74 86.65 72.31 63.35 33.97 17.99 -11.99 -38.77 -48.72 Maximum Income with PLC -46.59 -28.00 -3.49 194.26 930.14 717.97 734.33 778.58 636.34 568.93 687.69 805.87 532.64 Minimum Income with PLC -46.59 -28.00 -3.49 -73.73 -86.29 -96.22 -120.28 -119.26 -153.89 -161.46 -195.30 -198.69 -238.14
PLC Overpayment 0% 0% 0% 80% 43% 27% 24% 18% 11% 14% 10% 6% 8%
PLC Underpayment 100% 100% 0% 6% 7% 13% 21% 25% 39% 42% 56% 66% 66%
($/Acre)
Table 14 Annual ARC, PLC, and Net Income Projections for the Illinois Grain Farm (IL Central Low), 2014-2026.
2014 2015 2016 2017 2018 2019 2020 2021 2022 2023 2024 2025 2026
ARC Payments
Average ARC Payment 0.00 86.76 0.00 52.30 27.37 19.77 17.25 18.41 17.38 21.24 22.72 21.67 24.83 Maximum ARC Payment 0.00 86.76 0.00 72.35 72.15 75.16 73.61 86.63 84.57 86.67 90.34 87.26 87.29
Minimum ARC Payment 0.00 86.76 0.00 0.00 0.00 0.00 0.00 0.00 0.00 0.00 0.00 0.00 0.00
P(ARC = Zero) 11% 50% 63% 66% 66% 64% 59% 56% 59% 54% PLC Payments Average PLC Payment 0.00 12.20 46.08 63.14 46.04 34.07 35.81 35.38 37.93 40.46 42.87 43.10 50.49 Maximum PLC Payment 0.00 12.20 46.08 84.95 187.77 194.09 194.57 219.10 210.62 207.68 211.04 237.18 237.18 Minimum PLC Payment 0.00 12.20 46.08 0.00 0.00 0.00 0.00 0.00 0.00 0.00 0.00 0.00 0.00 P(PLC = Zero) 0% 38% 54% 45% 49% 49% 44% 43% 44% 42%
Average Net Income Plus ARC Payments
Average Income with ARC -56.07 42.23 -50.70 32.37 57.87 65.32 46.79 26.54 11.40 4.25 -12.24 -33.68 -40.55 Maximum Income with ARC -56.07 42.23 -50.70 209.08 697.10 552.87 674.34 600.55 528.70 380.36 485.56 593.92 363.36 Minimum Income with ARC -56.07 42.23 -50.70 -75.15 -87.43 -122.26 -145.60 -153.92 -196.93 -180.22 -229.35 -209.70 -219.72
ARC Overpayment 0% 100% 0% 61% 34% 23% 19% 17% 14% 19% 15% 13% 13%
ARC Underpayment 100% 0% 100% 13% 16% 16% 27% 33% 40% 41% 51% 61% 57%
Average Net Income Plus PLC Payments
Average Income with PLC -56.07 -32.33 -4.62 43.21 76.54 79.63 65.35 43.51 31.94 23.46 7.90 -12.19 -14.89 Maximum Income with PLC -56.07 -32.33 -4.62 207.46 697.10 552.87 674.34 600.55 528.70 380.36 485.56 593.92 363.36 Minimum Income with PLC -56.07 -32.33 -4.62 -44.37 -39.91 -43.07 -77.42 -85.04 -84.06 -107.57 -106.26 -121.63 -140.98
PLC Overpayment 0% 0% 0% 81% 51% 34% 31% 23% 20% 24% 20% 17% 18%
PLC Underpayment 100% 100% 0% 1% 1% 4% 11% 23% 28% 33% 42% 54% 50%
27
The pattern seen in the ARC and PLC payments shows the front-loaded nature of the ARC payment whereas the PLC payment provides a steadier safety net. For most farms, PLC payments begin to outperform ARC payments in 2017. This can be explained by stagnant low prices seen in 2014 and going forward. The consistent low prices year after year no longer trigger an ARC payment due to ARC being an Olympic moving average formula that no longer incorporates the high price environment seen pre 2014.
The annual probability that the ARC or PLC payment will be zero is also included in Tables 1-15. As indicated in the Tables, ARC payments have a much higher probability of being zero after 2016. ARC payments generally had a higher probability of being positive from 2014 to 2016, but drastically taper off after 2016. Due to the rapidly declining price environment for corn in the years after 2012, shown in Figure 2, the probability of triggering ARC payments was nearly 100 percent whereas in the years following 2016, in a sustained low price environment for corn, payments no longer have a high probability of triggering. PLC on the other hand is
dependent on the price of corn dropping below the $3.70 reference price and has a high
Table 15 Annual ARC, PLC, and Net Income Projections for the Illinois Grain Farm (IL Southern), 2014-2026.
2014 2015 2016 2017 2018 2019 2020 2021 2022 2023 2024 2025 2026
ARC Payments
Average ARC Payment 0.00 50.07 70.41 33.63 22.16 14.29 13.19 12.98 15.20 18.46 18.88 20.39 21.62 Maximum ARC Payment 0.00 50.07 70.41 60.35 61.05 61.23 61.22 72.56 76.64 81.97 81.68 81.94 82.25
Minimum ARC Payment 0.00 50.07 70.41 0.00 0.00 0.00 0.00 0.00 0.00 0.00 0.00 0.00 0.00
P(ARC = Zero) 24% 52% 68% 69% 71% 66% 62% 60% 58% 56% PLC Payments Average PLC Payment 0.00 12.20 46.08 63.14 46.04 34.07 35.81 35.38 37.93 40.46 42.87 43.10 50.49 Maximum PLC Payment 0.00 12.20 46.08 84.95 187.77 194.09 194.57 219.10 210.62 207.68 211.04 237.18 237.18 Minimum PLC Payment 0.00 12.20 46.08 0.00 0.00 0.00 0.00 0.00 0.00 0.00 0.00 0.00 0.00 P(PLC = Zero) 0% 38% 54% 45% 49% 49% 44% 43% 44% 42%
Average Net Income Plus ARC Payments
Average Income with ARC -209.28 -164.90 -150.41 -194.65 -160.04 -146.34 -182.08 -210.35 -245.39 -273.33 -325.81 -358.24 -389.06 Maximum Income with ARC -209.28 -164.90 -150.41 -37.26 704.86 688.02 733.93 615.52 630.46 763.27 783.81 574.40 528.63 Minimum Income with ARC -209.28 -164.90 -150.41 -324.64 -370.21 -407.65 -501.28 -548.01 -523.79 -610.08 -639.70 -693.02 -825.17
ARC Overpayment 0% 0% 0% 0% 1% 0% 0% 0% 0% 0% 0% 0% 0%
ARC Underpayment 100% 100% 100% 100% 88% 83% 86% 86% 91% 93% 95% 96% 96%
Average Net Income Plus PLC Payments
Average Income with PLC -209.28 -202.77 -174.73 -165.13 -136.16 -126.55 -159.45 -187.95 -222.66 -251.34 -301.83 -335.47 -360.16 Maximum Income with PLC -209.28 -202.77 -174.73 -33.72 704.86 688.02 733.93 615.52 630.46 763.27 783.81 574.40 528.63 Minimum Income with PLC -209.28 -202.77 -174.73 -258.40 -280.40 -302.00 -330.92 -383.99 -404.16 -467.69 -492.79 -552.31 -645.23
PLC Overpayment 0% 0% 0% 0% 1% 0% 0% 0% 0% 0% 0% 0% 0%
PLC Underpayment 100% 100% 100% 100% 88% 83% 86% 86% 91% 92% 96% 96% 96%
28
probability of triggering anytime the price is forecasted below that trigger. PLC is a guaranteed safety net whereas ARC is only triggered under particular circumstances, not necessarily coinciding with low prices but rather relative to the previous 5 year Olympic moving average price.
PLC on the other hand does not depend on historical prices to trigger a payment but rather depends on current price falling below the reference price. The reference price for corn is $3.70, and many of the average forecasted prices going forward are near the $3.70 mark. Any time the national average price falls below the $3.70 price a payment is triggered, compared to ARC needing to fall below 86 percent of the historical average income. In a sustained low price environment, the threshold for ARC is not going to be reached.
Figure 3: Historical MYA Corn Price
Another way to see the difference in support offered by ARC and PLC is by using a StopLight chart in Simetar to show if corn producers receive aid when it is required, i.e. when market receipts are less than costs. The following two figures are the StopLight charts for the
$3.00 $3.50 $4.00 $4.50 $5.00 $5.50 $6.00 $6.50 $7.00 $7.50 2008 2009 2010 2011 2012 2013 2014 2015 2016