INNOVATION DIFFUSION AMONG FARMERS IN DEVELOPING COUNTRIES
A Dissertation by
JOHN THOMAS WYNN, II
Submitted to the Office of Graduate and Professional Studies of Texas A&M University
in partial fulfillment of the requirements for the degree of DOCTOR OF PHILOSOPHY
Chair of Committee, Robert Strong Jr. Committee Members, James R. Lindner
Gary E. Briers Eluned Jones Head of Department, Clare A. Gill
December 2017
Major Subject: Agricultural Leadership, Education, and Communications
ii ABSTRACT
Agriculture plays a fundamental role in the global economy. To accomplish the economical and feasible improvement in agricultural production, a more complete understanding of how innovations move through different channels is necessary. Farmers in developing countries have many disadvantages, including barriers to
innovation exchange. Better understanding the diffusion process in developing countries is necessary to improve adoption. The framework utilized by this study is Rogers’ Diffusion Theory. The diffusion process in developing communities is equivalent to that of classical theory but with more emphasis placed on the knowledge, persuasion, and decision components as needs by the adopters. The purpose of this study was to describe the adopter characteristics of agriculturists, the innovation traits that facilitate adoption, and the adoption process itself, and identify the elements and barriers of information transmission in Brazil.
A questionnaire consisting of eight attitudinal constructs and one demographic construct was administered to 344 participants in this study. Each of the constructs had a Cronbach’s Alpha greater than 0.7. Data were analyzed using descriptive and
correlational statistics, including stepwise regression. Respondent demographics showed that 22% of the sample was female and the average age for the respondents was 41 years. Adopter characteristics were identified as educated, more conscious of social status, more able to grasp and use a technology, and likely to be opinion leaders. Innovation characteristics conducive to adoption were innovations that were simple,
iii
easily communicable, socially accepted, and had high levels of utility to the individual. The adoption process was found to be consistent with Rogers’ characterization of agricultural producers. The elements of transmission that contributed to adoption were high levels of observability, compatibility and low complexity. The identified barriers to transmission were high complexity and low compatibility innovations.
Recommendations for practitioners to facilitate adoption were to target opinion leaders, minimize complexity, and increase education. Recommendations for future research included replication of the study in the same population and also in neighboring populations. Future research should explore the impacts of societal factors, increased education, and the ability to quantify innovation traits.
iv DEDICATION
This dissertation is dedicated to my wife and family who are the most important people in my life. My wife, Mary Davis Wynn, has been a constant source of motivation and encouragement. Without her I would not have reached completion. She is the love of my life and I am eternally blessed for her patience and support as I complete this process.
I also dedicate this dissertation to my parents, Dr. John and Myra Wynn. Their constant interest in my education has been boundless and their pressure to help me succeed has been critical in my reaching the apex of my educational career. I am eternally grateful for all of their support and certainty that I could achieve my goals.
v
ACKNOWLEDGEMENTS
To my committee, I express my thanks and gratitude for your patience and guidance in completing this journey.
To Dr. Robert Strong, thank you for your mentorship and for being a wonderful committee chair. Your constant encouragement, feedback, and pressure to help me develop have been instrumental in my success. Your positive attitude and friendship have been an inspiration throughout as well. Thank you for your patience!
To Dr. James Lindner, thank you for challenging me to ever greater heights. Your instruction and collegiality, as well as your down-to-business demeanor when it was time to get work done have been formative.
To Dr. Gary Briers, thank you for always having a willing ear to talk and for the guidance and input that you have given throughout this process.
To Dr. Eluned Jones, thank you for your continued support and interest in my education. It has been a long road, but without your guidance and perseverance, I would most certainly not have made it this far.
A special thanks to Tiago Sarmento Barata and Janice Machado and all of the faculty and staff at the Instuituo Rio Grandense do Arroz (IRGA) in Rio Grande do Sul, Brazil for your help, patience, and guidance in completing this research.
vi
CONTRIBUTORS AND FUNDING SOURCES
This work was supervised by a dissertation committee consisting of Professor Robert L. Strong, Jr. [advisor] and Professor(s) James R. Lindner and Gary E. Briers of the Department of Agricultural Leadership, Education, and Communications, and Professor Eluned Jones of Agricultural Economics.
All work for the dissertation was completed independently by the student. This work was made possible by funding contributions from Dr. John T. Wynn et. al.
vii TABLE OF CONTENTS Page ABSTRACT ...ii DEDICATION ... iv ACKNOWLEDGEMENTS ... v
CONTRIBUTORS AND FUNDING SOURCES ... vi
TABLE OF CONTENTS ...vii
LIST OF TABLES ... ix
CHAPTER I INTRODUCTION ... 1
Problem Statement ... 1
Food Security and Information Exchange ... 2
Information Asymmetries in Developing Countries ... 5
Educational Needs ... 7
Information Diffusion in Developing Markets ... 8
CHAPTER II THEORETICAL FRAMEWORK... 12
Innovations and Adoption Decisions ... 13
Rate of Adoption ... 16
Innovation Characteristics ... 18
Adopter Categories ... 19
CHAPTER III METHODS ... 23
Research Design ... 23
Population and Sample ... 24
Instrumentation ... 25
Validity ... 26
Reliability ... 29
Data Collection ... 30
Data Analysis ... 31
Analysis of Data – Objective One ... 32
Analysis of Data – Objective Two ... 32
Analysis of Data – Objective Three ... 33
viii
CHAPTER IV RESEARCH FINDINGS AND DISCUSSION ... 35
Demographic Profile of Participants ... 35
Research Findings for Objective One ... 38
Research Findings for Objective Two ... 48
Research Findings for Objective Three ... 60
Research Findings for Objective Four ... 64
CHAPTER V SUMMARY, CONCLUSIONS, AND RECOMMENDATIONS ... 67
Problem Statement ... 67
Purpose and Objectives of the Study ... 67
Summary of Methods ... 68
Participant Demographics ... 69
Research Objective One ... 69
Research Objective Two ... 74
Research Objective Three ... 78
Research Objective Four ... 79
Recommendations for Practitioners ... 80
Recommendations for Future Research ... 82
REFERENCES ... 85
APPENDIX A SURVEY INSTRUMENT ... 97
APPENDIX B INFORMED CONSENT ... 103
ix
LIST OF TABLES
Page
Table 1Respondent’s Ages (n=344) ... 36
Table 2 Highest Educational Level of Participants (n=327) ... 37
Table 3Occupations of Respondents (n=325) ... 38
Table 4 Adopter’s Ages (n=41) ... 39
Table 5 Highest Educational Level of Adopters (n=41) ... 40
Table 6 Indicators of Adopters’ Voluntariness (n=41) ... 41
Table 7 Indicators of Adopters’ Perception of Relative Advantage of the Innovation (n=41) ... 42
Table 8 Characteristics of Adopters’ Perception of the Compatibility of Innovations (n=41) ... 43
Table 9 Characteristics of Adopters’ Perception of Image (n=41) ... 44
Table 10 Statements to Indicate Adopters’ Perceptions of Ease of Use of Innovations (n=41) ... 45
Table 11 Statements to Indicate Adopters’ Perception of Result Demonstrability (n=41) ... 46
Table 12 Statements to Indicate Adopters’ Perception of Visibility (n=41) ... 47
Table 13 Characteristics of Adopters’ Perception of Trialability (n=41) ... 48
Table 14 Measures of Innovation Voluntariness (n=334) ... 50
Table 15 Measures of Innovation Relative Advantage (n=334) ... 51
Table 16 Measures of Innovation Compatibility (n=334) ... 53
Table 17 Elements of Perceptions About Innovations’ Effects on Image (n=334) ... 54
x
Table 19Measures of Innovation Result Demonstrability (n=334) ... 57
Table 20 Measures of Innovation Visibility (n=334) ... 58
Table 21 Measures of Innovation Trialabilty (n=334) ... 59
Table 22 Adopter Category Classification ... 61
Table 23 Identified Constructs Relating to Innovation Adoption ... 63
1 CHAPTER I INTRODUCTION
Agriculture plays a fundamental role in the global economy. Population projections indicate that current food supplies are increasingly less adequate to meet demand (Godfray, et al., 2010). As food supply and security become more prominent societal issues, there is a need to better understand how food supply and security can be improved in an economical and feasible manner. Science and technology have been shown to provide a feasible solution to increase food security (Beddington, 2010). Technologies that have been suggested to improve food security are agrotechnologies, and a more transparent exchange of information can facilitate the adoption of
agrotechnologies (Carvalho, 2006). To accomplish the economical and feasible improvement in agricultural production, a more complete understanding of how
agricultural technology and information move through different channels is necessary. Further investigation into the primary drivers of information dissemination as well as the discernment of methods effective in capitalizing on the primary drivers are also crucial for addressing food supply and security problems.
Problem Statement
Globally, agriculture has been shown to be an increasingly smaller component of the world’s economy (Swanson, 2006). However, agriculture worldwide has continued to grow as the world strives to feed a growing population. Developing countries are particularly dependent on agriculture. As an economic component, agriculture is more
2
relied on by developing nations as an economical driver than it is by developed nations, specifically with regard to food security (Fritschel, 2003). The changing environment of global agriculture requires constant improvements in agricultural practices. Population increases, climate change, and policy initiatives all impact developing countries’ need for improved agricultural practices (Pretty, et al., 2010). Agricultural production practices can be improved through technology. Nin, Arndt, and Preckel (2003) found that as agricultural technology adoption increased in developing countries, the
agricultural production increased at a greater rate. As agricultural production increases, wealth in developing countries improves as well. Research by Thirtle, Lin, and Piesse (2003)found that agricultural improvements in developing countries and the resulting increases in GDP had a disproportionately positive effect on wealth distribution. To preserve the integrity of the global economy, protect sustainability of developing
economies, and ensure an adequate and secure supply of food worldwide, it is important to more completely understand the role of information in agriculture.
Food Security and Information Exchange
Food security and agricultural productivity in developing countries have a strong potential for growth but need a conduit through which information and technology can be disseminated. Agricultural industries in developing countries present a unique potential to serve as an engine for economic growth (Byerlee, de Janvry, & Sadoulet, 2009). Rapid transfer of information can help fuel the economic potential of agricultural industries. More effective information distribution can be achieved in developing
3
Information asymmetry has been identified as an element in the disparity between increased technological advances and minimal productivity growth (Aker, 2011). Greater levels of poverty and wealth disparity exist in areas with wide information asymmetries. Wealth redistribution and production efficiencies have been identified in the literature as resulting from reduced informational asymmetries (Svensson &
Yanagizawa, 2009). Both production efficiencies and wealth distribution are directly impacted by the communication of market pricing (Sulaiman, Hall, Kalaivani, Dorai, & Reddy, 2012). Market price information is, therefore, an effective vehicle to achieve greater efficiency and economic benefit. Technology transfer within developing economies has also been shown to be effective in achieving improved production and wealth distribution efficiency.
Information exchange is one way to achieve greater production and farmer welfare improvements. Technology has been defined as a form of information and has been shown to be effective in improving productivity and wealth (Mendola, 2007). Improvements in agricultural yields are a primary factor in improving agricultural productivity. Transfers of agricultural yield technology have direct implications for productivity improvement in developing countries (Minten & Barrett, 2008). The most promising venue for agricultural technology development is through university research. University research has created many new technologies for farmers, but there is usually a disparity between the amount and rate of adoption by farmers (Abdulai & Huffman, 2005). The greater rates of non-adoption are more prevalent in developing countries than in developed countries. Lee (2005) found that information disparities in developing
4
countries are a large contributor to technology non-adoption. Overcoming information barriers pertaining to technology transfer represents a key hurdle in improving the wellbeing of farmers in developing countries
Price information is a key component of information that impacts the productivity and economic welfare of farmers. Price discovery mechanisms differ widely between developed and developing economies. Developed economies often utilize a form of free market to achieve effective price discovery in the form of futures markets (Figuerola-Ferretti & Gonzalo, 2010). Futures markets represent a means of information communication with minimal information asymmetry. The efficiencies presented by a futures market price discovery process improve both the distribution of economic wealth and the efficiency of production. Efficient pricing achieved by the futures marketing process is a result of improved communication, low barriers to communication, and the accessibility of information (Oliven & Rietz, 2004). Price risk associated with information asymmetries is a barrier in the communication process that influences the decision to adopt an innovation. Economic profits can be expressed in terms of time, energy, or money (Green, Mas-Colell, & Whinston, 1995). Positive perceived economic profits have been shown to be significant factors that enhance the adoption process (Koundouri, Nauges, & Tzouvelekas, 2006). Ensuring positive perceived economic profits through increased information symmetry is a necessary part of implementing effective technology transfer and improving economic benefits and productivity for farmers.
5
Information Asymmetries in Developing Countries
Developing countries have been shown to exhibit wide information asymmetries with regard to price. Developing countries are often characterized by significant barriers to communication. Barriers to communication result from limited educational
availability, low degrees of technology adoption, and local market collusion (Moriba, Kandeh, & Edwards, 2011). Communication barriers have a substantial impact on technology communication. High communication costs within a system have been shown to exhibit lower levels of productivity and a wider disparity of wealth (Bardhan & Mookherjee, 2005). Improved communication of technology can reduce waste and improve production efficiency. Effective governance, accountability and regulatory quality are two elements that have been identified as areas that can significantly impact information communication technology in developing countries (Meso, Datta, & Mbarika, 2006). Increasing government reliability and regulatory quality through accountability can reduce communication costs and improve the adoption of new technologies. Increasing accountability within a communication system can also improve the flow of market information in developing countries.
In the field of international development, the Association of International Agricultural and Extension Education (AIAEE) has published extensive research regarding technology transfer from around the world. One vehicle used by members of AIAEE to evaluate technology transfer is the integrated pest management (IPM)
programs in developing countries. Research conducted in farmer field schools in Kenya identified the perceptions of rural farmers to IPM technology (Bunyatta, Mureithi,
6
Onyango, & Ngesa, 2006). Farmer field schools as a mode of communication was further developed by Erbaugh, Donnermeyer, Amujal, and Kidoido (2010) via their research concerning farmer knowledge in Uganda. Technology transfer as a policy initiative was recommended by Tripp, Wijeratne, and Piyadada (2005) as a mode of ensuring that information dissemination and sustainable production practices were adopted by a broader audience of farmers. Vocational education and training have been identified as a vehicle to communicate technology transfer to farmers (Erbaugh,
Kibwika, & Donnermeyer, 2007). Effective training and educational practices should be routinely evaluated to maintain a better understanding of farmers’ education and training needs.
Information exchange among farmers in developed countries is typically consistent and transparent. Developed economies utilize both formal and informal institutions to transfer information and technologies. Institutions utilized by developed countries to transfer information and technology are normally trusted by participants for accuracy and fairness in exchanging information (Gerxhani, 2004). Trusted information exchange is important for innovations to permeate societies. Farmers in the United States rely on large scale technological innovations as the foundation of commercial farm management (McBratney, Whelan, Ancev, & Bouma, 2005). Technologies such as precision agriculture and effective futures markets have minimized information asymmetries. Ates and Wang (2005) found that futures markets in the US are effective at determining commodity market price through information transparency.
7
productive agricultural sector in developed countries. Farmers controlling for price and production risks through trusted and transparent information exchange has been shown to lead to more efficient agricultural production (MacDonald, et al., 2004). Food security in developed countries is thus less critical than in developing countries.
Developing countries experience information exchange in different ways than their developed counterparts. Developing countries often exhibit distinct information gaps at the farm level. Information gaps are most pronounced in countries where new technologies resulting from intellectual property rights are poorly enforced (Hoekman, Maskus, & Saggi, 2005). Farmers are either not aware of new information and
technologies or are not able to effectively implement new information and technologies feasibly. Knowledge of informational and technological innovation has been shown to be hindered by low levels of awareness in developing countries (van der Gaast, Begg, & Flamos, 2009). Low awareness has been specifically linked to low levels of education. Education deficiencies have been identified as a primary cause of non-adoption of technologies and as barriers to information flow. Farmer awareness limitations have been found to be more strongly linked to educational deficiencies than to gender or other demographic components (Dutta, 2009). Improving innovation exchange is crucial at the farm level to accelerate economic development and enhance food security.
Educational Needs
Education is a key element in improving information exchange in developing countries. Educational improvements have been shown to influence organizational behavior specifically regarding the acceptance of new technologies (Baker, Al-Gahtani,
8
& Hubona, 2007). Organizational behavior influencing technology adoption can be influenced by outreach programs designed to communicate the technology or
information to the needs of the communities. One avenue to improve farmer education with respect to technology and information is through farmer field schools. Farmer field schools have been found to be effective in improving farmers’ education and perception of new technologies in a context that is consistent with their societal norms (van den Berg & Jiggins, 2007). Information transparency can also be achieved through education. Educating farmers on new technologies by utilizing existing and accepted communications media has been shown to provide more effective and impactful results regarding the transfer of information. This blending of information sources has been shown to ease the transition into newer technologies and improve farmers’ knowledge simultaneously (James, 2005). With the internet emerging as a functional tool, farmers in developing countries need to have the knowledge to access electronic resources including price, technology, and developmental information. Poor computing resources and low technological cognitive ability have been identified as barriers to farmers’ use of internet communication technology as a mode of information transfer (Kshetri, 2007). Understanding and improving farmers’ educational needs is a key element in improving information dissemination in developing countries.
Information Diffusion in Developing Markets
Diffusion literature is broad regarding developing markets and an expansive proportion is devoted to understanding the market development process. Market development in diffusion literature varies widely regarding specific methods that can be
9
applied to improve information diffusion within developing countries. One method regarded as necessary to effect market development is the transformation of the agricultural industry structure to incorporate more efficient and effective means to transfer information and technology. Restructuring of the agricultural sector has been identified as a necessary step in the market development process in developing countries (Rearden, Barrett, Berdegue, & Swinnen, 2009). Effectively impacting the diffusion of technologies and information requires a more thorough understanding of how
innovations can effectively be dispersed through different societal groups. Spielman (2005) identified the need for better understanding of how innovations are disseminated in developing countries as a primary research initiative. Within the context of
information diffusion in developing countries, a more thorough understanding of how social and economic factors interrelate is necessary to improve the diffusion process. Diffusion in developing markets is highly dependent on social elements. Individuals are more likely to adopt an innovation when it is highly acceptable within the individual’s social context, is desirable, and is presented through a verified medium of exchange (Young, 2009). Informational exchange mediums are integral parts of the information exchange process and should be understood to ensure effectively overcome barriers to communication.
Farmers in developing countries have many disadvantages to farmers in countries with developed economies. Disadvantages to farmers include barriers to information and technological exchange (Godfray, et al., 2010). Lack of education and
10
of information and technology to farmers in developing countries (Dutta, 2009). The literature has a gap concerning how education and communication techniques can best be disseminated to farmers in developing countries is broad and inconclusive. It has been argued that farmer field school and other means of non-formal education are an appropriate venue to communicate technologies (Binam, Sylla, Diarra, & Nyambi, 2003). The establishment of futures exchanges in developing countries has been
suggested as a means to effectively disseminate transparent price information (Sampson, 2012). Many theories exist about the best way to disseminate information and
technology to farmers in developing countries although none have been demonstrated to be ideal for all settings (Wellard, Rafanomezana, Nyirenda, Okotel, & Subbey, 2012). Societal influences have been shown to be instrumental in determining the most
effective method to communicate information and technological innovations to farmers in developing countries (Huang, Shih, & Wu, 2011). Social influence at the farm level is highly contextual. A firmer grasp of the fundamental elements impacting societal
influence in developing countries and thus the context of best dissemination practices is important for researchers to understand in order to appropriately affect positive change (Quaim, 2005).
This study sought to address recommendations from the National Research Agenda of the American Association of Agricultural Education (Roberts, Harder, & Brashears, 2016) and existing literature to improve the practical comprehension of information diffusion within production agriculture. This line of inquiry specifically addresses Research priority 2, “New Technologies, Practices, and Product Adoption
11
Decision.” As new technologies emerge it is important to have a grasp on the key elements impacting the adoption and diffusion of information and technology. Research priority 6, “Vibrant, Resilient Communities” was also identified as a tenet of this study. Understanding the impacts of technology use in production agriculture is fundamental actuating positive community change as an output of new technology adoption. More thoroughly understanding the diffusion of information and innovation process as it relates to developing countries is necessary to improve the ability of practitioners to impact change and accelerate developing market growth.
12 CHAPTER II
THEORETICAL FRAMEWORK
The underlying framework utilized by this study to evaluate the diffusion of information and technology in developing countries is Rogers’ (2003) Diffusion of Innovations theory. Innovation diffusion has frequently been utilized in current
literature to analyze technological and information exchange in a multitude of settings. Rogers (2003) proposed in his seminal work that diffusion theory was applicable to many disciplines including agriculture and business. The diffusion framework has been used to evaluate both technology and information in various fields. Interdisciplinary work has been conducted to determine the validity of diffusion theory in different contexts. MacVaugh and Schiavone (2010) found that a more robust understanding of innovation diffusion can be achieved when innovation diffusion is evaluated at different levels of social systems and contextual domains. Information exchange can be
characterized by diffusion theory at different levels. Research conducted within the domain of information transfer has found that information diffusion can be effectively analyzed using diffusion theory at the local, national, and international levels (Verdolini & Galeotti, 2011). Technology as an innovation has been effectively evaluated using the diffusion framework in different settings as well. Hilbert (2010) utilized diffusion of innovation theory to evaluate the impacts of technological advances on Latin American populations and the probable impacts resulting from future increases. Innovation diffusion is a powerful framework that can be used to analyze both technological and
13
informational innovations at micro and macro political levels and within various individual and social contexts as well.
Innovations and Adoption Decisions
Rogers (2003) defined an innovation as an idea, object, or behavior that is perceived as new by the target audience. The diffusion of innovation framework revolves around the interaction between innovation qualities, peer networks, and individual needs to describe how innovations are adopted or rejected. Contemporary research in innovation diffusion found that interaction between the innovation, peer networks and individual needs is highly contextual (Atun, de Jongh, Secci, Ohiri, & Adeyi, 2010). Rogers identified four key elements in the diffusion process including the innovation itself, the channels through which the innovation is communicated, time, and the social system in which the innovation is enacted. MacVaugh and Schiavone (2010) noted that the four elements in diffusion are multidimensional and should be evaluated at the micro, meso, and macro levels of a society and context to achieve a more robust understanding of the diffusion and decision process. The final decision process was defined by Rogers (2003) to be governed by who makes the decision within a context and also whether the decision was made freely. Research has demonstrated that
individual analysis of the adopter’s final decision is generalizable to the aggregate level when bounded within the same context (Zhang & Nutall, 2011). The final adoption decision was posited by Rogers to fall into three distinct categories. The categories of adopter decisions include optional decision, the collective
14
the adoption decision is made by an individual within the social system who is
distinguished from the other members of the system. The collective innovation-decision is characterized as being made by all individuals within a system, and the authority innovation-decision is defined as being made by a few individuals within the social system. Adoption decisions are not mutually exclusive. Under certain cases, the adoption of more complex innovations can often require two or more types of adoption decisions. Adoption decisions made under authoritative innovation-decision are often found to meet stronger resistance to adoption at the implementation stage (Borrego, Froy, & Hall, 2010). In the context of production agriculture, the adoption decision process has often been modeled based on economic rationale and efficiency gains from innovation adoption. Recent empirical studies have demonstrated that inefficient and economically poor innovations are often adopted in agricultural communities as a result of overpowering community forces and externalities influencing the adoption decision (Sneddon, Soutar, & Mazzarol, 2011).
The innovation decision process within the diffusion framework is posited to have five stages (Rogers, 2003). The five stages of the decision process include knowledge, persuasion, decision, implementation, and confirmation. The knowledge component of the decision process consists of an individual being made aware of the existence and function of an innovation. Knowledge about an innovation allows the adopter to understand the potential implications of the innovation to the adopter. The persuasion stage of the decision process is when the individual, having knowledge of the innovation, develops an attitude toward the innovation. Adopter attitude is a critical
15
component of the decision process at the early stages. One of the primary challenges by contemporary theory to the seminal persuasion component is the inability of the classical theory to account for demographic differences among adopters (Abukhzam & Lee, 2010). The decision element of the decision process involves the individual making a decision or attitude adjustment that results in either innovation adoption or rejection. Mass media has been found to play a fundamental role in adoption particularly at the knowledge, persuasion, and decision stages of the process (Green, Ottoson, Garcia, & Robert, 2009). The implementation stage is typified by the individual overtly using the innovation. Implementation is the first tangible stage of the innovation adoption
process. The confirmation stage is characterized by the individual evaluating the
innovation-decision that has been made and choosing to continue or reverse the decision based on information collected from the use of the innovation. Rogers (2003) presented the stages in the decision process as being sequential in occurrence. Recent empirical evidence suggests that the factors influencing the adoption process may be dynamic in many cases (Mendoza, Carroll, & Stern, 2010). Agricultural producers present an additional variable in evaluating the innovation decision process. Agricultural
innovations are often subject to greater constraints than the traditional innovation in that agricultural innovations are often climate specific. Similarly agricultural producers in different geographic and socioeconomic regions are often subject to mutually exclusive constraints including financial limitations and climactic differences. Research
evaluating the ability for agricultural producers in both developed and developing countries has found that the most binding constraints in innovation diffusion relate to
16
financial barriers, occur at the adoption level, and are more pronounced in agricultural producers in developing countries (Lybbert & Sumner, 2012).
Rate of Adoption
In addition to defining a process of adoption, Rogers (2003) also posited factors influencing the adoption rate. The rate of adoption is the relative speed with which individuals in a system adopt an innovation. Under the classical model of innovation adoption, rates of adoption were generally considered to be linear in nature. With the advent of the internet, social media, and faster mass communication the rates of
diffusion have changed in both speed and complexity (Peres, Muller, & Mahajan, 2010). Key factors identified by Rogers (2003) that influence the type of innovation-decision, the type of communication channels through which the innovation was diffused, the type of social system in which the innovation was diffused, and the efforts of change agents seeking to facilitate diffusion. Rogers (2003) noted that the type of innovation-decision had a significant impact on the diffusion process. Specifically, Rogers’ noted that individual innovation-decisions and optional innovation-decisions were generally adopted more quickly than organizational innovation-decisions. The type of communication system in which the diffusion process is actuated also plays a role. Rogers (2003) noted that communication systems dependent on interpersonal communication tended to result in a slower diffusion adoption rate than mass media communication. The social system under which the innovation is diffused is important to innovation diffusion also. A more open system in which the communication system is more closely linked to the social system generally results in a more rapid innovation
17
diffusion process. Broader communication is not always the best scenario to affect innovation adoption. Under circumstances where social influence is the more powerful driver even in the midst of rapid communication it has been found that the innovation adoption process can be disrupted (Delre, Jager, Bijmolt, & Janssen, 2010). Change agent interaction was the final component identified by Rogers (2003) as the impacting the rate of diffusion. Change agents are classified by Rogers (2003) as individuals outside a system seeking to affect diffusion. Change agents located within the social system or networks are referred to as opinion leaders. Cho, Hwang, and Lee (2012) expanded the definition of opinion leaders to encompass degrees of communication behavior utilized by the opinion leaders within a system. When the impact of change agents reaches a maximum level then the innovation achieves critical mass. Critical mass within the diffusion framework pertains to the level of adoption of an innovation after which the adoption will continue to spread without the additional efforts of change agents. There have been some discrepancies in contemporary research regarding the importance of individual change agents in achieving critical mass. Empirical evidence has suggested that the probability of change agents triggering a critical mass in adoption is only marginally higher than the probability of non-change agents (van Eck, Jager, & Leeflang, 2011). In the contexts where change agents are appropriate drivers of innovation diffusion those change agents with high levels of social ability have been found to influence more rapid adoption whereas change agents with a broader range of social contacts are more effective at influencing greater numbers of adopters (Cho, Hwang, & Lee, 2012). Change agents in agriculture play a significant role in developing
18
countries. Lower income agricultural producers typically associated with developing countries have been found to rely more heavily on peer networks than on extension personnel for innovation information. The most effective change agents within the small agricultural communities of developing countries are opinion leaders (Amlaku, Solkner, Puskur, & Wurzinger, 2012).
Innovation Characteristics
Characteristics of the innovation itself play a role in the adoption process. Rogers (2003) identified five primary attributes of an innovation that impact its
adoption. The five innovation attributes are the relative advantage of the innovation, the compatibility of the innovation, the complexity of the innovation, an innovation’s trialability, and the ability of the adopter to observe the effects of the innovation. Relative advantage is generally considered to be the degree to which an innovation is superior to the innovation it replaces (Rogers, 2003). Relative advantage can be expressed in economic or social terms. Compatibility is the degree to which the innovation is compatible with the needs, values, and experiences of the adopters. Innovations consistent with the existing norms of the adopter tend to achieve greater rates of adoption. Complexity of an innovation is related to the ease with which the innovation can be understood and used. Greater degrees of complexity tend to result in lower levels of innovation adoption. Trialability is the innovation attribute associated with the adopter’s ability to test the innovation. Trialabilty is a function of access, price, and divisibility. Higher levels of trialability tend to result in greater levels of adoption. The fifth characteristic identified by Rogers (2003) was observability. Observability
19
revolves around how well others can see the characteristics and traits of the innovation. Higher levels of observability are generally associated with greater levels of innovation adoption. In many agriculturally specific applications of innovation diffusion the concepts of relative advantage, compatibility, and complexity tend to be more apparent to adopters than trialability and observability (Moore, Murphrey, Degenhart, Vestal, & Loux, 2012). Increasing the transparency and apparent characteristics of an innovation can help to improve the ability and speed of an innovation to diffuse in an agricultural context. When working with agricultural producers it has been found that the
characteristics of an innovation can be more clearly portrayed by maintaining the economic implications of the innovation as it relates to the producer in the forefront of the diffusion conversation (Ozcatalbas & Brumfield, 2010). Presenting the innovation to agricultural producers using concrete methods and pertinent examples can also facilitate the adoption process.
Adopter Categories
In addition to innovation characteristics, adopter categories were also defined as a component of the adoption process. Adopter categories classify potential adopters based on the adopters’ individual idealistic characteristics. Rogers (2003) proposed five adopter categories that he posited would maintain the shape of an ‘S’ curve. The five categories proposed by Rogers were innovators, early adopters, early majority, late majority, and laggards. Innovators were categorized as being generally venturesome. Adopters in the innovator category were posited to control significant financial
20
Early adopters were associated with high levels of social standing within the community. Early adopters were also considered to maintain above average levels of intelligence and risk tolerance. The adopters in the early adopter category were generally posited to be older and more established than adopters in the innovator category of adoption. The early majority category was found to have many of the same characteristics as the early adopters with the primary distinction being that early majority adopters tended to not be in positions of leadership. Early majority adopters also were characterized by a lower risk tolerance than adopters in the innovator and early adopter categories. The late majority adopter category was noted to have higher levels of skepticism about an innovation and tended to adopt only after adoption of the innovation became an
economic or social necessity. The adopters in the late majority adopter category tended to have fewer resources and maintained a higher degree of risk aversion. The fifth adopter category defined by Rogers was the laggard category. Laggards were
determined to be the final adopters of an innovation within a social system. Laggards tended to be isolated from other adopters and maintained traditional practices to more modern techniques. Financial resources were found to be comparatively scare for
adopters in the laggard category and thus the adopters in the laggard category maintained a very high level of risk aversion. In some agricultural settings, adopter categories have been found to deviate from the classical theory. Based on societal context and values some of the adoption stages have been found to be omitted from the process (Moore, Murphrey, Degenhart, Vestal, & Loux, 2012). The categorization of agricultural producers into specific adopter categories can also be difficult. Agricultural producers
21
tend to have a greater degree of risk aversion than conventional innovation adopters. Similarly the costs associated with many agricultural innovations are often high and irreversible. Consequently a larger portion of the population of agricultural producers will choose to adopt later in the process (Howley, Donoghue, & Heanue, 2012).
Rogers (2003) identified the characteristics and processes of innovation adoption and diffusion within broad theoretical contexts. Innovation diffusion applies to
agricultural producers in developing countries much the same as in other settings but with some unique nuances. Communication channels and social system represent a greater element of the innovation process when dealing with agricultural producers. As agricultural producers in developing countries are typically community oriented,
effective innovation diffusion requires a strong acceptance by the producer’s peers. The adoption decision in agricultural communities is thus influenced not only by the
individual but also by the collective. The diffusion process in developing agricultural communities is fundamentally equivalent to that of classical theory but with more emphasis being placed on the knowledge, persuasion, and decision components as needs by the adopters. Adoption rates in developing agricultural communities are influenced more heavily by social network and opinion leaders although external factors such as extension personnel can aid an innovation in achieving critical mass. Given the inherent risk of production agriculture and the agricultural producer’s typical aversion to risk, the adopter categories tend to be skewed within the process in favor of fewer innovators in lieu of early and late majority adopters. Finally, relative advantage, compatibility, and complexity of the innovation itself have been found to be more visible, indicating a need
22
for greater transparency of the trialability and observability aspects of the innovation itself.
23 CHAPTER III
METHODS
This purpose of this chapter is to demonstrate the research design method, population and sample selection techniques, instrument, collection of data, and data analysis processes used to achieve the purpose of this study. The purpose of this study was to contribute to the body of knowledge surrounding the diffusion of information and technology among agricultural producers in developing countries. The objectives
delineated to achieve the purpose of the study were:
1. Describe the adopter characteristics of agricultural producers in Brazil;
2. Describe the innovation traits that facilitate technology and information adoption in Brazil;
3. Describe agricultural innovation adoption processes in Brazil; and
4. Identify key elements and barriers of information transmission and adoption in Brazil.
Research Design
Research design methodologies utilized to achieve the objectives of the study were descriptive and correlational research. Descriptive research was utilized to provide insight into opinions, attitudes, and practices (Gall, Gall, & Borg, 2007) utilized
currently in Brazil to disseminate innovations. Descriptive statistics used in the analysis included means, standard deviations, correlations, frequencies, and percentages.
24
variables, enabling a more robust generalization of results (Tuckman, 1999). The research design allowed for the investigation of the existing variations in the variables based on the results of a survey instrument completed by agricultural producers in Brazil.
Population and Sample
The population for this study consisted of 3,289 agriculturists in the province of Rio Grande do Sul, Brazil. Rio Grande do Sul, Brazil was selected specifically for the characteristics of the agriculturist population in that province. The population was considered to be homogeneous in nature in that the socio-economic level did not vary significantly between individuals. The population was generally geographically dispersed and was rural in nature. Information sources for the population were largely centralized with the research stations which helped to control for informational
asymmetries at the research level. The sample was selected based on agricultural
cooperative meeting attendance in the Rio Grande do Sul province. A random sample of 369 individuals was selected based on respondent’s characteristics. The target sample was 350 respondents. An additional 19 instruments were completed beyond the target. The sample was limited to agriculturists who utilized recognized emerging technologies and contemporary marketing techniques within the cooperative. Twenty-five surveys were submitted incomplete during the data collection process. The remaining 344 surveys constituted 10.4% of the target population.
25
Instrumentation
A questionnaire (Appendix A) consisting of nine constructs was administered for this study. The instrument used was derived from the proposed instrument of Moore and Benbasat (1991) evaluating the adoption of technological innovations. The instrument was not immediately suitable for the study of the target population as the instrument was not agriculturally focused. The instrument was subsequently amended to incorporate agricultural terminology while maintaining construct integrity. Advice on amending the final instrument was sought from faculty members at Texas A&M University, faculty members at South Dakota State University, and professionals involved in agricultural industry in the Rio Grande do Sul province of Brazil. Care was taken by the researcher to ensure clarity, purpose, and cultural awareness of the target population. The survey was translated from English into Portuguese by Global Speak Translations. The
individual questions were constructed to minimize individual misinterpretation such that each individual would be able to interpret and accurately respond to all questions
(Dillman, Smyth, & Christian, 2009).
The instrument used in this study consisted of eight attitudinal constructs and one demographic construct. Each attitudinal construct was measured on a five point Likert-type scale ranging from one to five. The scale for each construct was coded as follows: strongly disagree was coded as a value of “1,” disagree was coded as a value of “2,” neither agree nor disagree was coded with the value of “3,” agree was assigned the value of “4,” and strongly agree was coded to the value of “5.” The resulting measurements collected from the attitudinal component of the instrument were collectively interpreted
26
as higher values being associated with more positive attitudes. Constructs were evaluated using directional statements consistent with the Tailored Design Method (Dillman et al., 2009). Negatively focused statements were reverse-coded to preserve data integrity. The attitudinal constructs measured by the instrument were voluntariness, relative advantage, compatibility, image, ease of use, result demonstrability, visibility, and trialability. There were four questions measuring the individual’s attitude toward voluntariness. The relative advantage construct consisted of nine questions measuring the relative advantage attribute of the innovation. Compatibility was measured as a construct using four questions while the construct surrounding image was evaluated with five questions. Eight questions were presented on the instrument to address the ease of use construct and four questions were presented to address the demonstrability construct. The visibility and trialability constructs were each measured by five statements. The demographic component of the survey instrument addressed the demographics of the sample. The demographic construct collected data on age, education, profession, and gender. The purpose of the demographic questions was to aid in describing the
aggregate sample and to assist in describing the characteristics of the individuals within the identified adopter categories.
Validity
Validity is an important element of research and is used to evaluate the ability of an instrument to measure its intended constructs appropriately (Gall et al., 2007). Validity consists of both internal and external validity. Internal validity represents the minimum standard for basic research to be considered appropriate. Eight variables have
27
been identified to impact internal validity including history, maturation, testing, instrumentation, statistical regression, selection, mortality, and selection-maturation interaction. An additional six variables were identified as potential threats to instrument validity. The variables relating to instrument validity were construct validity, face validity, content validity, concurrent validity, predictive validity, and consequential validity. The threats to internal validity were addressed in this study by several
techniques. History was evaluated within the context of the study as the instrument was designed to measure participant perceptions. One component of perception was the participants’ experience of past events which cause history to threaten the internal validity of the study. Maturation as a form of internal validity was addressed by collecting the data in the minimal amount of time to prevent maturation as a threat to internal validity. Participants were permitted only one response to the survey instrument thereby mitigating the testing element of internal validity. The threat to internal validity by instrumentation was not apparent as only one instrument was utilized for this study. To address statistical regression, the data was analyzed as one group. The threat internal validity posed by selection was minimized by the use of one grouping for analysis and sampling. Experimental mortality and selection-maturation threats were addressed by achieving data collection over a short period of time and the resulting analysis conducted as a single group.
Instrument validity was assessed based on construct, face, content, concurrent, predictive, and consequential validity. To handle construct validity, the individual statements for each construct were developed from an established instrument with
28
documented reliability measures. This was done to minimize the experimental design bias. As the purpose of the research was descriptive, threats from researcher
expectations and the Hawthorne effect were considered to be minimal. Face validity was a concern as the target audience was not expected to have significant experience with research surrounding innovations. The context in which the instrument was administered at a technical trade show helped to minimize the threat of face validity. Content validity was another concern with the instrumentation. Content validity was minimized during the instrument development process by drawing on existing literature and instrumentation in order to refine the individual constructs. The constructs were refined to extract the maximum amount of data from each construct such that the aggregate instrument remained within the appropriate length parameters. Concurrent validity relates to the comparison between the performance of the instrument and some other concurrent measurement taken at the same time. Concurrent threats to
instrumentation were considered to be minimal and were to be evaluated based on the comparison between the adopter and non-adopter groupings. As the research was descriptive and not predictive, predictive validity was not considered a danger to instrument validity. Consequential validity relates to the positive and negative social consequences to the administration of an instrument. With the goal of enhancing the adoption process which is a benefit to the participants, no negative social consequences were identified as a result of administering this instrument. As such, the threat of consequential validity to the instrument was considered to be minimized.
29
External validity is described as the ability to generalize the results of a study to a broader population. Threats to external validity encompass population validity and ecological validity. Population validity assesses the threats dealing with the general population while ecological validity evaluates the threats associated with the
environment of the study. Ecological validity relates to the amount that the results from a study are influenced by the environmental conditions created by the researcher.
Population validity in this study was managed by using a random sample drawn from the total study population. The sample data were analyzed to investigate statistical
difference between early and later responders (Lindner, Murphy, & Briers, 2001). To establish the existence of differences between early and late responses one-way analysis of variance (ANOVA) and independent samples t-tests between the early and late response groups were utilized. The threats associated with ecological validity include the inability to replicate results, multiple treatment interference, the Hawthorne effect, disruption effects, researcher effect, pre-test sensitization, post-test sensitization, interaction effects, measurements effects, and time effects (Fraenkel & Wallen, 2009). The study design including large sample properties and a single use survey instrument served to minimize the threats to the ecological element of external validity in this study.
Reliability
The revised instrument was pilot tested in January 2017 using a sample of 33 agriculturists in Rio Grande do Sul, Brazil. The purpose of the pilot tests was to compare the initial reported measures of validity for the instrument to the calculated validity of the revised instrument. The instrument was further revised based on the
30
results of the reliability analysis. Reliability of each of the scales was evaluated using Cronbach’s Alpha statistic to determine internal consistency. Reliability is a concept in research used to measure how well a specific instrument consistently produces similar results (Gall et al., 2007). Cronbach’s Alpha is one of the most commonly used
reliability measure in instrument-based research. Cronbach’s Alpha reports the average correlation between all of the items on a given scale (Fraenkel & Wallen, 2009). Cronbach’s Alpha levels above 0.7 are considered to be the minimum requirement for social science research (Nunnally, 1967). The reported Cronbach’s Alphas for scales on the initial instrument were 0.9 for the relative advantage construct, 0.86 for the construct measuring compatibility, 0.84 for the ease of use construct, 0.79 for the demonstrability, 0.79 for the construct measuring image, 0.83 for the visibility construct, 0.71 for the trialability construct, and 0.82 for the construct measuring voluntariness (Moore & Benbasat, 1991).
Data Collection
Data collection for this study was conducted during February 2017 using a paper instrument. The paper questionnaire consisted of a multiple page book-fold instrument (Appendix A). The paper instrument used in this study was administered in adherence to the recommendations of the Tailored Design Method (Dillman et al., 2009). The
instrument itself was administered by the researcher and a contracted data collection staff in cooperation with the Instituto Rio Grandense do Arroz (IRGA) in Rio Grande do Sul, Brazil. All interactions with respondents were conducted in a traditional face-to-face style. Participants were asked to review and sign an informed consent page
31
(Appendix B) that outlined the purpose of the research, provided the researcher’s contact information and demonstrated the Internal Review Board (IRB) approval for the project. The instrument was completed after the informed consent form was completed by each participant.
Data Analysis
Data analysis for this research study consisted of coding and analysis by
statistical software to obtain the descriptive and correlational statistics required to meet the objectives of the study. The coded data were entered into a Microsoft Excel 2010 spreadsheet and then uploaded and analyzed using the Statistical Package for Social Sciences (SPSS) version 21 for Microsoft Windows. The significance level for the descriptive and correlational statistics used in this study was established a priori at the 0.05 significance level. The 0.05 significance level is generally accepted as appropriate for statistical analysis in social science research (Fraenkel & Wallen, 2009; Gall et. al., 2007). Statistical measures used for this study included mean for measuring central tendency and standard deviation to measure the dispersion (Field, 2009). Categorical data was described using frequency and percentages. The interaction effect between variables was analyzed using regression analysis. Stepwise multiple regression analysis was also used to establish the relationships between the construct statements and the variables of the study. The stepwise regression method analyzed the amount of variance in the dependent variable explained by the independent variables (Gall, Gall, & Borg, 2007), which was one of the primary goals of the exploratory research. Principal component analyses are used primarily to explain the variance structure between
32
variables using linear combinations to achieve data reduction and improve data
interpretation (Johnson & Wichern, 2007). Study constructs were measured on a Likert-type summated scale. The summated scale approach to construct measurement provided a basis for analysis to describe and draw inference from individual constructs.
Analysis of Data – Objective One
The first objective of this study was to describe the adopter characteristics of agricultural producers in Brazil. To accomplish this objective descriptive statistics such as mean, standard deviation, frequency, and percentage were used to describe the demographic characteristics of agricultural producers. Frequencies were used to describe rates of adoption of different types of innovations. Adopter classification was achieved by using mean, standard deviation, and frequency. Based on the analysis of the data the respondents were characterized into adopter categories. Categories were
established based on the “S” shaped adopter curve posited by Rogers (2003).
Demographic questions consisting of ordinal data and attitudinal questions on a five point Likert-type scale were used for categorization.
Analysis of Data – Objective Two
The second objective of this study sought to describe the innovation traits that facilitate or hinder the technology adoption decision in Brazil. Descriptive statistics were used to identify specific innovation characteristics associated with different
innovation types. Mean and standard deviation characterized the specific characteristics as desirable or undesirable in an agricultural innovation. Data collected from the survey instrument containing constructs specific to innovation characteristics on a five-point
33
Likert-type response scale (Strongly Disagree, Disagree, Neither Agree nor Disagree, Agree, Strongly Agree) was used to classify the characteristics of innovations. The interpretation of the results was accomplished by analyzing the mean values of the constructs from the survey instrument specific to the innovation. Mean values greater than 4 indicated a positive characteristic while mean values between 2 and 3.9 indicated characteristics that were neutral or less desirable. Mean values lower than 1.9 were considered to be detrimental or undesirable innovation characteristics Regression analysis was performed on the data to examine the relationship between specific characteristics and successful innovation adoption. Factor analysis was performed on the variables to establish which characteristics contributed the most to innovation adoption.
Analysis of Data – Objective Three
The third objective of this study was to describe the agricultural innovation adoption process in Brazil. The results of the survey instrument were analyzed using a correlation analysis technique to determine the relationships between adopter categories, geographic location, and innovation specific characteristics. A stepwise regression analysis was also used to describe the adoption process based on the adopter categories and the innovation characteristics. The stepwise regression technique was selected for its ability to compare the individual statements from each construct and optimize the final model for explanatory power. The stepwise regression analysis was also able to evaluate the impacts that the identified statements had on the adopter category variables
34
in the study. The results of the correlation and regression analysis allowed the
researcher to establish the nominal characteristics of the adopter curve for the sample. Analysis of Data – Objective Four
The fourth objective of this study was to identify key elements of and barriers to agricultural technology adoption in Brazil. To accomplish this objective, constructs from the survey instrument evaluating perception were analyzed. The constructs were based on a five point Likert-type scale and investigated the perceptions of agricultural producers. Means in excess of 3.5 indicated agreement with the statement about the barrier or element of adoption while means between 2 and 3.4 indicated that the statement was neither a facilitator nor barrier to adoption. Mean values less than 1.9 indicated that the construct being evaluated was a barrier to adoption.
35 CHAPTER IV
RESEARCH FINDINGS AND DISCUSSION
The purpose of this study was to evaluate the level of information and technology diffusion in the agricultural sector of Rio Grande do Sul, Brazil. The objectives of this study were to
1. Describe the adopter characteristics of agricultural producers in Brazil;
2. Describe the innovation traits that facilitate technology and information adoption in Brazil;
3. Describe agricultural innovation adoption processes in Brazil; and
4. Identify key elements and barriers of information transmission and adoption in Brazil.
Demographic Profile of Participants
Analysis of the demographic data of the study population was accomplished by the application of descriptive statistics. The descriptive statistics were used to assist in understanding and interpreting the results of the research and its implications.
Twenty-two percent of the respondents in the study were female and 77% were male. One percent of the participants chose not to provide gender related demographic data. The mean age of the respondents in the study was 41 years old. The respondent’s ages ranged from 17 to 75 years old. Eleven percent of participants opted not to report age related data. Respondents’ ages were categorized into seven groups for reporting
36
purposes (Table 1). Seventy-seven percent of the study participants were between the ages of 25 and 64 years old.
Table 1
Respondent’s Ages (n=344)
Age f %
Under 25 years of age 31 9.3
25 to 34 years of age 80 24.0
35 to 44 years of age 70 21.0
45 to 54 years of age 64 19.2
55 to 64 years of age 44 13.2
65 years of age and older 10 3.0
Missing Data 35 10.5
Note: M = 40.9; SD = 13.2
Participants’ educational levels ranged from respondents with no formal
education to respondents who had completed post-graduate degree programs (Table 2). The largest group (31.1%) reported having completed high school as the highest
education achieved, while 39.8% of all participants reported having completed a bachelor’s or post-graduate degree. Seven participants chose not to report education related data.
37 Table 2
Highest Educational Level of Participants (n=327)
Educational Level f %
No Formal Education 15 4.5
Primary School 43 12.9
High School Diploma 104 31.1
Some College Courses 32 9.6
Bachelor’s Degree 91 27.2
Postgraduate Degree 42 12.6
Data profiling respondents’ professional occupations was also collected. 40.1% of respondents were farmers and 37.1% were employed in related agricultural industries. 53 respondents (15.9%) were classified as other professions while fourteen respondents (4.2%) were classified as marketers (Table 3).
38 Table 3 Occupations of Respondents (n=325) Occupation f % Farming 134 40.1 Agricultural Industry 124 37.1 Other Agricultural 53 15.9 Marketer 14 4.2
Research Findings for Objective One
The first research objective of this study was to describe the adopter characteristics of agriculturists in Rio Grande do Sul, Brazil. Adopters were characterized by their willingness to try agricultural technology voluntarily, a high perception of the relative advantage of an innovation, strong compatibility between the innovation and the individual’s lifestyle, stronger perception of image associated with using an innovation, being readily able to use new innovations, being readily able to grasp the use of new innovations, easily perceiving new innovations in their
environment, and the individual’s positive perception about trying new innovations. Of the study’s participants, 41 individuals (12.3%) met the criterion for adopter while 291 participants (87.7%) were classified as non-adopters. Within the classified adopter category, 87.8% of adopters were identified as being male while 12.2% of adopters were female. The predominant adopter age group was 25 to 34 years old, but a majority
39
(51.2%) of the adopters was 45 years old or older. Adopter age demographics are shown in Table 4.
Table 4
Adopter’s Ages (n=41)
Age f %
Under 25 years of age 1 2.4
25 to 34 years of age 12 29.3
35 to 44 years of age 6 14.6
45 to 54 years of age 10 24.4
55 to 64 years of age 10 24.4
65 years of age and older 1 2.4
Missing Data 1 2.4
Note: M = 44.7; SD = 13.3
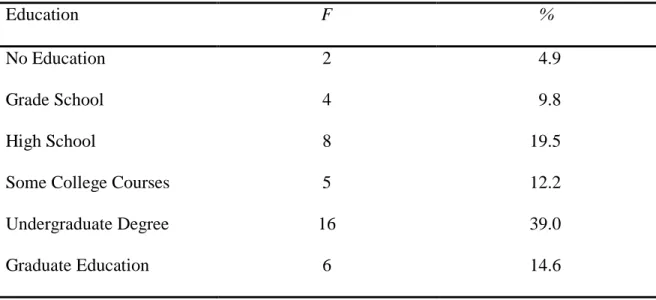
Adopters were found to be educated with 85.3% having completed high school, with 51.2% of adopters reported having completed an undergraduate degree or some college coursework. Moreover, 14.6% of adopters had attained a post-graduate degree or higher education. Table 5 reports the educational achievement levels of adopters.
40 Table 5
Highest Educational Level of Adopters (n=41)
Education F %
No Education 2 4.9
Grade School 4 9.8
High School 8 19.5
Some College Courses 5 12.2
Undergraduate Degree 16 39.0
Graduate Education 6 14.6
Voluntariness of the adopters was the first construct evaluated. The purpose of the voluntariness construct was to evaluate the degree to which the individual did or did not actively seek out an innovation. The voluntariness construct also measured
involuntary factors through specific statements in order to gain further knowledge about that particular aspect of the adoption decision. When asked about the use of technology in their daily lives, participants classified as adopters responded with strong affirmation. Adopters’ perceptions of required use of technology by their peers had the greatest impact on adoption with a mean value of 4.61. The voluntary use of technology to locate price information also had a large impact on adoption with a mean value of 4.54. Table 6 demonstrates the ranked characteristics of adopters under the construct of voluntariness.
41 Table 6
Indicators of Adopters’ Voluntariness (n=41)
Characteristic M SD
My peers expect me to use technology 4.61 .49
I use technology voluntarily 4.54 .50
Technology is useful but not required 4.39 .49
My job requires use of technology 4.34 .53
Note: M = 4.47, SD = 0.51, 1 = Strongly Disagree, 2 = Disagree, 3 = Neither Agree nor Disagree, 4 = Agree, 5 = Strongly Agree
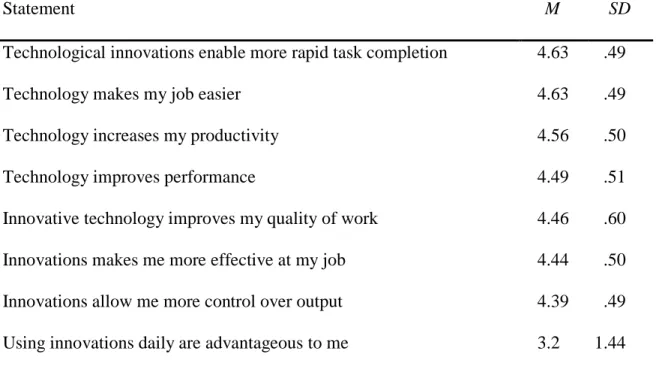
Relative advantage was the second trait that by which adopters were
characterized. Adopters reported a strong belief (M = 4.63, SD = .48) that technology was beneficial in helping to accomplish tasks more frequently. Participants in the adopter category also indicated that technology made their jobs easier (M = 4.63, SD = .48). Increases in productivity as a result of technology innovation use (M = 4.56, SD = .50) was a perception of adopters as well. Table 7 summarizes the characteristics of adopters for the construct of relative advantage.