Contents lists available at ScienceDirect
Pattern
Recognition
journal homepage: www.elsevier.com/locate/patcog
The
impact
of
class
imbalance
in
classification
performance
metrics
based
on
the
binary
confusion
matrix
Amalia
Luque
a,∗,
Alejandro
Carrasco
b,
Alejandro
Martín
a,
Ana
de
las
Heras
a a Dpto.IngenieríadelDiseño.EscuelaPolitécnicaSuperior.UniversidaddeSevilla.VirgendeÁfrica,7.41011Sevilla,Spain b Dpto.TecnologíaElectrónica.EscuelaPolitécnicaSuperior.UniversidaddeSevilla.VirgendeÁfrica,7.41011,Sevilla,Spaina
r
t
i
c
l
e
i
n
f
o
Articlehistory:
Received4September2018 Revised22December2018 Accepted22February2019 Availableonline28February2019
Keywords:
Classification Performancemeasures Imbalanceddatasets ClassBalanceMetrics
a
b
s
t
r
a
c
t
Amajorissueintheclassificationofclassimbalanceddatasetsinvolvesthedeterminationofthe most suitableperformance metricstobeused.Inpreviousworkusingseveralexamples, ithasbeenshown thatimbalancecanexertamajorimpactonthevalueandmeaningofaccuracyandoncertainother well-knownperformancemetrics.Inthispaper,ourapproachgoesbeyondsimplystudyingcasestudiesand developsasystematicanalysisofthisimpactbysimulatingtheresultsobtainedusingbinaryclassifiers.A setoffunctionsandnumericalindicatorsareattainedwhichenablesthecomparisonofthebehaviourof severalperformancemetricsbasedonthebinaryconfusionmatrixwhentheyarefacedwithimbalanced datasets. Throughoutthe paper,anew wayto measurethe imbalanceis definedwhichsurpassesthe Imbalance Ratioused inpreviousstudies.Fromthe simulationresults,severalclustersofperformance metrics have beenidentified that involvethe use ofGeometricMean orBookmakerInformedness as thebestnull-biasedmetricsiftheirfocusonclassificationsuccesses(dismissingtheerrors)presentsno limitation forthe specificapplication where theyareused. However,ifclassification errorsmust also beconsidered,thentheMatthewsCorrelationCoefficientarisesasthebestchoice.Finally,asetof null-biasedmulti-perspectiveClassBalanceMetricsisproposedwhichextendstheconceptofClassBalance Accuracytootherperformancemetrics.
© 2019TheAuthors.PublishedbyElsevierLtd. ThisisanopenaccessarticleundertheCCBY-NC-NDlicense. (http://creativecommons.org/licenses/by-nc-nd/4.0/)
1. Introduction
In recent years, the scientific community workingon classifi-cation algorithms has shown an increasing interest in the chal-lenges that arise when imbalanced datasets are considered. Sev-eraloverviewsontheseissueshavebeenaddressedin[2,17,21,24]. Intheseanalyses,theSyntheticMinorityOver-samplingTechnique (SMOTE) [9] and the AdaBoost [39] are highlighted as general-purposesolutions, although algorithms ofa more specific nature can also be found, either as general-purpose [3], as problem-oriented[15]orasclassifier-oriented[33].Algorithmsthataddress theimbalanceprobleminmulti-labelclassification[8]orthat use advanced classifiers such as extreme learning machines[41] can alsobe found.An up-to-datecomparison ofthesetechniques ad-dressingaspecificproblemcanbefoundin[40].
∗ Correspondingauthor.
E-mailaddresses:[email protected](A.Luque), [email protected](A.Carrasco), [email protected](A.Martín),[email protected](A.delasHeras).
A key aspect of thesemethods involves the determination of the classificationperformance, not only inorder to assessthe fi-nalresult,butalsotoobtainafigurewhichhastobeoptimizedby tuningtheclassifierparameters.However,thereisnosinglewayto selectthebest algorithmasanyalgorithmcanobtaingoodresults inoneclassbutpoorscoresinotherclasses.Forthisreason, sev-eralmetricsare usuallyconsidered, whichpermitsthepolyhedral characteristicsoftheclassificationperformancetobeviewedfrom differentpointsofviews.
The impact of class imbalance on classification performance metricshasthereforebecome amajor issue.Severalauthorshave addressedthistopicbyshowingafewexamplesofthisimpacton accuracy[10,22]andonseveralothermetrics[5,13,20].Tothebest of ourknowledge, only one systematic(albeit limited) studyhas beenpublishedthatisnotsimplybasedonexamples,[25].
Thequantitativeresearchonclassificationperformance metrics hastraditionallybeentackledeitherbyusingacollectionofknown andwidelyavailable datasets[1,4],orbyrandomlysimulatingthe classifierresults[27,34].Amixtureofrandomsimulatedvariations onknowndatasetsisemployedinJenietal.[25].
https://doi.org/10.1016/j.patcog.2019.02.023
A.Luque,A.CarrascoandA.Martínetal./PatternRecognition91(2019)216–231 217 In order to overcomethe effect ofimbalance on performance
metrics, severalsolutions havebeensuggested, among whichthe mostcitedistheuseoftheClassBalancedAccuracy(CBA)[1,6,32]. Approachessuchasrelevance-basedevaluation[5],theNormalized PrecisionRate[13],theIndexofBalancedAccuracy[18,28,29],and the multiclassperformance score (MPS)[23] have alsobeen pro-posed.
Inthispaper,an extensiveandsystematicstudyisundertaken of the impact of class imbalance on classification performance metrics. Several dozen performance metrics can be found in the scientific literature, some based on a threshold, others based on probabilities, while yet othersare based on ranks [14]. However, themostwidelyemployed metricsare thosebasedonthe confu-sionmatrix[38],wherethemulti-classcaseisusuallyreducedto a setofbinarycasesusingtheOne-versus-All orthe One-versus-One approach [31].Forthese reasons,ourresearch isfocused on classification performance metrics basedon the binaryconfusion matrix.
Therestofthepaperisorganizedasfollows.Section2presents the methodology employed to measure the impact of imbalance in performance metrics, thereby formally defining the confusion matrix (Section 2.1) and themetrics based thereon (Section 2.2). Section2.3proposesanewfigureforthequantificationoftheclass imbalance,and severalfunctionsandindicators ofthe aforemen-tionedimpact ofimbalancearedefinedin Section2.4.The appli-cationto asetofclassification performancemetrics basedonthe binaryconfusionmatrix ispresentedinSection 3.The discussion andconclusionoftheseresultsareaddressedinSection4.
2. Methodology
2.1. Definitionoftheconfusionmatrix
ConsideradatasetD=
{
d1 ,d2 ,· · ·,dm}
madeupofmelementswheredkrepresentsthek-thelement.Let
be asetofCclasses
=
{
θ
1 ,θ
2 ,· · ·,θ
C}
whereθ
idefinesthei-thclass.TheclassifierCoperatingondk(thek-thelementofthedatasetD)assignsalabel
θ
j andestimatesthat thiselement belongsto the j-thclass, thatis,dk→C
θ
jorC(dk)
=θ
j,whileitreallybelongstothei-thclassθ
i,therebycausingamisclassification(aconfusion)wheni=j. Let A=
{
α
1 ,α
2 ,· · ·,α
m}
be the set of actual classescorre-spondingtothedatasetD,where
α
kistheactualclassofthe ele-mentdk.Furthermore,letE={
ε
1 ,ε
2 ,· · ·,ε
m}
bethesetofclassesestimated by the classifier C foreach element in D, where ɛk is
the estimatedclass ofthe element dk.The performance of C can beassessedusingameasuringfunctionM,whichassignsametric
μ
∈Rtothepair(
A,E)
,thatis,(
A,E)
→Mμ
.In this paper, we will focus on metrics based on the confu-sion matrix,whichrepresentsone ofthe mostcommonmethods topresenttheresultsobtainedbyaclassifier,andisdefinedas
CM≡
⎡
⎢
⎢
⎣
m11 m12 ... m1 C m21 m22 ... m2 C . . . ... ... ... mC1 mC2 ... mCC⎤
⎥
⎥
⎦
. (1)In thisexpression, mij representsthe number ofelements
ac-tually belonging to the i-th class (
θ
i) but that are classified asmembersofthej-thclass(
θ
j).Inthecontextofourresearch,itisbetter todescribe thetermmij inrelation tothetotalnumber of
elementsmibelongingtothei-thclass(
θ
i).Bydenotingλ
ijastheratiomij/mi,theconfusionmatrixcanberewrittenas
CM=
⎡
⎢
⎢
⎣
λ
11m1λ
12m1 ...λ
1Cm1λ
21 m2λ
22 m2 ...λ
2 Cm2 . . . ... ... ...λ
C1 mCλ
C2 mC ...λ
CCmC⎤
⎥
⎥
⎦
, (2)whichcanbeexpressed astheHadamard(element-wise)product oftwomatricesintheform
CM=
⎡
⎢
⎢
⎣
λ
11λ
12 ...λ
1 Cλ
21λ
22 ...λ
2 C . . . ... ... ...λ
C1λ
C2 ...λ
CC⎤
⎥
⎥
⎦
◦⎡
⎢
⎢
⎣
m1 m1 ... m1 m2 m2 ... m2 . . . ... ... ... mC mC ... mC⎤
⎥
⎥
⎦
. (3) Inthebinarycase,thatis,whenthenumberofclassesisC=2, thentheconfusionmatrixcanbewrittenasCM≡
m11 m12
m21 m22 . (4)
Ingeneral, oneofthe classesiscalledthe“Positive” class and theother is namedthe “Negative” class.Therefore,the confusion matrixcanberewrittenaccordingtothisnewterminologyas CM≡
mPP mPN
mNP mNN . (5)
Theelementsofthismatrixarenamedwiththefollowing con-vention:mPP,“TruePositive” (TP);mPN,“FalseNegative” (FN);mNP,
“FalsePositive” (FP);andmNN,“TrueNegative” (TN).
Thetotal numberofpositive mP andnegativemN elementsin
D meet that they summ,the total number of elements, that is, mP+mN=m.Furthermore,itisalsotruethatthenumberof
ele-mentscorrectlyclassifiedinclassP(mPP),andthenumberof
ele-mentsmisclassifiedinthatclassP(mPN),addsuptothenumberof
elementsinthepositiveclass(mP),thatis,mPP+mPN=mP.
Simi-larly,itcan bestatedthatmNP+mNN=mN.Theconfusionmatrix
canthereforebewrittenas CM=
mPP mP−mPP
mN−mNN mNN , (6)
whichcanalsobeformulatedintermsofthe
λ
ijratiosasCM=
λ
PPmPλ
PNmPλ
NPmNλ
NNmN =λ
PPmP(
1−λ
PP)
mP(
1−λ
NN)
mNλ
NNmN . (7)Additionally,thetotalnumberofelementsinDestimatedbyC aspositive(despitetheir actual class),eP,andthoseestimatedas
negative,eN,canbewrittenas
eP=mPP+mNP=
λ
PPmP+(
1−λ
NN)
mN.eN=mNN+mPN=
λ
NNmN+(
1−λ
PP)
mP. (8)Theyalsoadduptothetotalnumberofelements,eP+eN=m.
Thedefinitionsregardingtheconfusionmatrixaresummarizedin Fig.1.
2.2.Metricsbasedonthebinaryconfusionmatrix
Based onthe binaryconfusionmatrix, numerousperformance metricshavebeenproposed[19,27,30,34,37].Forourstudy,the fo-cus is placed on 10 of these metrics, which are summarized in Table1.Allthesemetrics,take valueswithinthe[0,1] range, ex-cept the last three (MCC, BM,and MK), whose ranges lie within the [−1,1] interval. For comparison purposes, these metrics are usedhereinintheirnormalizedversion(MCCn,BMn,andMKn).By namingametricdefinedwithinthe[−1,1]intervalas
μ
,itcanbe normalizedwithinthe[0,1]rangebytheexpressionμ
n≡μ
+1
Fig.1. Confusionmatrixforbinaryclassification.
Table1
Definitionofclassificationperformancemetrics.
Symbol Metric Definedas
SNS Sensitivity T P T P+F N SPC Specificity T N T N+F P PRC Precision T P T P+F P NPV NegativePredictiveValue T N
T N+F N
ACC Accuracy TP+TN
TP+F N+TN+F P F1 F1score 2PRCPRC+·SNSSNS
GM GeometricMean √SNS·SPC
MCC MatthewsCorrelationCoefficient √ TP·TN−FP·FN
( T P+F P)( T P+F N)( T N+F P)( T N+F N) BM BookmakerInformedness SNS+SPC−1
MK Markedness PPV+NPV−1
Itcaneasilybeshown(seesupplementarymaterialinthe elec-tronicversionofthispaper)thatallthesemetricscanbeexpressed as a function
μ
=μ
(
λ
PP,λ
NN,π
P,π
N)
, whereπ
P is the ratio ofpositive elements in the dataset (mP/m) and, analogously, where
π
N≡mN/m. Furthermore, for balanced classes, whenπ
P=π
N=0.5,themthemetricscanbeformulatedas
μ
=μ
(
λ
PP,λ
NN)
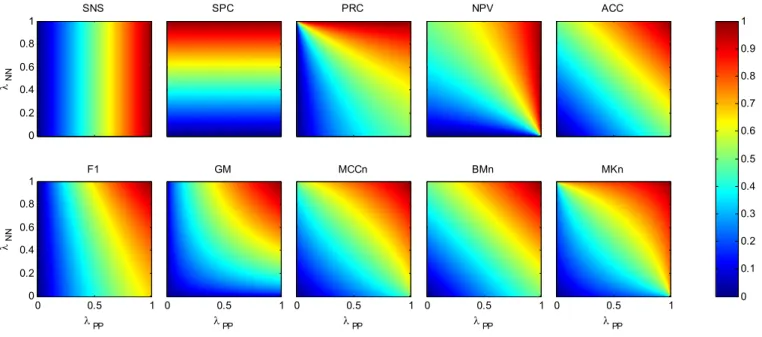
.ThesefunctionsaredepictedinFig.2asaheatmapforeachmetric. The bestclassifier achievesa value of
λ
PP=1(allthepositiveelementsare correctly classifiedas positive)and, also a value of
λ
NN=1(allthenegativeelementsarecorrectlyclassifiedasneg-ative), corresponding to the upper right-hand-side corner in the graphic.Instead,theworstclassifier(
λ
PP=0,λ
NN=0)correspondstothelowerleft-hand-sidecornerofthegraphic.
Althoughonlyperformancemetricsbasedontheconfusion ma-trix are considered, a marginal approach to Receiver Operating Characteristics(ROC)analysis[16]canalsobe carriedout. Inthis analysis,theArea UnderCurve(AUC) iscommonlyusedasa per-formancemetric.However,forclassifiersofferingonlyalabel(and not a set of scores for each label), or when a single threshold isused on scores, the value of AUC andBMn are the same[36]. Therefore, in the forthcoming sections, whenever BMn is men-tioneditcouldalsobeunderstoodasAUC.
2.3.Definingclassimbalance
Theconceptofclassimbalanceisrelativelyclear:itariseswhen the dataset has a different number of elements in positive and negativeclasses.However, itsformalization isfarfrombeing uni-vocallyaccepted. For instance, in [18,29], the imbalance is char-acterizedbythe dominance (Dom) orprevalence relationship be-tween the positive class and the negative class, and is defined asTPR−TNR.Thisvalue islateremployed tocompensate perfor-mancemetrics affected by the imbalance problem. However, the dominanceisnotexactlyameasureoftheimbalanceinthedataset becauseitconsidersimbalanceintheoutcomesoftheclassifier.
Other authors formalize this concept by using the entropy [12]or,morecommonly,theproportionbetweenpositiveand neg-ative instances (formalized as1: X) [13] which is similar to the imbalance ratio(IR) defined asmP/mN [1], alsocalled skew [25].
This value lies within the [0, ∞] range,having a value IR=1in thebalancedcase.
Other authors formalize this concept by using the propor-tionbetweenpositive andnegativeinstances (formalizedas1:X) [13]or,whichissimilar,theimbalanceratio(IR)definedasmP/mN
[1],which isalso calledskew [25].This value lieswithin the [0,
∞]range,havingavalueIR=1inthebalancedcase.
In this paper, it is preferred to feature the imbalance with a value within the [−1,1] range, while reserving the 0 value for when the classes are perfectly balanced (lack of imbalance). For thispurpose,weproposetheimbalancecoefficient
δ
asδ
=δ
P≡2π
P−1=2mP
m −1. (10)
Forthe negativeclass,the coefficient
δ
N=2π
N−1 isalsode-fined.Thesumofthesecoefficientsis
δ
P+δ
N=2π
P−1+2π
N−1=2(
π
P+π
N)
−2=0. (11)Hence
δ
N=−δ
P=−δ
. From (10),the value ofπ
P can beob-tainedas
π
P=1+
δ
2 . (12)
Moreover,thevalueof
π
N canbederivedfrom(11)π
N=1−
δ
2 . (13)
Therefore,themetrics
μ
=μ
(
λ
PP,λ
NN,π
P,π
N)
canberedefinedas
μ
=μ
(
λ
PP,λ
NN,δ
)
. It is clear that the value of the metricμ
dependsnot onlyonthe classifier’sperformance,butalso onthe imbalance
δ
.Itcan easily be derivedthat the relationshipbetweenthe im-balanceratio(IR)andtheimbalancecoefficient(
δ
)isIR=1+
δ
1−
δ
. (14)2.4. Assessingtheimpactofimbalance
Inordertoassesstheimpactoftheimbalanceinacertain met-ric,its value(
μ
b) forthebalanced case(whenδ
=0)isfirstcon-sidered.
μ
b≡μ
|
δ=0=μ
(
λ
PP,λ
NN,0)
=μ
b(
λ
PP,λ
NN)
. (15)This definition is later employed to propose a family of met-ricswherethe effectoftheimbalance isdismissed.Inthe scien-tificliterature,afewexamplesofthesemetricscanbefound,asin thecaseofClassBalance Accuracy(CBA)[35].Ongeneralizingthis approach, themetrics
μ
b are calledClass Balance Metrics (CBM).Table2summarizestheequationsforeachmetric,bothintheclass imbalanceandbalancecases.Theseresultsarederivedinthe sup-plementarymaterialofthepaper,availableonline.
Withthesedefinitions,itisnowpossibletoquantifytheimpact ofimbalance,byusingthe biasofthemetricwhichis definedas Bμ≡
μ
−μ
b=μ
(
λ
PP,λ
NN,δ
)
−μ
b(
λ
PP,λ
NN)
. (16)Table3summarizesthedefinitionofbiasforeachmetric.These results are derived in the supplementary material of the paper, availableonline.
As can be observed, bias depends on three variables: Bμ=
Bμ
(
λ
PP,λ
NN,δ
)
. In order to study this function, a 4-dimensionalspace is required. Its representations are first tackled using heat volumes(3D),whereeachpointinthe3-dimensional(
λ
PP,λ
NN,δ
)A.Luque,A.CarrascoandA.Martínetal./PatternRecognition91(2019)216–231 219
Fig.2. Heatmapsformetricswithbalancedclasses.
Table2
Classificationperformancemetricsasafunctionofimbalance.
Metrics Classimbalancemetricsμ(λPP,λNN,δ) ClassBalancemetricsμb(λPP,λNN)
SNS λPP λPP SPC λNN λNN PRC λPP( 1+δ) λPP( 1+δ)+( 1−λNN)( 1−δ) λPP λPP+( 1−λNN) NPV λNN( 1 −δ) λNN( 1 −δ)+( 1 −λPP)( 1+δ) λNN λNN+( 1 −λPP) ACC λPP1+2δ+λNN1 −2δ λPP+2λNN F1 ( 1+λPP)( 12+λδPP)+( 1( 1 +−δ) λNN)( 1 −δ) 2λPP 2+λPP−λNN GM λPP·λNN λPP·λNN MCCn 1 2 ( λPP+λNN−1 [ λPP+( 1 −λNN) 11−+δδ][ λNN+( 1 −λPP) 11+−δδ] +1) 1 2 (√ λPP+λNN−1 [ λPP+( 1 −λNN) ][ λNN+( 1 −λPP) ] +1) BMn λPP+λNN 2 λPP+λNN 2 MKn 1 2 ( 1+δ ( 1+δ)+1−λNN λPP ( 1 −δ) + 1 −δ ( 1 −δ)+1−λPP λNN ( 1+δ) ) 1 2 (1+11 −λNN λPP + 1 1+1−λPP λNN ) Table3
Biasofperformancemetricsduetoclassimbalance. Metrics BiasBμ(λPP,λNN,δ) SNS 0 SPC 0 PRC 1+δ ( 1+δ)+1−λNN λPP ( 1 −δ) − 1 1+1−λNN λPP NPV 1 −δ ( 1 −δ)+1−λPP λNN( 1+δ) − 1 1+1−λPP λNN ACC δ2 (λPP−λNN) F1 2 λPP( 1+δ) ( 1+λPP)( 1+δ)+( 1 −λNN)( 1 −δ) − 2 λPP 2+λPP−λNN GM 0 MCCn λPP+λNN−1 2 [λPP+( 1−λNN) 11−+δδ][λNN+( 1−λPP) 11+−δδ] − λPP+λNN−1 2√[λPP+( 1−λNN) ][λNN+( 1−λPP) ] BMn 0 MKn 1 2 ( 1+δ ( 1+δ)+1−λNN λPP ( 1 −δ) − 1 1+1−λNN λPP + 1 −δ ( 1 −δ)+1−λPP λNN( 1+δ) − 1 1+1−λPP λNN )
Alternatively, Bμ isalso representedasa setofheat maps(or contourgraphs).Eachheatmap(2D)representsthemetricbiasfor acertainfixedvalueoftheimbalance(letussay
δ
0 ),thereby mak-ing bias dependent on two variables (λ
PP,λ
NN) and on onecon-stant(
δ
0 ).Hence,Bμ=Bμ(
λ
PP,λ
NN,δ
0)
.Nevertheless, drawing conclusions regarding a 4-dimensional spaceis,inmostcases,achallengingtask.Severalpartialprospects are therefore proposed that reduce the bias function dimension-ality. In this respect, the first approach involves considering the
Table4
Biasindicatorsforsingularclassifiers.
Singularclassifier Symbol σBμ(δ)
Worstclassifier wcBμ(δ) lim
ε→0 Bμ(ε,ε,δ)
Bestclassifier bcBμ(δ) lim
ε→0 Bμ(1−ε,1−ε,δ)
Worst-positiveclassifier wpcBμ(δ) lim
ε→0Bμ(ε,1−ε,δ) Worst-negativeclassifier wncBμ(δ) lim
ε→0Bμ(1−ε,ε,δ) Mediumclassifier mcBμ(δ) Bμ(0.5,0.5,δ)
metricbiasforclassifierswhoseperformanceissingularlylocated onthe(
λ
PP,λ
NN)plane, therebyobtaining asetofbiasindicatorswhich are generically denoted as
σ
Bμ(δ
). The singularclassifiers andtheirformulationsareproposedinTable4.An alternative way to reduce the dimensionality of Bμ is throughtheconsiderationthat
λ
PPandλ
NNarerandomlyanduni-formlydistributed within the [0, 1] range. Bias can thereforebe seen for each value of the imbalance coefficient
δ
as a random variable Bμ(δ
), which is characterized by its probability density function (pdf[Bμ(δ
)]). Additionally, several local statistical indica-torscanbedefined,whicharegenericallydenotedasψ
Bμ(δ
).The termlocalattributedto theseindicators(summarized in Table5) meansthattheyaredefinedforeachvalueofδ
.DefinitionsinTables4and5haveintroducedseveralprospects ofbias,all ofwhichdepend onthe imbalance
δ
.Theyaregener-Table5
Localstatisticalindicatorsonbias.
Localstatisticalindicator Symbol ψBμ(δ)
Mean mBμ(δ) ∫∫Bμ(λPP,λNN,δ)dλPPdλNN
Standarddeviation sdBμ(δ)
[Bμ(λPP,λNN,δ)−mBμ(δ)]2 dλPPdλNN
Root-Mean-SquareBias rmsBμ(δ) B2 μ(λPP,λNN,δ)dλPPdλNN
Maximumabsolutevalue maxaBμ(δ) max 0≤λPP≤1 0≤λNN≤1 |Bμ(λPP,λNN,δ)| Skewness skBμ(δ) sdB1 3μ(δ) [Bμ(λPP,λNN,δ)−mBμ(δ)]3dλPPdλNN Kurtosis kBμ(δ) sdB1 4μ(δ) [Bμ(λPP,λNN,δ)−mBμ(δ)]4 dλPPdλNN Table6
Globalstatisticalindicatorsonbias.
Globalstatisticalindicator Symbol Bμ(δ)
Mean MBμ 1 2 Bμ(λPP,λNN,δ)dλPPdλNNdδ Standarddeviation SDBμ 1 2 [Bμ(λPP,λNN,δ)−MBμ]2 dλPPdλNNdδ Root-Mean-SquareBias RMSBμ 1 2 B2 μ(λPP,λNN,δ)dλPPdλNNdδ
Maximumabsolutevalue MAXABμ max 0≤λPP≤1 0≤λNN≤1 0≤δ≤1 |Bμ(λPP,λNN,δ)| Skewness SKBμ SDB13μ 1 2 [Bμ(λPP,λNN,δ)−MBμ]3dλPPdλNNdδ Kurtosis KBμ SDB1 4μ 1 2 [Bμ(λPP,λNN,δ)−MBμ(δ)]4dλPPdλNNdδ
ically denoted as xBμ
(
δ
)
={
σ
Bμ(
δ
)
,ψ
Bμ(
δ
)
}
. It should be ob-servedthatthesearenotnumbersbutfunctions.Inordertoobtain asinglevalue derivedfromthesefunctions, wecanmakethe hy-pothesisthatδ
israndomly anduniformlydistributed withinthe [−1,1]range.Meanvaluesofeachfunctioncanthereforebe com-putedasxBμ≡1
2 1
−1 xBμ
(
δ
)
dδ
. (17) Anotherwaytoreduce thegeneric functionxBμ(δ
)to asingle valueisbyfocusingonitsvalueforextremelypositive-imbalanced datasets whereδ
→1.A generic value can thereforebe obtained throughtheexpressionxBεP
μ ≡limε→0 xBμ
(
1−ε
)
. (18) ThecorrespondingnegativecounterpartisdefinedasxBεN
μ ≡εlim→0 xBμ
(
−1+ε
)
. (19) A globalregard ofbiascan alsobe undertakenby considering thatλ
PP andλ
NN are randomly anduniformlydistributed withinthe [0, 1] range, and also that
δ
lies within the [−1,1] range. Bias can now be seen asa random variableBμ that is indepen-dent of the imbalance coefficientδ
. Bias can therefore be char-acterized by its probability density function (pdf[Bμ]). Based on this overall pdf, several global statistical indicators can be de-fined,whichare genericallydenotedasBμ andare summarized inTable6.
DefinitionsinEqs.(17)–(19)andinTable6haveintroduced sev-eralsingle-valuedindicatorsregardingbias whichwillgenerically bedenotedasXBμ
(
δ
)
={
xBμ,xBεPμ,xBεN
μ ,
Bμ
(
δ
)
}
.Throughout thissubsection,severalfunctionandsingle-valued indicators have been introduced to assess the impact of dataset
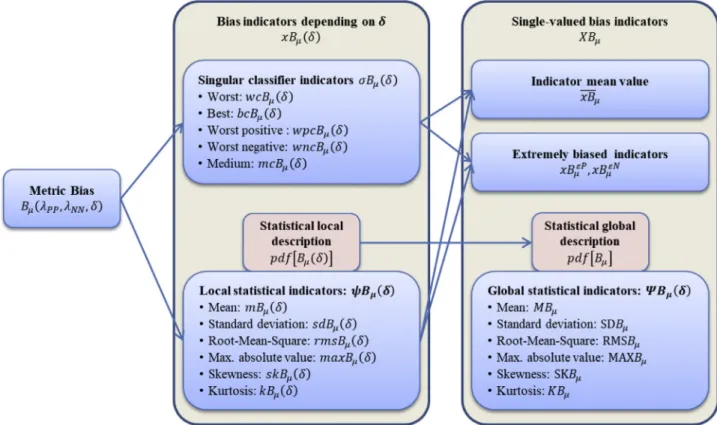
imbalance on classification performance metrics. A summary of theseindicatorsisdepictedinFig.3.
3. Results
3.1. Performancemetricbiasfunction
ThemethodsdescribedinSection2willnowbeappliedtothe tenmetrics definedin Table1. As explainedabove, biasdepends onthreevariables,thatis,Bμ=Bμ
(
λ
PP,λ
NN,δ
)
anditsformulationfortheselectedmetricsisalsoshowninTable3.Thefirstapproach fortheirrepresentationisbasedonthe heatvolumesasdepicted inFig.4,whereeachpointinthe3-dimensional(
λ
PP,λ
NN,δ
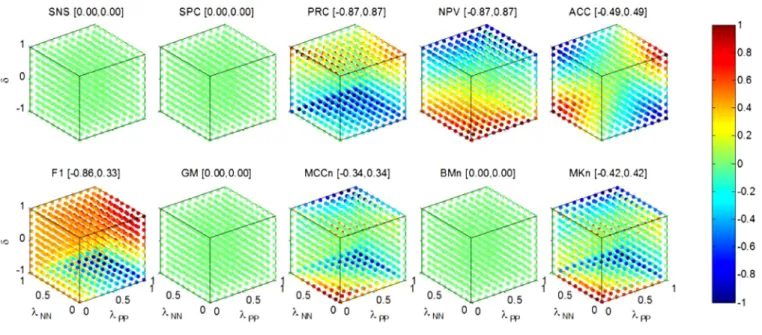
)spacehasabias-dependentcolour.
Incertainperformancemetrics(forinstanceinMCCn),biashas low values for many points in the (
λ
PP,λ
NN,δ
) space. In thesecases,the expressive power ofthe whole range ofcolours is not completelyexploited. It isthereforebetter toselectthe colourof each point not directly based on bias, but on the relative value of bias within the range of values for their corresponding met-ric. The colour-map is then rescaled to show the relative bias with the value −1 corresponding to the minimum bias, and the value+1tothemaximum.The resultisdepictedinFig.5,where the range of each metric is shown in its corresponding subplot title.
Asexplainedabove,Bμ canalsoberepresentedasasetofheat maps.Eachheatmaprepresentsthemetricbiasforacertainfixed valueoftheimbalanceBμ=Bμ
(
λ
PP,λ
NN,δ
0)
.Theresultfor preci-sion(PRC)isportrayedinFig.6.Similargraphics canbeobtained fortheremainingmetrics.Now let us suppose that the value of
δ
is known, for in-stanceδ
=δ
0 =0.95. ThereforeBμ=Bμ(
λ
PP,λ
NN,δ
0)
dependson onlytwovariables(λ
PPandλ
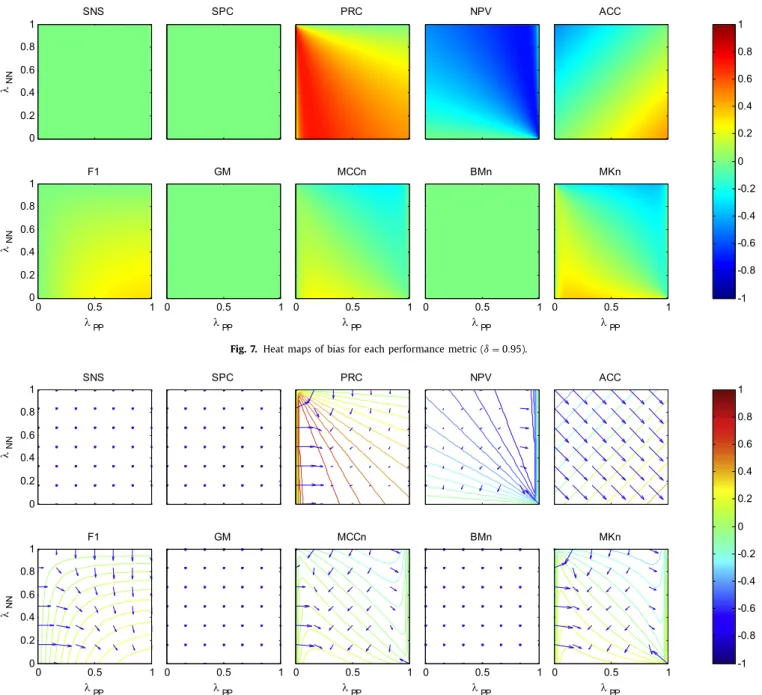
NN)andcanberepresentedasaheatmap. The resultsfor each metric are shownin Fig. 7 where the coloursrepresenttheabsolutevalueofbias.
A.Luque,A.CarrascoandA.Martínetal./PatternRecognition91(2019)216–231 221
Fig.3. Functionsandsingle-valuedindicatorsassessingbiasinperformancemetricsduetoclassimbalance.
Fig.4. Heatvolumesofbiasforeachperformancemetric.
Thisinformationcan alsobepresentedintheformofcontour graphsasinFig.8wherethecoloursrepresenttheabsolutevalue ofbias.
3.2. Biasindicatorsdependingon
δ
Inthe previoussection, severalbiasindicatorsdependingonly ontheimbalancecoefficient
δ
weredefined.Asmentionedtherein, the firstapproach isto consider classifierswhoseperformance is singularlylocatedonthe(λ
PP,λ
NN)plane.Theresultsobtainedforeach bias indicator and performance metric
σ
Bμ(δ
) are summa-rized in Table 7, whereunbiased performance metrics (SNS,SPC, GM,BMn)havebeenomitted.Table7
Biasindicatorsforsingularclassifiers:σBμ(δ).
PRC NPV ACC F1 MCCn MKn wcBμ 0 0 0 0 0 0 bcBμ 0 0 0 0 0 0 wpcBμ δ/2 −δ/2 −δ/2 0 0 0 wncBμ δ/2 −δ/2 δ/2 2( 1+δ) 3+δ −2 3 0 0 mcBμ δ/2 −δ/2 0 1+δ 2+δ−12 0 0
Itcan be observed that onlyfour typesof non-nullindicators appear.Theirdependenceon
δ
isplottedinFig.9.Alternatively,itcanbeassumedthat
λ
PPandλ
NNarerandomlyFig.5. Heatvolumesofrelativebiasforeachperformancemetric.
Fig.6. Setofheatmapsofbiasforprecision.
Bμ(
δ
) canthen be statisticallycharacterized.First, theprobability densityfunction(pdf[Bμ(δ
)])isderivedforeachperformance met-ric.The resultsare shownin Fig.10, where,foreachδ
andeach biasBμ,thevaluesofpdfare shownusingdifferentcolours(dark bluecorrespondstopdf=0).Additionally, several local statistical indicators have been de-fined(see Table5) and theseare generically denotedas
ψ
Bμ(δ
). Theresultsobtainedforeach performance metricare depictedin Fig.11.Foreasierreading,unbiasedperformancemetrics(SNS,SPC, GM,BMn) havebeen omitted.Moreover,NPV presents symmetric behaviourto PRC andhasalso beendisregarded fromthegraphs forthesakeofsimplicity.3.3. Single-valuedbiasindicators
Ashasalreadybeenpointedout,therearevariouswaysto ob-tainsingle-valuedbiasindicators.First,weconsiderbiasfunctions
σ
Bμ(δ
)assummarizedinTable7.Byassumingthatδ
israndomly anduniformlydistributedwithin the[−1,1] range,themean val-uesofeachmeasurecanbecomputed.Theresultsforeach perfor-mancemetricareshowninTable8.Now letusconsiderbiasfunctions
ψ
Bμ(δ
) depictedinFig.11. By applying the same method, mean values of these measures can also be obtained. Results for each metric are shown in Table9.A.Luque,A.CarrascoandA.Martínetal./PatternRecognition91(2019)216–231 223
Fig.7. Heatmapsofbiasforeachperformancemetric(δ=0.95).
Fig.8. Contourgraphsofbiasforeachperformancemetric(δ=0.95).
Table8
MeanvaluesofbiasfunctionsforsingularclassifiersσBμ(δ).
Symbol PRC NPV ACC F1 MCCn MKn 1 wcBμ 0 0 0 0 0 0 2 bcBμ 0 0 0 0 0 0 3 wpcBμ 0 0 0 0 0 0 4 wncBμ 0 0 0 −0.053 0 0 5 mcBμ 0 0 0 −0.049 0 0 Table9
MeanvaluesofbiasoflocalstatisticalindicatorsψBμ(δ).
Symbol PRC NPV ACC F1 MCCn MKn 6 mBμ 0 0 0 −0.041 0 0 7 sdBμ 0.082 0.082 0.102 0.066 0.038 0.066 8 rmsBμ 0.228 0.228 0.102 0.135 0.038 0.066 9 maxaBμ 0.308 0.308 0.25 0.244 0.090 0.154 10 skBμ 0 0 0 0.129 0 0 11 kBμ 0.080 0.080 −0.6 −1.093 0.006 0.028
Insteadofcomputingthemeanofafunction,single-valuedbias indicatorscanalsobeobtainedby focusingontheir valuefor ex-tremelyimbalanceddatasets.Byfirstconsideringthebiasmetrics ofsingularclassifiers(
σ
Bμ(δ
)),theirresultsareshowninTable10. Regardingtheextremelyimbalancedcaseforlocalstatistical in-dicators(ψ
Bμ(δ
)),theirresultsareshowninTable11.For a global view of bias, let us consider that
λ
PP andλ
NN are randomly and uniformly distributed across the [0, 1]range while
δ
lies within the [−1,1] range, and then bias Bμ is statistically characterized. First, the probability density func-tion (pdf(Bμ)) is derived for each performance metric. The re-sultsareshowninFig.12,whereNPV hasbeenomittedfromthe graphbecause itshowssymmetric behaviour toPRC andhas the samepdf.Finally, several global statistical indicators based on pdf(Bμ) havebeendefined(seeTable6),whicharegenericallydenotedas
Bμ.Theresultsobtainedforeachperformancemetricareshown inTable12.
Table10
Biasindicatorsonsingularclassifiers(σBμ(δ))forextremelyimbalanceddatasets.
Symbol PRC NPV ACC F1 MCCn MKn Extremely positive-imbalanced 12 wcBεP μ 0.667 0 0 0 0.211 0.333 13 bcBεP μ 0 −0.667 0 0 −0.211 −0.333 14 wpcBεP μ 0.5 −0.5 −0.5 0 0 0 15 wncBεP μ 0.5 −0.5 0.5 0.333 0 0 16 mcBεP μ 0.5 −0.5 0 0.167 0 0 Extremely negative-imbalanced 17 wcBεN μ 0 0.667 0 0 −0.211 0.333 18 bcBεN μ −0.667 0 0 −0.5 0.211 −0.333 19 wpcBεN μ −0.5 0.5 0.5 0 0 0 20 wncBεN μ −0.5 0.5 −0.5 −0.667 0 0 21 mcBεN μ −0.5 0.5 0 −0.5 0 0 Table11
Biasmeasuresonlocalstatisticalindicators(ψBμ(δ))forextremelyimbalanceddatasets.
Symbol PRC NPV ACC F1 MCCn MKn Extremely positive-imbalanced 22 mBεP μ 0.5 −0.5 0 0.137 0 0 23 sdBεP μ 0.238 0.238 0.204 0.088 0.213 0.226 24 rmsBεP μ 0.554 0.554 0.204 0.163 0.213 0.226 25 maxaBεP μ 1 1 0.5 0.333 0.5 0.5 26 skBεP μ 0 0 0 0.244 0 0 27 kBεP μ −0.651 −0.651 −0.6 −1.043 −0.790 −1.014 Extremely negative-imbalanced 28 mBεN μ −0.5 0.5 0 −0.477 0 0 29 sdBεN μ 0.238 0.238 0.204 0.241 0.213 0.226 30 rmsBεN μ 0.554 0.554 0.204 0.534 0.213 0.226 31 maxaBεN μ 1 1 0.5 1 0.5 0.5 32 skBεN μ 0 0 0 0.168 0 0 33 kBεN μ −0.651 −0.651 −0.6 −0.933 −0.790 −1.014
Fig.9. Fourtypesofbiasindicatorsforsingularclassifiers.
Table12
GlobalstatisticalindicatorsofbiasBμforeachperformancemetric.
Symbol PRC NPV ACC F1 MCCn MKn 34 MBμ 0 0 0 −0.041 0 0 35 SDBμ 0.271 0.271 0.118 0.169 0.055 0.086 36 RMSBμ 0.271 0.271 0.118 0.174 0.055 0.086 37 MAXABμ 1 1 0.5 1 0.5 0.5 38 SKBμ 0 0 0 −1.269 0 0 39 KBμ −0.046 −0.046 1.32 2.043 6.9 3.061
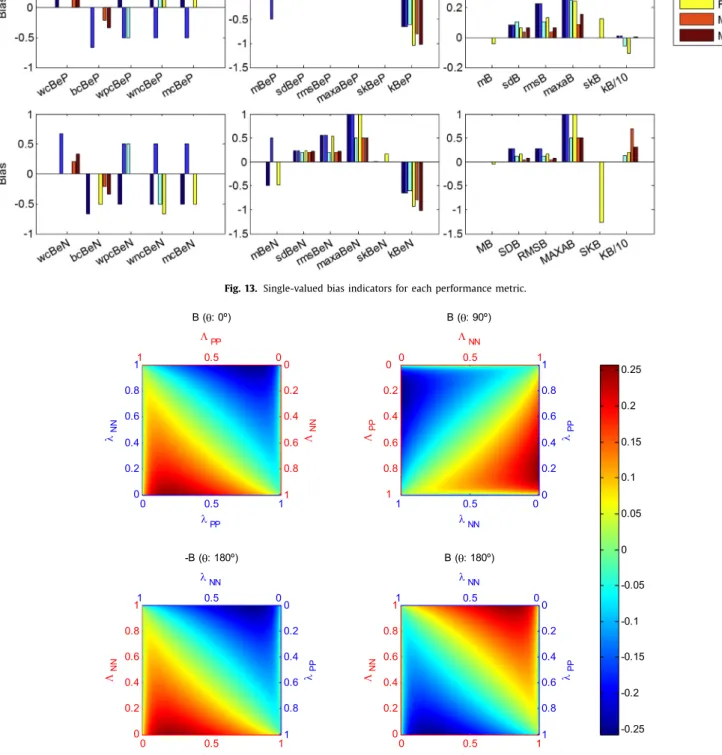
Inthissection,39single-valuedbiasindicatorshavebeen con-sidered, which can also be presented in a graphical form, as shown in Fig. 13. Here, the bias indicators
σ
Bμ(
δ
)
, detailed in Table 8, have been omitted, since all these indicators are null (except for F1 score) and therefore their comparison would be meaningless.3.4. Symmetryofbiasfunctions
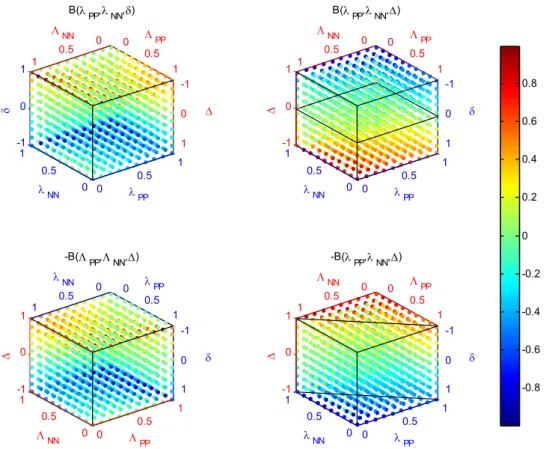
Inorderto categorizethe biasfunctionsforeachperformance metric, it is convenient to study their symmetry. For this pur-pose, let us begin by considering the Matthews Correlation Co-efficient(MCC), since thiscoefficient is particularlyclear. Its heat map foran imbalancecoefficient
δ
=0.95 isshownin theupper left-hand-side plot of Fig. 14. A first anti-clockwise 90° rotation on the(λ
PP,λ
NN) plane is performed, andtheresult isshownintheupperright-hand-sideplot.Theresultofasecond90ºrotation is shown inthe lower right-hand-sidegraph. Finally, the signof the bias valuesis changed,as shownin thelower left-hand-side plot.Itcanbeobservedthattheresultcoincides withtheoriginal heatmap.
The180ºrotation enablesthebiasto bedefinedon anewset of axes (
PP,
NN), which are related to the original (
λ
PP,λ
NN)throughtheexpressions
PP=1−
λ
PP;NN=1−
λ
NN.Thissym-metrycanthereforebeformalizedas BMCC
(
λ
PP,λ
NN,δ
)
=−BMCC(
PP,
NN,
δ
)
=−BMCC
(
1−λ
PP,1−λ
NN,δ
)
. (20)Hence, the MCC bias function shows an order-2 (180º) rota-tionalodd symmetry(or anti-symmetry)on the(
λ
PP,λ
NN) plane.Furthermore, thisbias function shows symmetry with respect to the principal diagonalon the (
λ
PP,λ
NN) plane ifthe signofδ
isinverted,thatis,
BMCC
(
λ
NN,λ
PP,−δ
)
=BMCC(
λ
PP,λ
NN,δ
)
. (21)This dualbehaviour iscalled TypeI symmetry. Bias functions forACCandMKalsoexhibitthistypeofsymmetry.
When the bias of precision (PRC) is considered, no symmetry onthe(
λ
PP,λ
NN) planecanbefound.However, itexhibitsasym-metry in the (
λ
PP,λ
NN,δ
) space as can be observed in Fig. 15where its heat volume for an imbalance coefficient
δ
=0.95 is shown in the upper left-hand-side plot. First, a mirror symme-try,withrespecttotheδ
=0plane,isperformedandtheresultisA.Luque,A.CarrascoandA.Martínetal./PatternRecognition91(2019)216–231 225
Fig.10. Probabilitydensityfunctionpdf[Bμ(δ)]foreachperformancemetric.
Fig.11. LocalstatisticalindicatorsofbiasψBμ(δ)foreachperformancemetric.
Fig.12. Probabilitydensityfunctionpdf(Bμ)foreachperformancemetric.
shownintheupperright-hand-sideplot.Thesignofthebias val-uesisthenchangedandtheresultsareshowninthelower
right-hand-side plot. Finally, a second mirror symmetry is performed, this time with respect to the anti-diagonal plane drawn in the thirdplot.Theresultisshowninthelowerleft-hand-side plot.It can be observed that the result coincides with the original heat volume.
The double mirror symmetry enables the bias to be defined on a new set of axes (
PP,
NN,
), which are related to the
original set (
λ
PP,λ
NN,δ
) through the expressionsPP=1−
λ
NN;NN=1−
λ
PP;=−
δ
. This symmetry can hence be formalizedas
BPRC
(
λ
PP,λ
NN,δ
)
=−BPRC(
PP,
NN,
)
=−BPRC
(
1−λ
NN,1−λ
PP,−δ
)
. (22)Therefore, the PRC bias function shows a double mirror odd symmetry(or anti-symmetry)inthe (
λ
PP,λ
NN,δ
)space.Thisbe-haviouriscalledTypeIIsymmetry. Biasfunctionsforeach metric (exceptF1 score)exhibitthistypeofsymmetry.
Additionally, the symmetry of each pdf can be measured throughtheskewnessstatistics.
Fig.13. Single-valuedbiasindicatorsforeachperformancemetric.
Fig.14. StudyofsymmetryforBMCC(λNN,λPP)withδ=0.95.
3.5.Clusteringperformancemetricsbasedontheirbias
Inprevious sections,theimpactofimbalanceonten classifica-tionperformancemetrics isstudied.Based ontheir bias,the per-formancemetrics cannowbegroupedintoseveralclusters.In or-dertoperformthisclustering,the39single-valuedbiasindicators areconsidered.Thatis,eachperformancemetricistobefeatured byapointinanR39 space.
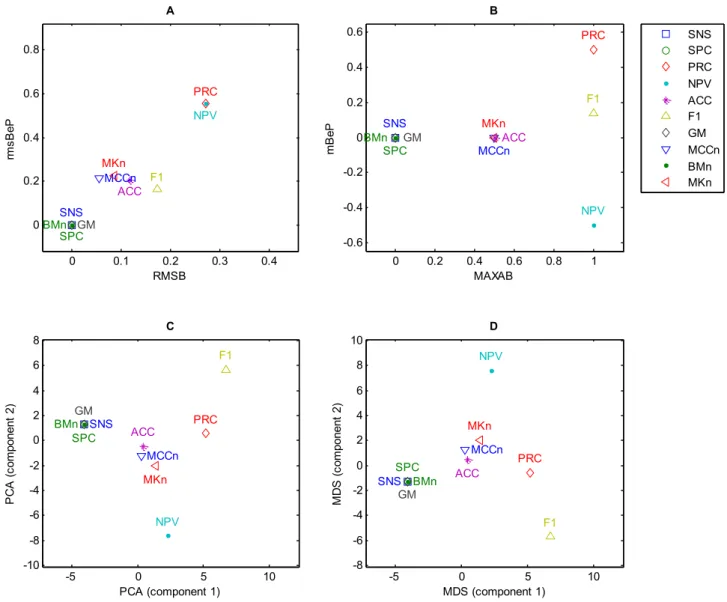
Totackletheissueofhowtovisualizesuchahigh-dimensional vector, a reduction of dimensionality to a plane (2D) must be
undertaken. The first approach (Fig. 16-A) involves the selection of 2 highly significant bias indicators and the projection of the points on that plane. Our selection is of RMSBμ, which is an indicator of the mean global bias, and of rmsBεP
μ, which is a mean gauge of bias for extremely positive-imbalanced datasets. In this graphic, it can be observed that: bias for SNS, SPC, GM and BMn performance metrics are at the same point; bias for ACC, MCCn and MKn are very close to each other; bias for F1 is not far from these metrics; and, finally, bias for PRC and NPV are at the same point but distant from the other metrics.
A.Luque,A.CarrascoandA.Martínetal./PatternRecognition91(2019)216–231 227
Fig.15. StudyofsymmetryforBPRC(λNN,λPP,δ)withδ=0.95.
Following these criteria, either 3 or 4 clusters could be esta-blished.
However, a more in-depth insight shows that PRC and NPV havesymmetricbehaviourformanybiasindicators.Theyhave ap-peared together inthe previous graph becausethe selected indi-cators(RMSBμ andrmsBεP
μ)computeasquaredmean,whichhides theirsymmetriccharacteristics.Inordertoovercomethisissue,the dimensionalityreductioncanbemadebyselectingadifferentpair ofbias indicators.InFig. 16-B,MAXABisa globalindicatorofthe absolute maximum value of bias (and still hides the symmetry), and mBεP
μis another mean gauge of bias for extremely positive-imbalanceddatasets thatrevealsthesymmetry. Fiveclustersnow clearlyappear.
An alternative to theprevious somewhat arbitraryand reduc-tionist selection of the pair of bias indicators involves the con-sideration of the full set of indicators and the performance of some kindofbidimensionalreduction.PrincipalComponent Anal-ysis(PCA),showninFig.16-C[26],andMulti-dimensionalScaling (MDS),showninFig.16-D[7],areemployedasthetechniquesfor thisreduction.
Each panel on Fig. 16 represents a different bidimensional perspective of highly dimensional (R39 ) set of points. Therefore, slightlydifferentclusteringmayarise inanyofthem.But consid-ering all the panels,it can be seen that the following 5 clusters appear:
I. ClustercomprisedofSNS,SPC,GMandBMnwithmetricshaving nullbias.
II. Cluster comprised of ACC, MCCn andMKn with the following features:
• Bias has Type I symmetry, that is, Bμ
(
λ
PP,λ
NN,δ
)
= −Bμ(
1−λ
PP,1−λ
NN,δ
)
and Bμ(
λ
NN,λ
PP,−δ
)
=Bμ(
λ
PP,λ
NN,δ
)
.• Biaspdfhasnullskewness.
• Bias values are moderate: 0.5 for maximum (MAXABμ, maxaBεP
μ and maxaBεμN); and about 0.2 foraverage bias in extremelyimbalanceddatasets(rmsBεP
μ andrmsBεN
μ). • Signofbiasdoesnotdependonsignofimbalance. III. Cluster(with2subclusters)comprisedofPRCandNPVwiththe
followingfeatures:
• Bias has Type II symmetry, that is, Bμ
(
λ
PP,λ
NN,δ
)
= −Bμ(
1−λ
NN,1−λ
PP,−δ
)
.• Biaspdfhasnullskewness.
• Biasvaluesarehigh:1formaximum(MAXABμ,maxaBεP
μ and maxaBεN
μ );andabout0.5foraverage biasinextremely im-balanceddatasets(rmsBεP
μ andrmsBεμN).
• The relationship betweenthe sign of bias andthe sign of imbalanceestablishes2subclusters.
A. PRC,withbiasandimbalancehavingthesamesign. B. NPV,withbiasandimbalancehavingtheoppositesign. IV. ClustercomprisedbyF1 withthefollowingfeatures:
• Biashasnosymmetry.
• Biaspdfhasnon-nullskewness.
• Bias values are low forpositive imbalance: 0.33 for maxi-mum(maxaBεP
μ);andapproximately0.15foraveragebiasin extremelyimbalanceddatasets(rmsBεP
μ).
• Biasvaluesarehighfornegativeimbalance:1formaximum (maxaBεN
μ); and approximately 0.5 for average bias in ex-tremelyimbalanceddatasets(rmsBεN
μ ).
• Signofbiasandsignofimbalancearethesame.
ClusteringinformationissummarizedinTable13.
Another way to represent how performance metrics are groupedaccordingtothebias behaviour isbydrawing a dendro-gram.Tothisend,thefullsetofbiasindicatorsisemployedto fea-tureeachperformance metric.Thedistancesbetweenthemetrics arethen computedinthe spaceoftheR39 bias indicators.These
Fig.16. Bidimensionalrepresentationofperformancemetricsaccordingtotheirbiasindicators.
Table13
Clustersofperformancemetricsattendingtotheirbias.
I II III.A III.B IV
SNSSPCGMBM ACCMCCMK PRC NPV F1
δ>0 maxaBεP
μ Null 0 Medium 0.5 High 1 High 1 Low 0.333
rmsBεP
μ 0 ∼0.2 0.554 0.554 0.163
δ<0 maxaBεN
μ 0 0.5 1 1 High 1
rmsBεμN 0 ∼0.2 0.554 0.554 0.534
Symmetry TypeI Yes Yes Yes Yes No
TypeII Yes Yes No No No
Skewness 0 0 0 0 =0
sgn(B)vs.sgn(δ) = Independent = = =
distancesareemployedtogaugehowseparatedthemetricsare,as showninFig.17.Onceagain,5clustersclearlyappear.
4. Discussion
The first issuetobe discussed isthecomparisonbetweenthe imbalanceratio(IR),definedbyseveralauthorstoquantify imbal-ance,andtheimbalancecoefficient (
δ
)asproposed inthispaper. Althoughtheyarebothvalidindicatorsofthedegreetowhichthe datasetsareimbalanced,we preferδ
becauseitisdefinedwithin the[−1,+1]boundedrangewiththebalancedcase(δ
=0)inthe middleof the segment (and hence it is symmetric); whilst IR isdefined within the [0,+∞] unbounded range with the balanced caseIR=1,which isclearlyasymmetric.In orderto obtain sym-metric behaviour basedon IR,the logarithm of IRcould be used (LIR), whoserange is[−∞,+∞] withthe balanced case(LIR=0) inthemiddle;however,itsrangestillremainsunbounded.Fig.18 showsanexampleofa localstatisticalindicatorofbias (rmsB) as afunctionoftheimbalanceusing
δ
(left-hand-side)andIRin log-arithmicscale(right-hand-side).A practical application of the above results is that the bias’s meanvalue ofeveryperformancemetric(andother related statis-tics) can be computed using the equations in Table 6, and their resultsforthetenstudiedmetricsareshowninTable12.
A.Luque,A.CarrascoandA.Martínetal./PatternRecognition91(2019)216–231 229
Fig.17. Dendrogramofperformancemetricsaccordingtotheirbiasmeasures.
Inthe caseswherethedataset isknown,theexpectedbiasof every performance metric can be computed. Indeed, the dataset determine the value of the imbalance coefficient
δ
and, for that value, thebias(itsroot-mean-squarevalue)can beobtainedasit isshowninFig.18.Thefullsetofbias’sstatisticscanbecomputed using the equations in Table 5 and their results are depicted in Fig.11.Additionally if the classifier results on that dataset are also known (thatis,the valuesof
λ
PP andλ
NN) the bias’sexact valueofeveryperformancemetriccanbecomputedusingtheequations inTable3.
Letusnowfocusonthebiasfunctions.Fromtheaboveresults it is clear that the best performance metrics, that is, those with nobiasduetoimbalance,arethoseofsensitivity(SNS)and speci-ficity(SPC). Thesemetrics canbe consideredone-dimensional (or partial)performancemetricshowever,sincetheytakeintoaccount onlythe resultsoneitherthepositive(SNS) orthe negative(SPC) class,butnotboth.
Null biasis alsoshown by two metrics directlydependingon SNSandSPC: geometricmean(GM) andbookmakerinformedness (BMorsingle-thresholdAUC). Thesesolve theone-dimensionality
Table14
Behaviourofperformancemetricswithimbalanceddatasets.
Cluster Metric Bias RMSBμ Focusonclasses Focusonresults (Positive,Negative) (Successes,Errors)
I SNS Null 0 P S
SPC Null 0 N S
GM Null 0 P&N S
BM Null 0 P&N S
II ACC Medium 0.118 P&N S
MCC Medium 0.055 P&N S&E
MK Medium 0.086 P&N S&E III PRC High 0.271 P&N S&E
NPV High 0.271 P&N S&E
IV F1 High 0.174 P&N S&E
problem of the SNS and SPC metrics by considering either their arithmetic (BM) or geometric (GM) mean. Although these two metrics constitute good alternatives to be used with imbalanced datasets, they have the drawback of focusing on only the classi-fication successes(
λ
PP andλ
NN), andfail to directlyconsider theclassificationerrors(
λ
PN andλ
NP).The second best (lowest biased) cluster of metrics is that which is comprised of accuracy (ACC), Matthews correlation co-efficient (MCC), and markedness (MK). These all have a global (notpartial) perspective, since classification results on both pos-itive and negative classes are considered. From among these 3 metrics,ACCfocusesonly ontheclassificationsuccesses, whichis a drawback and, additionally, has the highest bias (except when extreme balanced datasets are used). In this cluster, the lowest bias is shown by MCC with moderate values (lower than 0.2 in the normalizedversion) for almost every value of the imbalance coefficient.
Finally,the metrics in the third andfourth clusters, precision (PRC),negativepredictivevalue(NPV),andF1 score(F1),arehighly biased and should be avoided for use in imbalanced datasets. Table 14summarizes the behaviour of performance metrics with imbalanceddatasets.
As a practical conclusion, when dealing with imbalanced datasets,GMandBMarethebestperformancemetricsiftheir fo-cusonsuccesses(dismissingtheerrors) presentsnolimitationfor thespecific applicationwhere theyare used. However,if classifi-cationerrorsmustalsobeconsidered,thenMCCarisesasthebest choice.
Concordant results have been obtained in other studies, al-though mostof theseprevious resultswere only shown andnot exhaustivelyexplored andquantified.Theweakness ofACCin im-balanced problems has been signalled by many authors [10,22]. Furthermore, the use of PRC has been extensively discouraged [5,13,20]. F1 score,which dependson PRC, is also indirectly dis-missedbythoseauthors anddirectlyrejectedby Jeni,Cohn & De LaTorre[25].Mostofthe literature onthisissuedoesnot select anyperformance metrics, thereby limiting their study to a mere indicationthattheyarebiased.Afewauthorsalsosuggestthatthe bestchoiceistheMCCmetric[4,11].
Probably themostcitedsolutiontoovercometheeffectof im-balanceon performance metrics is the useof theClass Balanced Accuracy(CBA).Intheterminologyusedthroughoutthispaper,this isthe accuracy forthe classifier operating on abalanced dataset (ACCb). Nevertheless,accordingto ourstudy, thisideacan be
ex-tended to theremaining performance metrics, by obtaining their balanced counterpart (
μ
b), generallycalledClass Balance Metrics(CBM), asformulated in thelast column ofTable2. These exten-sionspermitdifferentnull-biasperspectivesto beusedinthe as-sessmentoftheresultsobtainedby aclassifierintheimbalanced case.
The ClassBalance version oftheten studiedmetrics (
μ
b) will showanullbiasand,therefore,a valueofRMSBμ=0(columns 3 and4inTable14).Aseverymetricisnowunbiased,choosingany ofthem should be based on other criteria, for instance,on their symmetry (column1), their focuson classes (column5) ortheir focusonresults(lastcolumn).Thesevaluesremainunalteredwith respecttotheirbiasedcounterpart.The behaviour of each Class Balance Metric is shown in Fig.2which canalso be usedasa guideforthe selectionof the metric.
5. Conclusions
In thispaper,an extensiveandsystematicstudyoftheimpact ofclass imbalanceonclassification performancemetrics is under-taken.Tothebestofourknowledge,noquantitativeandcomplete studyofthisissuehasbeenpreviouslypublished.
TocharacterizethedisparitybetweenclassestheImbalance Co-efficienthasbeendefined:anewmeasurewhichsurpassesthe Im-balanceRatioortheEntropyusedinpreviousstudies.
Throughout our analysisseveralpractical procedures to deter-minethe bias’squantitative value ofa metric havebeenderived, eitherforageneralcase,foracertaindatasetorforagiven exper-iment(pairofclassifieranddataset).
From the simulation results,a quantitativelyjustified guideto selectperformance metrics in the presence of imbalance classes has been developed. In our analysis, several clusters of perfor-mancemetrics havebeen identified that involvethe use of Geo-metricMean orBookmaker Informedness asthe bestnull-biased metricsiftheirfocusonclassificationsuccesses(dismissingthe er-rors)presentnolimitationforthespecific applicationwherethey are used. However, if classification errors must also be consid-ered,thenthe MatthewsCorrelationCoefficientarisesasthebest choice.
Finally, a set of null-biased multi-perspective Class Balance Metrics is proposed which extends the concept of Class Balance Accuracytootherperformancemetrics.
Supplementarymaterial
Supplementary material associated with this article can be found,intheonlineversion,atdoi:10.1016/j.patcog.2019.02.023.
References
[1]A.Amin,S.Anwar,A.Adnan,M.Nawaz,N.Howard,J.Qadir,...A.Hussain, Comparingoversamplingtechniquestohandletheclassimbalanceproblem:a customerchurnpredictioncasestudy,IEEEAccess4(2016)7940–7957. [2]G.E.Batista,R.C.Prati,M.C.Monard,Astudyofthebehaviorofseveralmethods
forbalancingmachinelearningtrainingdata,ACMSIGKDDExplor.Newslett.6 (1)(2004)20–29.
[3]C.Beyan,R.Fisher,Classifyingimbalanceddatasetsusingsimilaritybased hi-erarchicaldecomposition,PatternRecognit.48(5)(2015)1653–1672. [4]S. Boughorbel, F. Jarray, M. El-Anbari, Optimal classifier for imbalanced
data usingMatthewsCorrelationCoefficient metric,PloSOne12(6)(2017) e0177678.
[5]P.Branco,L.Torgo,R.P.Ribeiro,Relevance-basedevaluationmetricsformulti– classimbalanceddomains,in:Pacific-AsiaConferenceonKnowledgeDiscovery andDataMining,Cham,Springer,2017,May,pp.698–710.
[6]K.H.Brodersen,C.S.Ong,K.E.Stephan,J.M.Buhmann,Thebalancedaccuracy anditsposteriordistribution,in:PatternRecognition(ICPR),201020th Inter-nationalConferenceon,IEEE,2010,August,pp.3121–3124.
[7]R.Caruana,A.Niculescu-Mizil,Datamininginmetricspace:anempirical anal-ysisofsupervisedlearningperformancecriteria,in:ProceedingsoftheTenth ACMSIGKDDInternationalConferenceonKnowledgeDiscoveryandData Min-ing,ACM,2004,August,pp.69–78.
[8]F.Charte,A.J.Rivera,M.J.delJesus,F.Herrera,Addressingimbalancein multi-labelclassification:measuresandrandomresamplingalgorithms, Neurocom-puting163(2015)3–16.
[9]N.V.Chawla,K.W.Bowyer,L.O.Hall,W.P.Kegelmeyer,SMOTE:synthetic mi-norityover-samplingtechnique,J.Artif.Intell.Res.16(2002)321–357. [10]N.V.Chawla,Dataminingforimbalanceddatasets:AnOverview,in:Data
Min-ingandKnowledgeDiscoveryHandbook,SpringerUS,2005,pp.853–867. [11]D.Chicco,Tenquicktipsformachinelearningincomputationalbiology,
Bio-DataMin.10(1)(2017)35.
[12] R.A.Dara,M.S.Kamel,N.Wanas,Datadependencyinmultipleclassifier sys-tems,PatternRecognit.42(7)(2009)1260–1273.
[13]S.Daskalaki,I.Kopanas,N.Avouris,Evaluationofclassifiersforanunevenclass distributionproblem,Appl.Artif.Intell.20(5)(2006)381–417.
[14]C.Ferri,J.Hernández-Orallo,R.Modroiu,Anexperimentalcomparisonof per-formance measures for classification, Pattern Recognit. Lett. 30 (1)(2009) 27–38.
[15]A.Fernández,S.delRío,N.V.Chawla,F.Herrera,Aninsightintoimbalanced BigDataclassification:outcomesand challenges,ComplexIntell.Syst.3(2) (2017)105–120.
[16]P.A.Flach,ThegeometryofROCspace:understandingmachinelearning met-ricsthroughROCisometrics,in:Proceedingsofthe20thInternational Confer-enceonMachineLearning(ICML-03),2003,pp.194–201.
[17]V. Ganganwar, An overview of classification algorithms for imbalanced datasets,Int.J.Emerg.Technol.Adv.Eng.2(4)(2012)42–47.
[18]V.García,R.A.Mollineda,J.S.Sánchez,Indexofbalancedaccuracy:a perfor-mancemeasureforskewedclassdistributions,in:IberianConferenceon Pat-ternRecognitionandImageAnalysis,Berlin,Heidelberg,Springer,2009,June, pp.441–448.
[19]J.Gorodkin,ComparingtwoK-categoryassignmentsbyaK-category correla-tioncoefficient,Comput.Biol.Chem.28(5–6)(2004)367–374.
[20]Q.Gu,L.Zhu,Z.Cai,Evaluationmeasuresoftheclassificationperformanceof imbalanceddatasets,in:InternationalSymposiumonIntelligence Computa-tionandApplications,Berlin,Heidelberg,Springer,2009,October,pp.461–471. [21]H. He,E.A. Garcia, Learningfromimbalanced data,IEEETrans.Knowl. Data
Eng.21(9)(2009)1263–1284.
[22]M.Hossin,M.N.Sulaiman,Areviewonevaluationmetricsfordata classifica-tionevaluations,Int.J.DataMin.Knowl.Manage.Process5(2)(2015)1. [23]T.Kautz,B.M.Eskofier,C.F.Pasluosta,Genericperformancemeasurefor
multi-class-classifiers,PatternRecognit.68(2017)111–125.
[24]B.Krawczyk,Learningfromimbalanceddata:openchallengesandfuture di-rections,Prog.Artif.Intell.5(4)(2016)221–232.
[25]L.A.Jeni,J.F.Cohn,F.DeLaTorre,Facingimbalanceddata–recommendations fortheuseofperformancemetrics,in:AffectiveComputingandIntelligent In-teraction(ACII),2013HumaineAssociationConference,IEEE,2013,September, pp.245–251.
[26]I.Jolliffe,Principalcomponentanalysis,in:InternationalEncyclopediaof Sta-tisticalScience,Springer,Berlin,Heidelberg,2011,pp.1094–1096.
[27]G.Jurman,S.Riccadonna,C.Furlanello,AcomparisonofMCCandCENerror measuresinmulti-classprediction,PLoSOne7(8)(2012)e41882.
[28]M.S. Kraiem, M.N. Moreno, Effectiveness of basic and advanced sampling strategiesontheclassificationofimbalanceddata.acomparativestudyusing classicaland novelmetrics,in:International ConferenceonHybridArtificial IntelligenceSystems,Cham,Springer,2017,June,pp.233–245.
[29]V.López,A.Fernández,S.García,V.Palade,F.Herrera,Aninsightinto classi-ficationwithimbalanceddata:empiricalresultsandcurrenttrendsonusing dataintrinsiccharacteristics,Inf.Sci.250(2013)113–141.
[30]B.W.Matthews,Comparisonofthepredictedand observedsecondary struc-tureofT4phagelysozyme,BiochimicaetBiophysicaActa(BBA)405(2)(1975) 442–451.
[31]N.Mehra,S.Gupta,Surveyonmulticlassclassificationmethods,Int.J.Comput. Sci.Inf.Technol.4(4)(2013)572–576.
[32]L.Mosley,ABalancedApproachtotheMulti-ClassImbalanceProblem,Iowa StateUniversity,2013.
A.Luque,A.CarrascoandA.Martínetal./PatternRecognition91(2019)216–231 231 [33]H. Núñez,L.Gonzalez-Abril,C.Angulo,ImprovingSVMclassificationon
im-balanced datasets byintroducing anewbias,J. Classification34(3)(2017) 427–443.
[34]D.M. Powers, Evaluation:from precision,Recalland F-Measureto ROC, In-formedness,MarkednessandCorrelation,SchoolofInformaticsand Engineer-ing,FlindersUniversity,Adelaide,Australia,2011TechnicalReportSIE-07-001. [35]B.Raman,T.R.Ioerger,EnhancingLearningUsingFeatureandExample
Selec-tion,TexasA&MUniversity,CollegeStation,TX,USA,2003.
[36]M.Sokolova,N.Japkowicz,S.Szpakowicz,Beyondaccuracy,F-scoreandROC: afamilyofdiscriminantmeasuresforperformanceevaluation,in:Australasian JointConferenceonArtificialIntelligence,Berlin,Heidelberg,Springer,2006, December,pp.1015–1021.
[37]M.Sokolova,G.Lapalme,Asystematicanalysisofperformancemeasuresfor classificationtasks,Inf.Process.Manage.45(4)(2009)427–437.
[38]S.V.Stehman, Selectingandinterpretingmeasuresofthematicclassification accuracy,RemoteSens.Environ.62(1)(1997)77–89.
[39]Y.Sun,M.S.Kamel,A.K.Wong,Y.Wang,Cost-sensitiveboostingfor classifica-tionofimbalanceddata,PatternRecognit.40(12)(2007)3358–3378. [40]X.Yuan,L.Xie,M.Abouelenien,Aregularizedensembleframeworkofdeep
learningforcancerdetectionfrommulti-class,imbalancedtrainingdata, Pat-ternRecognit.77(2018)160–172.
[41]W.Zong,G.B.Huang,Y.Chen,Weightedextremelearningmachinefor imbal-ancelearning,Neurocomputing101(2013)229–242.
AmaliaLuquereceivedherIndustrialEngineeringdegreein2007,Master in Au-tomationin2010andherDoctoralDegreein2014.Shehasbeeninvolvedin teach-ingrelatedtoProjectEngineeringattheUniversityofSevillesince2015.Hermain areasofresearcharebusinessintelligence,dataminingandfeatureextraction.
Alejandro Carrascoreceivedhis ComputerEngineering degreein 1998and his Ph.D.in2003.HeisaLecturerand ResearcherattheUniversityofSevillesince 1998,hasfoundedaNTBFanddirectedseveralR&Dprojects.Hismainareasof re-searcharedatamining,industrialcomputingandnetworksecurity.
AlejandroM.Martín-Gómez,B.IndustrialElectronicsandAutomationEngineer,MS Productandfacilitiesdesignanddevelopment,MSSecurityandhealthandPhD Stu-dent(manufacturingengineering).Heworkedacrossawidevarietyofprojectsof industrialsector.HeisassistantprofessoratUniversityofSeville(Fieldof Knowl-edge:EngineeringProject).
AnadelasHerasGarcíadeVinuesaisaBSc.EngIndustrialDesign,MSc.Ecodesign, andPhD.inManufacturingandEnvironmentalEngineering.Sheworksasan assis-tantprofessorintheDepartmentofDesignEngineering,EngineeringProjectarea, atUniversityofSeville,Spain.


![Fig. 10. Probability density function pdf [ B μ ( δ )] for each performance metric.](https://thumb-us.123doks.com/thumbv2/123dok_us/9950665.2487768/10.892.82.834.74.756/fig-probability-density-function-pdf-b-performance-metric.webp)