Copyright by
Mikhail Kazdagli 2018
The Dissertation Committee for Mikhail Kazdagli
certifies that this is the approved version of the following dissertation:
Robust Behavioral Malware Detection
Committee:
Mohit Tiwari, Supervisor Sanjay Shakkottai
Sarfraz Khurshid Milos Gligoric Mihai Christodorescu
Robust Behavioral Malware Detection
by
Mikhail Kazdagli
DISSERTATION
Presented to the Faculty of the Graduate School of The University of Texas at Austin
in Partial Fulfillment of the Requirements
for the Degree of
DOCTOR OF PHILOSOPHY
THE UNIVERSITY OF TEXAS AT AUSTIN May 2018
Robust Behavioral Malware Detection
Publication No.
Mikhail Kazdagli, Ph.D.
The University of Texas at Austin, 2018
Supervisor: Mohit Tiwari
Computer security attacks evolve to evade deployed defenses. Recent at-tacks have ranged from exploiting generic software vulnerabilities in memory-unsafe languages such as buffer overflows and format string vulnerabilities to exploiting logic errors in web applications, through means such as SQL injection and cross-site scripting. Furthermore, recent attacks have focused on escalating privileges and stealing sensitive information by exploiting new hardware or operating system (OS) interfaces. Computer security attacks are also now relying on social engi-neering techniques to run malicious programs on victims’ machines; instances of such abuse include phishing and watering hole attacks, both of which trick people into running malicious code or divulging confidential information. Thus, traditional computer security methods, such as OS confinement and program analysis, will not prevent new attacks that do not violate OS confinement or present illegal program behaviors.
Another challenge is that traditional security approaches have large trusted code bases (TCBs), which include hardware, OSs, and other software components that implement authentication and authorization logic across a distributed system. This is a vulnerable area because these components are complex and often contain vulnerabilities that undermine the overall system’s integrity or confidentiality.
Evasive attacks on vulnerable systems – especially in instances where trusted components turn malicious – inspire the creation of defenses that can augment formally specified mechanisms against known threats. Specifically, this thesis ad-vances the state of the art inbehavioral malware detection – detecting previously unknown malware in the very early stages of infection within an enterprise network. Here we assess three fundamental insights of modern-day attacks and then describe a cross-layer defense against such attacks. First, we make a low-level machine state visible to behavioral analysis, significantly minimizing the TCB and its associated vulnerabilities. Specifically, our behavioral detector utilizes an exe-cutable code’s dynamic properties, with architectural and micro-architectural states as input. Second, we evaluate behavioral detectors against adaptive adversaries. For this purpose, we introduce a new metric to determine a detector’s robustness against malware modifications, which serves as a step toward explainability of ma-chine learning-based malware detectors. Finally, we exploit the fact that attacks spread through only a limited number of vectors and propose new techniques to an-alyze the resulting dynamic correlations created among machines. These insights show that behavioral detectors can efficiently protect both individual devices and end hosts within enterprise networks. We present three types of such behavioral
detectors.
Sherlock protects resource-constrained devices, such as mobile phones and Internet-of-things (IoT) devices, without modifying the software/hardware stack. Sherlock’s supervised and unsupervised versions outperform prior work by 24.7% and 12.5% (area under the curve (AUC) metric), respectively, and detects stealthy malware that often evades static analysis tools.
The second behavioral detector, Shape-GD, protects devices within an en-terprise network. It monitors devices on the network, aggregates data from weak local detectors, overlays that with network-level information, and then makes early, robust predictions regarding malicious activity. Shape-GD achieves its goals by ex-ploiting latent attack semantics. Specifically, it analyzes communication patterns across multiple devices, partitioning them intoneighborhoods. Devices within the same neighborhood are likely to be exposed to the same attack vector. Further-more, we hypothesize thatthe conditional distribution of false positives is different from that of true positives; i.e., given a neighborhood of nodes, we can compute the aggregate distributional shape of alert feature vectors from the neighborhood itself and provide robust labels.
We evaluate Shape-GD by emulating a large community of Windows sys-tems using the system call traces from a few thousand malicious and benign appli-cations; we simulate both a phishing attack in a corporate email network as well as a watering hole attack through a popular website. In both scenarios, Shape-GD iden-tifies malware early on (∼100 infected nodes in a∼100K-node system for watering hole attacks, and ∼10 of ∼1,000 for phishing attacks) and robustly (with∼100%
global true-positive and∼1% global false-positive rates).
The third behavioral detector, Centurion, detects malware across machines monitored by an anti-virus company. It is able to analyze behavior from 5 mil-lion Symantec client machines in real time and discovers malware by correlating file downloads across multiple machines. Compared with a recent local detector that analyzes metadata from file downloads, Centurion reduced the number of false positives from∼1M to∼110K and increased the true-positive rate by a factor of
∼2.5. In addition, on average, Centurion detects malware 345 days earlier than commercial anti-virus products.
Table of Contents
Abstract iv
List of Figures xii
Chapter 1. Introduction 1
1.1 Broader Impact . . . 1
1.2 Cybersecurity Statistics . . . 2
1.3 Evolution of Attacks . . . 5
1.4 Existing Approaches . . . 7
1.5 Why Machine Learning for Computer Security . . . 10
1.6 Overview of Our Solution . . . 11
1.7 Thesis Organization . . . 14
Chapter 2. Quantifying and Improving the Efficiency of Hardware-based Mobile Malware Detectors 15 2.1 Introduction . . . 15
2.2 Motivation . . . 20
2.2.1 HMDs in a Network of Weak Detectors . . . 21
2.2.2 Hardware vs OS-level detectors . . . 21
2.2.3 Challenges in Evaluating HMDs . . . 24
2.3 Synthesizing Mobile Malware . . . 27
2.3.1 Unique Aspects of Mobile Malware . . . 28
2.3.2 Behavioral Taxonomy of Mobile Malware . . . 30
2.3.3 Constructing Malware Binaries . . . 32
2.4 Real User-driven Execution . . . 35
2.4.1 Benign Apps . . . 35
2.4.2 User Inputs . . . 36
2.4.4 Constructing and Evaluating HMDs . . . 40
2.5 Case Studies using Sherlock . . . 41
2.5.1 Improving Unsupervised HMDs . . . 41
2.5.1.1 Bag-of-words Anomaly Detector . . . 44
2.5.1.2 Markov-model based Anomaly Detector . . . 46
2.5.1.3 HMDs Should Be App-specific . . . 49
2.5.2 Improving Supervised HMDs . . . 49
2.5.3 Composition with Static Analyses . . . 54
2.6 Conclusions . . . 56
Chapter 3. Early and Robust Malware Detection in Enterprise Networks 58 3.1 Introduction . . . 58
3.2 Overview of Shape-GD . . . 65
3.2.1 Intuition behind Shape-GD . . . 69
3.2.2 From Intuition to Algorithm Design . . . 71
3.3 Shape GD Algorithm . . . 72
3.4 Experimental Setup . . . 82
3.4.1 Case for a New Methodology . . . 82
3.4.2 Benign and Malware Applications . . . 85
3.4.3 Modeling Waterhole and Phishing Attacks . . . 86
3.5 Results . . . 89
3.5.1 Can Shape of Alert-FVs Identify Malicious Neighborhoods? . 90 3.5.2 Time to Detection Using Temporal Neighborhoods . . . 91
3.5.3 Time to Detection Using Structural Information . . . 96
3.5.4 Fragility of Count-GD . . . 99
3.6 How Accurate is Clustering for Global Malware Detection? . . . 102
3.7 How Many FVs does Shape-GD Need to Make Robust Predictions? . 105 3.8 Computation and Communication Costs of Shape-GD . . . 107
3.9 Discussion . . . 109
Chapter 4. The Shape of Alerts: Detecting Malware Using Distributed Detectors by Robustly Amplifying Transient Correlations
in the Symantec Wine Dataset 113
4.1 Introduction . . . 113
4.2 Centurion: Algorithm . . . 115
4.2.1 Centurion: Classifiers . . . 116
4.2.2 Neighborhood Instances from Attack-Templates . . . 118
4.2.3 Shape Property for Malware Detection . . . 121
4.3 Experimental Setup . . . 122
4.3.1 Wine Dataset . . . 123
4.3.2 Vector-histogram Implementation . . . 126
4.4 Results . . . 127
4.4.1 Centurion: Classifiers . . . 128
4.4.2 Neighborhoods Concentrate Malware . . . 130
4.4.3 Lifespan of Malicious Domains. . . 132
4.4.4 Aggregate Detection Results . . . 133
4.4.5 File-level Aggregate Results . . . 134
4.4.6 Machine-level Aggregate Results . . . 137
4.5 Real-Time Detection . . . 139
4.5.1 File-level real-time detection . . . 139
4.5.2 Machine-level real-time detection . . . 144
4.5.3 Fragility of Count-GD . . . 147
4.6 Discussion . . . 149
4.7 Conclusion . . . 151
Chapter 5. Related Work 152 5.1 Static Analysis . . . 152 5.1.1 Program Analysis . . . 153 5.1.2 Machine Learning . . . 154 5.2 Dynamic Analysis . . . 155 5.2.1 Program Analysis . . . 155 5.2.2 Machine Learning . . . 156
Chapter 6. Conclusions and Future Work 160 6.1 Thesis Contributions . . . 160 6.2 Future Work . . . 162
Bibliography 164
List of Figures
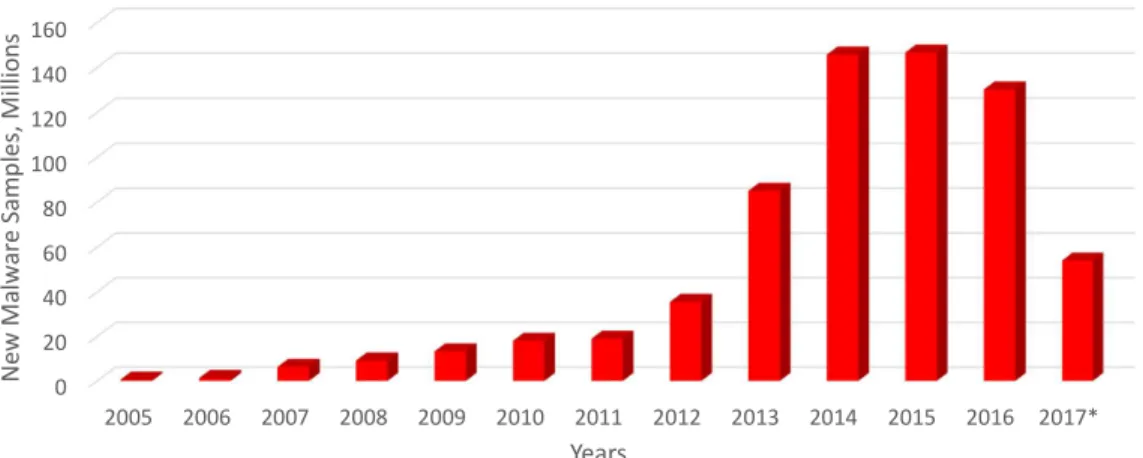
1.1 The cumulative number of malware samples registered by AV-TEST Institute. Malware has been growing very fast over the last decade.
*contains results obtained on 07/04/2017. . . 2 1.2 The number of new malware samples released every year.*contains
results obtained on 07/04/2017. . . 3 2.1 Overview of Sherlock. . . 16 2.2 Executing malware payloads. The off-the-shelf Geinimi.a malware
crashes immediately. Once fixed, Geinimi.a executes malicious payloads such as stealing SMSs or contacts or downloading files. . 22 2.3 Differential analysis of malware v. benignware. The plot shows
principal components of benign Firefox, Firefox with malware, and arbitrary Android apps. Malicious Firefox’s traces are closer to Firefox than to random apps. . . 23 2.4 Real user inputs create hardware level activity, while providing no
input or using Android’s input-generation tool (Monkey) creates a very small signal. . . 25 2.5 Malware behaviors observed in a 126-family 229-sample Android
malware set from Contagio minidump. Most malware steals data or carries out network fraud. However, samples that use phones as compute nodes, e.g., to crack passwords or mine bitcoins, have been reported in 2014. . . 27 2.6 Examples of malware behaviors and their contribution to the
mal-ware dataset. . . 28 2.7 Malware payloads: 4 info stealers, 2 networked nodes, and 1
com-pute node. These settings represent a small but computationally diverse subset of malware behaviors. Interestingly, small software actions have large hardware footprints. . . 32 2.8 Real user inputs on benign apps, with per app traces up to∼2 hours
and∼2 trillion instructions. We choose complex apps and include a mix of compute (games), user-driven (browsers, medical app), and network-centric (radio) apps. . . 33
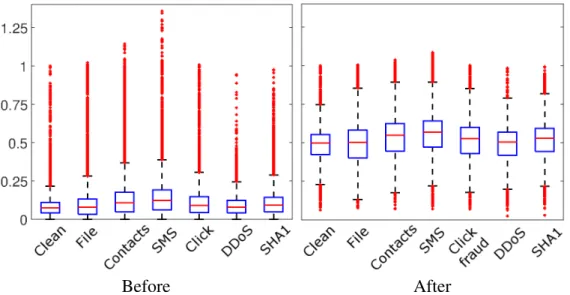
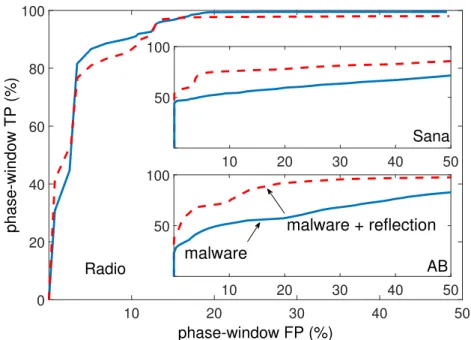
2.9 HMD results for Angry Birds with click fraud operating at three (increasing) intensities. Since HMD is trained on benign Angry-Birds, a low dark-line shows that the HMD detects malware as a low probability state. . . 35 2.10 Distribution of load/store events in Angry Birds before and after
power transform. Power transform does not make malware pay-loads on Androidmore discernible from benign behavior, whereas Tang et al. [142] show that it separatesexploitsfrom benign apps in Windows. . . 42 2.11 Comparison of power transform + ocSVM (prior work) and
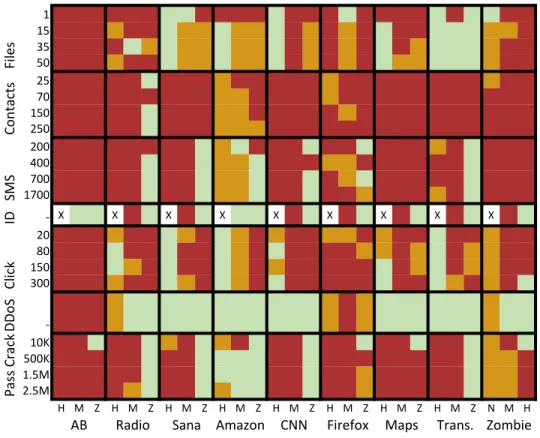
Dis-crete Wavelet Transform + ocSVM (this work). Our detector has 24.7% better area under curve metric (AUC) than prior work. . . 43 2.12 The operating range of Bag-of-words HMD. In each rectangle, the
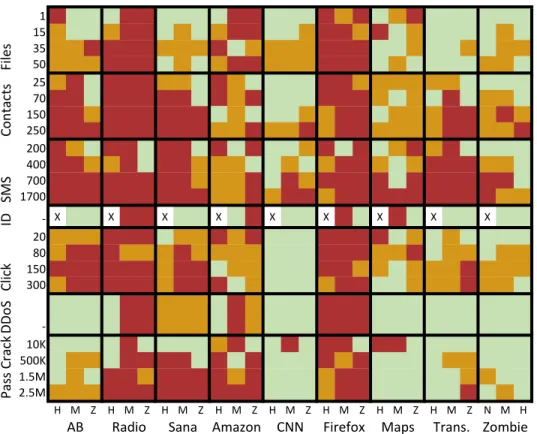
size of malicious payload grows from the top to the bottom, and the amount of delay decreases from left to right (H=High, M=Medium, Z=Zero delay). If color goes from light to dark within a rectangle, then the detection threshold (i.e., the lower end of the operating range) lies inside the rectangle. . . 45 2.13 The operating range of Markov model HMD. Interestingly, the Markov
model performs worse than the simpler bag-of-words model for compute intensive and dynamic apps (e.g., Angry Birds, CNN, and Zombie WorldWar). . . 47 2.14 Training supervised learning HMD on a balanced set of malware
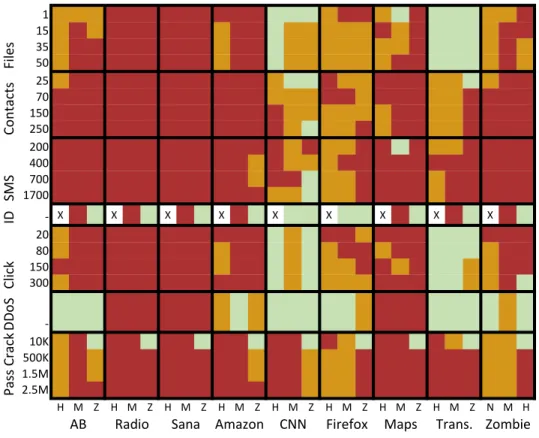
behaviors yields best results. . . 50 2.15 Operating range of 2-class Random Forest HMD: more effective
than anomaly detectors when trained on a balanced dataset of all malware behaviors. . . 51 2.16 Code shows Java reflection and string encryption in Obadmalware
that foils static analysis tools. . . 54 2.17 (Markov model) Effect of obfuscation and encryption on detection
rate: interestingly, malware becomes more distinct compared to baseline benign app. . . 56
3.1 (L to R) Each circle is a node that runs a local malware detector (LD). Our goal is to create a robust global detector (GD) from weak LDs. We observe that nodes naturally form neighborhoodsbased on attributes relevant to attack vectors – e.g., all client devices that visit a website W within the last hour belong to neighborhoodNBw, or all users who received an email from a mailing list M in the last hour belong to neighborhood NBm. We propose a new GD that groups together suspicious local feature vectors based on neigh-borhoods – traditional GDs only analyze local alerts while we re-analyze feature vectors that led to the alerts. Our GD then exploits a new insight – the conditional distribution of true positive feature vectors differs from false positive feature vectors – to robustly clas-sify neighborhoods as malicious. . . 59 3.2 (Shape of conditional distributions) The top left figure is the
proba-bility density function (pdf) of benign feature vectors, here a Gaus-sian with mean ‘-1’; and the top right figure is the pdf for malicious feature vectors, here a Gaussian with mean‘+1’. The optimal lo-cal detector at any machine would declare ’malware’ if a sample’s value is positive, and declare ’benign’ if a sample’s value is nega-tive. The bottom plots shows the pdfs of the same Gaussians but now conditioned on the event that the sample is positive – the pdfs corresponding to false positive and true positive feature vectors re-spectively have different shapes. . . 68 3.3 (ROC curves) True positive v. False positive curves shows detection
accuracy of seven local detectors. Random Forest outperforms all others; but has unacceptably high false positive rate (above 10%) if one wants to achieve at least 95% true positive rate. . . 75 3.4 Histogram of the ShapeScore: The ShapeScore is computed for
neighborhoods with 15,000 FVs each (experiment repeated 500 times to generate the histograms). Shape-based GD can reliably separate FPs and TPs through extracting information from the data that has been unutilized by an LD. . . 90 3.5 (Phishing attack: Time-based NF) Dynamics of an attack: While
the portion of infected nodes in a neighborhood increases over time reaching 55 nodes out of 1086 on average, ShapeScore goes up showing that Shape GD becomes more confident in labeling neigh-borhoods as ‘malicious’. It starts detecting malware with at most 1% false positive rate when it compromises roughly 22 nodes. The neighborhood includes all 1086 nodes in a network and spans over 1 hour time interval. . . 92
3.6 (Waterhole attack: Time-based NF) Dynamics of an attack: While the portion of infected nodes in a neighborhood increases over time reaching 1248 nodes on average, ShapeScore goes up showing that Shape GD becomes more confident in labeling neighborhoods as ‘malicious’. It starts detecting malware with at most 1% false posi-tive rate when roughly 200 nodes get compromised. The neighbor-hood includes 17,178 nodes on average and spans over 30 sec time interval. . . 94 3.7 (Phishing attack: Time-based NF algorithm) Shape GD’s
perfor-mance improves by 18.5% (20.24 and 17.08 infected nodes) when increasing the size of a neighborhood window from 1 hour to 3 hours. . . 96 3.8 (Waterhole attack: Time-based NF) Shape GD’s performance
de-teriorates linearly when increasing the size of a neighborhood win-dow from 6 sec to 100 sec. . . 97 3.9 (Phishing attack) Comparing to pure time-based NF, structural
fil-tering algorithm improves Shape GD’s performance by ∼4× by taking into consideration logical structure of electronic communi-cation (sender – receiver relation). . . 98 3.10 (Waterhole attack) Comparing to pure time-based NF, structural
fil-tering algorithm improves Shape GD’s performance by 3.75× – 5.8×by aggregating alerts on a server basis. . . 99 3.11 (Waterhole attack) An error in estimating neighborhood size
dra-matically affects Count GD’s performance. It can tolerate at most 0.1% underestimation errors and 13.8% overestimation errors to achieve comparable with Shape GD performance. . . 100 3.12 (Phishing attack) An error in estimating neighborhood size
dramat-ically affects Count GD’s performance. It can tolerate at most 2% underestimation errors and 6.3% overestimation errors to achieve comparable with Shape GD performance. . . 101 3.13 (ROC curve)bp True positive v. False positive curve shows
de-tection accuracy of the clustering-based malware detector [160]. Its Area Under the Curve (AUC) parameter averaged for 10 runs reaches only 48.3% and 47.4% in the case of waterhole and phish-ing attacks respectively; such low AUC value makes it unusable as a global detector. . . 104 3.14 Analysis of ShapeScore histogram parameters when changing
neigh-borhood size. The curves flatten out on the right side from the op-erating point. . . 107 3.15 (Overview) Shape-GD machine learning pipeline. . . 109
4.1 Application of Centurion to malware detection in the Symantec
Wine dataset. . . 115
4.2 Domain name classifier’s features. . . 118
4.3 Example of a downloader graph. . . 124
4.4 (Left) Receiver operating curve (ROC) of the local detector and the domain name classifier. (Right) ROC of the neighborhood classifier. 128 4.5 Neighborhood classifier acts as a malware concentrator. (Upper) Distribution of infection rates of randomly grouped files. (Mid-dle) Distribution of neighborhoods’ infection rates. (Lower) Dis-tribution of neighborhoods’ infection rates after filtering out low-infected neighborhoods. The neighborhood classifier retains only highly infected neighborhoods. (Distributions are capped at 1,000 level.) . . . 130
4.6 Distribution of the lifespan of malicious domains. After removing domains serving only a single malicious file, the average lifespan goes up to 157 days. And we set NTW to 150 days. . . 132
4.7 File-level aggregate results. . . 135
4.8 Machine-level aggregate analysis. . . 138
4.9 (File-level real-time detection) File download statistics. . . 140
4.10 (File-level real-time detection) Local detector’s detection results. . . 141
4.11 (File-level real-time detection) Neighborhood detector’s detection results. . . 142
4.12 (File-level real-time detection) Centurion’s detection results. . . 143
4.13 (Machine-level real-time detection) Machine-level local statistics. . 144
4.14 (Machine-level real-time detection) Machine-level local detector’s detection results. . . 145
4.15 (Machine-level real-time detection) Machine-level neighborhood de-tector’s detection results. . . 146
4.16 (Machine-level real-time detection) Machine-level Centurion’s de-tection results. . . 147
4.17 (Symantec Wine dataset) An error in estimating neighborhood size dramatically affects Count-GD’s performance. Count-GD can tol-erate at most 30% underestimation errors and 1% overestimation errors to achieve comparable with Shape GD performance. . . 148
Chapter 1
Introduction
Used for everything from voting machines and elections to personal health and finances, computing is deeply and critically embedded in our society. How-ever, due to malware’s exponential growth and ability to quickly adapt to deployed defenses, best-known security techniques quickly become obsolete. To add a last line of defense against unknown ‘zero-day’ malware, we study behavioral malware detection – an attack-agnostic detection approach that either detects malware’s de-viation from a regular system’s behavior (anomaly detection) or learns to classify the difference between benign and malicious programs’ behaviors (malware classi-fication).
1.1
Broader Impact
Computer systems today process billions of transactions per day in the fi-nancial industry; they drive electronic commerce; they store and process healthcare data; they manage key elements of the cyberphysical infrastructure (power plants, factories, etc.); participate in decision-making processes. Privacy and integrity are therefore paramount for much of the data with which computers work. Any soft-ware vulnerabilities can make such systems an easy target for attackers.
0 100 200 300 400 500 600 700 2005 2006 2007 2008 2009 2010 2011 2012 2013 2014 2015 2016 2017* M al w ar e Sa m pl es , M ill io ns Years
Figure 1.1: The cumulative number of malware samples registered by AV-TEST Institute. Malware has been growing very fast over the last decade.
*contains results obtained on 07/04/2017.
Recent malicious attacks [7, 22, 41, 45, 51] demonstrate how fragile the sys-tems are and how few resources are needed to cause significant damage. In many cases, the damage can be beyond just financial loss. Take the example of the Demo-cratic Party’s breach [22] in 2016 or the multiple recent medical record breaches, such as the one at the Office of Personnel Management [21].
1.2
Cybersecurity Statistics
Despite enormous efforts by malware researchers and security practitioners, the malware population has grown rapidly. Malware adapts to the security solutions deployed in practice, and its developers find new ways of abusing emerging tech-nologies, such as in mobile and IoT devices.
According to statistics released by AV-TEST [29], an independent German organization that periodically evaluates and rates antivirus and security suite
soft-0 20 40 60 80 100 120 140 160 2005 2006 2007 2008 2009 2010 2011 2012 2013 2014 2015 2016 2017* N ew M al w ar e Sa m pl es , M ill io ns Years
Figure 1.2: The number of new malware samples released every year.
*contains results obtained on 07/04/2017.
ware, the total malware population has grown from 1.7 million ‘samples’ (i.e., unique binaries) in 2005 to 650 million samples in July 2017 (Figure 1.1). Also we can notice that over the last four years, cybercriminals have significantly increased the rate of malware production. Rates have reached an average of 12 million new malware samples per month, in comparison to 52.5 thousand in 2005 (Figure 1.2).
Today, 85% of malware targets the Windows OS, as it is the most widespread and thus the most lucrative platform for attackers. However, this number is shrink-ing as more and more malware samples move into the mobile market. It is worth noting that mobile malware demonstrates a higher growth rate than its desktop counterpart. For example, the most prevalent type of mobile malware, Android mal-ware, has grown from∼360 thousand (January 2013) to∼16.5 million (September 2016). This is not surprising because almost all applications that were available mainly on desktops only a few years ago (e.g., email, online banking) now con-veniently function on mobile devices. The lack of adequate security solutions for mobile devices together with manufacturers’ unwillingness to patch known Android
vulnerabilities make Android users easy prey for cybercriminals.
Attackers pursue multiple goals, from hijacking computer systems to gath-ering users’ behavioral patterns to serve highly personalized ads. A large fraction of desktop malware still tries to hijack computers and join them to a botnet. Some malware hunts for online banking accounts, credit card data, and passwords. Infor-mation stealing is especially prevalent among mobile devices because the devices accompany the user everywhere and their applications can access a large number of sensors.
A recent trend is the rapid growth of potentially unwanted applications that collect information about users’ surfing habits and other personal data and send users’ profiles to advertising companies. Another trend is the growing number of ransomware, which is used to encrypt personal data on both desktop systems and mobile devices and extort money for releasing a decryption key.
Such infections are in fact enabled by commercial malware detectors that heavily rely on identifying malware signatures. Signature-based defenses are a rea-sonable way of protecting a system against trivial malware, but they do not work against polymorphic and metamorphic malware because they only capture the syn-tactic view of malware, i.e., the concrete way it is implemented. They can be gener-alized to cover similar malware variants, but self-modifying code can easily defeat such signatures.
To increase detectors’ robustness to self-modifying malware, detectors must employ behavioral malware detection, which captures malware semantics rather
than syntactic properties. Later in this thesis, we describe how to design an end-host security solution that is based on the principles of behavioral malware detection.
1.3
Evolution of Attacks
The landscape of malicious attacks does not remain constant over time; rather, it evolves as new technologies emerge. At a high level, we can distinguish at least three broad categories of security attacks: memory corruption attacks, web attacks, and modern attacks – a new class of attacks that includes abuse of new interfaces and extensive use of social engineering. Attackers first started exten-sively exploiting memory errors in the 1990s (e.g., buffer overflows, double free, etc.), plenty of which were present in the then-dominant memory-unsafe languages. Attacks then moved to exploitating high-level web vulnerabilities, which opened an unprecedented way of directly executing high-level actions (e.g., exfiltrating sensitive information from a database, escalating user privileges in a web-based system). As developers started using memory-safe languages and security experts eliminated easily exploitable vulnerabilities, the attacker community added to its arsenal a powerful new technique: social engineering. Social engineering refers to psychologically manipulating people to perform actions or divulge confidential information. This type of attack mostly relies on human errors, whereas the other two solely exploit software vulnerabilities. Because they stem from human errors, social engineering attacks are hard to detect or prevent through purely technical means.
watering hole attacks. Phishingis a common method for obtaining private infor-mation by mimicking an email from a legitimate business such as a bank, credit card company, e-commerce retailer, etc. A phishing email usually contains either a link to a fraudulent web page that looks exactly like a legitimate one or a mali-cious attachment. A victim is usually asked to update some private information by following the malicious link, and thus attackers obtain that sensitive data. In the case of a malicious attachment, when an unsuspecting user opens it, malicious code is executed. It may collect private information in the background or even install a backdoor on a device.
The other popular social engineering attack technique, the watering hole attack, exploits users’ trust in websites that they visit on a regular basis. Usually attackers start by gathering information about websites the user often visits from the secure system. Next, attackers search for vulnerabilities on those websites and inject code that can compromise the users’ machines. The injected code supplies malware to the users upon connection and configures malware based on the users’ environment to maximize its success rate. Typically, one or more members of the target group are compromised, and after that an attacker can easily move laterally within the secure system and compromise other machines [11].
In addition to social engineering techniques for attack, modern attacks ex-tensively abuse new interfaces or use side channels, which are hard to preemptively discover and close. For example, recently released Spectre [37] and Meltdown [31] abuse speculative execution that leaves a secret-data-related micro-architectural state in the CPU after executing code that is not supposed to be executed. Both attacks
use a flush-reload [159] side channel to analyze the cache state modified by a spec-ulatively executed code. Therefore, Spectre is able to leak victims’ confidential information, and Meltdown is capable of breaking all security assumptions given by the address space isolation as well as paravirtualized environments and, thus, every security mechanism built upon this foundation. Another example, RowHam-mer [105, 135, 145, 152], exploits DRAM technology to flip bits in memory and is able to achieve privilege escalation.
1.4
Existing Approaches
In this section, we briefly summarize common approaches to mitigating software security issues. A detailed discussion of the related research is available in Chapter 5.
Security solutions can be classified into two broad classes based on their design characteristics: static and dynamic. The former analyze static properties of an artifact (e.g., a file, a network packet) that are potentially malicious without executing it, while the latter perform real-time analysis when a system runs with test inputs or when it is already deployed.Static analysisdescribes static code analysis that is extensively used to search for vulnerabilities in software. Such algorithms are usually designed to achieve soundness – meaning they never miss any bugs. However, soundness and completeness are not achievable simultaneously (because this is an undecidable problem). Usually, an incomplete static code analysis leaves behind many false positives that must be manually verified. Also, extensive use of dynamic features in modern languages such as dynamic types, dynamic method
resolution, and distributed and/or parallel algorithms significantly increase false-positive rates, thus limiting static analysis’s real-world applicability.
Static analyzers may use machine-learning algorithms to detect malicious artifacts. They are not limited to code analysis; they may work with other types of artifacts such as network traces or API calls’ or system calls’ sequences. However, machine-learning systems’ results usually suffer from poor explainability. Due to the use of multiple non-reversible transformations that lie at the heart of machine-learning algorithms, it is hard or sometimes even impossible to identify the root cause of an alert. Therefore, such detectors are not widely adopted in practice. Commercial solutions thus still heavily rely on manually hardcoded rules for bug detection to unambiguously map alerts to root causes.
The other class of methods,dynamic methods, analyzes program execution’s side effects. This class can also be divided into two sub-classes. The first is based on runtime tracking of causality relations. Usually, it employs some form of dynamic information flow tracking to analyze how data is propagated through the code dur-ing execution. This can be relatively easy to achieve for managed languages such as Java, JavaScript, and Python by augmenting the just-in-time translator with a logic-performing information flow tracking simultaneously with program execution. As for traditional compiled languages such as C/C++, the same effect can be achieved by inlining information-flow-tracking code into the original program. However, both methods usually introduce significant performance overhead, as they execute an information-flow-tracking engine in parallel with the original program.
monitors how an application under test interacts with the rest of the system at one or more interfaces – for example, at system call, API, network, or memory allocation levels. A dynamic analyzer uses a model of a normal program behavior and com-pares real-time observations against predictions given by the model. It considers significant deviations from the model as a sign of malicious activity. In comparison to causality-based dynamic analysis, such detectors typically incur little overhead. However, they replace causality with a weaker property: correlation.
The other method for classifying existing approaches is to partition them into the following two classes: client-based and network-based. All approaches de-scribed above fall into the category of client-based detectors because they perform per-host analysis. An example of a network-based detector is a system that analyzes network communication patterns and the content of network packets. This example is quite promising because eventually almost all malware and other attacks spread over a network and thus are visible at the network level. However, encrypted traffic and the requirement to maintain low latency usually pose significant challenges for such detectors.
In practice, various combinations of such detectors can be used, and they are usually accompanied by ad hoc rules that match simple malicious behaviors observed in the real world.
Regardless of the method being used, it is often hard to distinguish between benign and malicious behaviors because malware can try to mimic benignware, which leads to high false-positive rates. In practice, to minimize false-positive rates, malware detectors are configured to be permissive, i.e., only highly
suspi-cious activity leads to an alert. Therefore, a significant portion of malware may remain undetected for a long period of time.
1.5
Why Machine Learning for Computer Security
Traditional approaches to computer security such as OS confinement, for-mal methods, and software verification often fail to protect systems against modern attacks for several reasons. First, such attacks may not be visible at the level of traditional malware detectors because new hardware or APIs can be exploited. Sec-ond, rather than directly compromising a system, attacks might trick the user into performing an action on an attacker’s behalf. Therefore attacks do not violate any constraints that are enforced by traditional malware detectors. Third, software ver-ification typically is not able to mitigate security issues because it is undecidable, it poorly scales up to large code bases, and real-world systems often lack precise specifications.
On the other hand, machine-learning-based malware detectors possess some appealing properties. First, they do not require any formal specifications. Second, machine-learning algorithms learn by example – they require data corresponding to normal and abnormal system behaviors, which is much easier to collect than to formally specify security properties and verify that a system complies with them. Third, such detectors can easily scale up to model practical systems of an arbitrary complexity and size.
However, they can only detect attacks or malware that exhibit statistical behavior at the given level of abstraction. In other words, if malware causes an
application to slightly deviate from a normal behavior, a machine-learning detector may ignore it if such a deviation is statistically insignificant. Therefore, a behavioral detector should operate on multiple layers of abstraction to prevent a large spectrum of attacks.
In summary, a machine-learning-based approach to computer security is one of the promising ways to develop low-overhead malware detectors that are capable of protecting large systems.
1.6
Overview of Our Solution
In this work, we address the key aspects of applying machine learning to computer security – explainability, a relatively high false-positive rate, and robust-ness to evasive malware – and present an end-to-end security solution that operates at multiple layers of abstraction on end-host devices and at the network level.
First, we develop a highly efficient behavioral malware detector that can be deployed even on resource-constrained devices such as mobile phones and IoT de-vices. The detector analyzes the executed code’s dynamic properties and compares them with predictions made by state-of-the-art machine-learning models. If there is a deviation from the model, a detector raises an alert.
We introduce a new methodology for evaluating malware detectors – a white-box methodology together with an operating range concept. The white-white-box method-ology allows us to understand malware internals rather than treating them as a black box. It includes a deep malware introspection and ensures correct malware
execu-tion in a laboratory environment. Also, it includes a method for developing evasive malware that is used to comprehensively evaluate a detector.
An operating range of a detector characterizes its detection capabilities with respect to a particular malware type. We can formally define it as the smallest mal-ware payloadX hidden in an applicationY that a detector can detect with a false-positive rate ofZ. In other words, for a chosen applicationY and a fixed threshold Z, the operating range indicates the smallest malware payload that the detector can reliably detect. The operating range accompanies the white-box methodology be-cause it is required to perform malware dissection in order to identify malware types. Also, it serves as a step toward explainability of machine-learning-based malware detectors.
Second, we develop a generic framework for aggregating predictions made by individual weak detectors (detectors having low precision) running on end-host devices and correlating them with network-level activity to drive the false-positive rate toward zero. Specifically, end-host detectors report data samples that lead to raising local alerts to a global detector. It reanalyzes multiple data samples simul-taneously, allowing for recovery of precision at a global level. The main advantage of such an approach is its ability to reanalyze multiple local data samples overlayed with the network-level communication patterns. The network-level information is used to formulate a hypothesis about potential attacks, and the local data samples are used for hypothesis testing.
The global detector that we introduce in Chapters 3,4 relies on the differ-ence of statistical shape of local detectors’ false and true positives. Though a local
detector is not able to distinguish between individual false and true positives, the global detector can differentiate between them by aggregating multiple false and true positives and approximating the distributions that they come from. We empir-ically verified this assumption across multiple systems, both mobile and desktop, and across multiple OSs. Moreover, the assumption held for a large variety of local detector types.
In a practical setting, local detectors generate both false and true positives because some nodes on a network are compromised and others are not. The high number of false positives hides true positives and makes it hard for the global detec-tor to distinguish between them using their statistical shape. To make malware more noticeable and thus facilitate early and robust malware detection, we introduce dy-namic neighborhoods that aggregate nodes exposed to similar attack vectors. These can be used in conjunction with statistical shape. We use the neighborhood concept to increase malware concentration.
Malware spreading along one of the attack vectors compromises one or more neighborhoods. Thus, malware concentration (and the concentration of true positives) within such neighborhoods in a network is much higher than average. Consequently, the statistical shape of compromised neighborhoods is significantly different from the statistical shape of uncompromised neighborhoods.
We discuss both concepts – statistical shape and dynamic neighborhoods – in detail in Chapters 3,4, where we describe different types of global detectors.
1.7
Thesis Organization
The rest of this thesis is organized as follows. Chapter 2 outlines the de-sign of end-host detectors, establishes general guidelines for the development and evaluation of such detectors, and shows how the principles work in practice. Chap-ter 3 focuses on the problem of aggregating multiple weak behavioral detectors to achieve a desirable false-positive level and presents detection results for watering hole and phishing attacks. Chapter 4 presents an end-to-end malware detector that performs efficient real-time malware detection among 5 million Symantec clients’ systems and significantly outperforms a prior work in terms of malware-detection capabilities. Chapter 5 describes related work. Finally, Chapter 6 summarizes the contributions of this thesis and outlines future research directions.
Chapter 2
Quantifying and Improving the Efficiency of
Hardware-based Mobile Malware Detectors
12.1
Introduction
Mobile devices store personal, financial, and medical data and enable ma-licious programs to spread quickly through app-stores. Unsurprisingly, 2015 saw 900K new mobile ‘malware’ compared to 300K in 2014. Mobile malware infects applications through errors by users, developers, or platforms like Android [30, 47, 77]. Once infected, malware can run ‘payloads’ such as stealing private data from the victim device or making HTTP requests to attack a remote server while masquerading as the infected application. Hence, machine learning classifiers that differentiate operating system and networkbehaviorsof benign programs from mal-ware are an attractive line of defense against mobile malmal-ware [126].
Hardware-based malware detectors (HMDs) are a recent category of be-havioral malware detectors [72, 103, 122, 142]. An HMD observes programs’ in-struction and micro-architectural traces and raises an alert when the current trace’s
1Based on the research paper ”Quantifying and improving the efficiency of hardware-based
mo-bile malware detectors” [102] by M. Kazdagli, V. Reddi, and M. Tiwari published at 49th Annual IEEE/ACM International Symposium on Microarchitecture. M. Kazdagli was the lead researcher for the project.
Real%Users% Benign%% apps% Record1replay%user%input% Angry%Birds%%%%Sana%Medical%%%%TuneIn%Radio%%%…% Info%Stealers%%%%Network%nodes%%%%Compute%nodes% Malware% synthesizer% Payload%diversificaFon,%Command%and%control,%% Code%obfuscaFon,%Repackage%into%benignware% Behavior% taxonomy% Geinimi.a%%%%LeNa.c%%%Zitmo%%Obad%%%Maistealer%%…% Malware% binaries% HMD%Analyst% Power%transform%|% ocSVM% DWT%|%bag%of%words,% markov%model%|%ocSVM,% 2c%SVM,%rand%forest…% Performance%counter%traces% Opera&ng) range) of)HMD)) Benignware) Malware) HMD)algorithms) Mobile)pla8orm)
Figure 2.1: Overview of Sherlock.
statistics look either anomalous compared to benign traces (unsupervised HMDs) or similar to known malicious traces (supervised HMDs). HMDs are small, secure even from a compromised OS, and can observe instruction-level attacks (such as row hammer [105, 135, 145] and side-channel data leaks [121]) that leave no system call trace [125]. HMDs are thus a trustworthy first-level detector in a network-wide malware detection system [146, 165] and are being deployed in commercial mobile devices2as of early 2016.
Architects designing HMD accelerators face two unique challenges. First, unlike benign programs like SPEC, malware adapts to proposed modeling algo-rithms and will evade detectors that only learn behaviors of existing malware [156]. For example, we found that changing only the number of execution threads or inter-action delays in a malware was sufficient to evade an HMD [72] trained on single-threaded binaries of the same malware. Second, to compare malware against benignware executions, HMDs have to run both programs with real user inputs. For example, a human user playing Angry Birds produces very different instruction traces compared to quiescent traces when no user is driving the app. Hence, the tra-ditional ‘black-box’ approach for evaluating HMDs – without looking deeply into malware computation and without real user interaction – yields results that will not hold in practice.
In this paper, we present Sherlock—a ‘white-box’ methodology to evaluate HMDs for mobile malware. Sherlock is built on two principles: (1) malware will adapt to evade detection, and (2) malware hides behind benign programs, and only by running both malware and benignware with real user-inputs can we determine whether an HMD can tell them apart. These principles lead to a significant system-building effort and to new insights about HMDs for mobile malware.
The Sherlockplatform in Figure 2.1 embodies both principles: (1) Sherlock
synthesizes malware specifically to find the breaking point of an HMD under test. To do so, we introduce a taxonomy of mobile malware and present a synthesis tool that generates obfuscated malware with a configurable payload (i.e., tasks to run) that is a superset of the 229 malware we studied. (2) Sherlock tests HMDs when
benign and malware programs use the same, long-running user inputs. To do so, Sherlockcorrectly records and replays thousands of 5–10 minute long user sessions (such as playing Angry Birds or running medical diagnostics) on real hardware. An HMD analyst can then use Sherlock’s third component – HMD algorithms – to design and evaluate new ways of extracting features from program traces in order to train machine learning algorithms.
Sherlock’s design principles yield a new metric for quantifying HMDs’ per-formance. Anoperating rangeof an HMD algorithm is a metric that tells an analyst the root cause behind a malware alert as well as when the HMD fails. An operating range is expressed asthe smallest malware payload X hidden in application Y that an HMD algorithm A can detect with a false positive rate of Z. For example, an analyst can determine how efficiently a compromised browser (Y) can steal SMSs or photos (X) when a random-forest HMD (A) is deployed at a pre-set false positive rate of 5% (Z).
The operating range of an HMD is independent of the training and testing set of malware – instead, it is defined in terms of atomic actions in malware payloads (X) such as stealing one photo or an SMS, sending an HTTP request, etc. An analyst can thus use the operating range to quantify HMD performance based only on (relatively invariant) high-level malware behaviors. Further, operating range describes false positive rate Z by comparing malware to the exact benign app Y that malware hides in—comparing a malware run to an arbitrary benign app or system utility yields an unrealistically good false positive rate.
bet-ter HMDs than prior work, and by showing (for the first time) that evading static program analysis makes malware more visible to HMDs.
Our first case study shows that taking concrete mobile malware actions into account yields a better unsupervised HMD than directly applying desktop HMDs designed to detect short-lived exploits. Specifically, atomic software-level actions on mobile devices such as stealing a 4MB photo or one SMS takes a long time at the hardware level (2.86s and 0.12s respectively on a Samsung Exynos 5250 device). We design a new HMD that uses longer-duration (100ms) feature vectors, extracts low-frequency signals, and is 24.7% more effective using the area under the ROC curve (AUC) metric than prior work [142].
Our second case study uses Sherlock’s malware synthesizer to design super-vised HMDs with 97.5% AUC – 12.5% better than prior work. Specifically, we train on a malware set that covers diverse, orthogonal behaviors compared to prior work that trains HMDs on an ad-hoc subset of behaviors. Further, the supervised HMD’s operating range covers even small data (1 photo, 25 contacts, 200 SMSs, etc) being stolen with close to 100% accuracy at a 5% false positive rate. However, malware payloads that clog remote servers by sending them HTTP requests are vir-tually undetectable at the hardware level—Sherlockprovides such semantic insights into why HMDs succeed and fail.
Our final case study in using Sherlock’s malware synthesizer yields a sur-prising result—obfuscation techniques that evade detection by static analysis tools make HMDs more effective. Specifically, malware developers use string encryption and Java reflection to create high-fanout nodes in data- and control-flow graphs and
thus foil static analysis tools. However, these obfuscation techniques in turn create instruction sequences and indirect jumps that make malware stand out from benign-ware. Hence, light-weight HMDs can complement static analysis tools [42] used by Google and other app stores to drive malware down into more inefficient settings. In summary, we make the following contributions:
1. Malware Synthesis. We deconstruct 229 malware binaries from 2013–2015 to create a malware synthesis tool. An analyst can use the synthesis tool to determine an HMD’s operating range.
2. Record-and-replay Platform. Sherlock records and replays 1–2 hours each of real human input for 9 benign applications and over 69 hours across 594 malware binaries. Without correct replay at these time-scales, malware payloads will not execute to completion.
4. Three case studies with new insights. We improve HMDs’ performance by 24.7% and 12.5% respectively for unsupervised and supervised HMDs and show that HMDs detect stealthy malware that evades static analysis tools.
Sherlock Detailed information on how to reproduce the experiments can be found at https://github.com/Sherlock-2016.
2.2
Motivation
Before we dive into the details of Sherlockin Sections 2.3 and 2.4, we begin with the unique advantages of HMDs over OS-level detectors and challenges in evaluating HMDs.
2.2.1 HMDs in a Network of Weak Detectors
HMDs (as well as OS-level detectors) are deployed in a collaborative in-trusion detection system (CIDS) that has two components. On the server side, a platform provider (e.g., Google) executes benign and/or malware applications using test and real user inputs, measures instruction statistics (using performance counters for example), and creates a database of computational models. On client devices, a light-weightlocal detectorsamples performance counters to create run-time traces from applications, compares each run-time trace to database entries on the device, and forwards suspicious traces to aglobal detectoron the server.
Importantly, HMDs donotneed to have 0% false positives and 100% true positives—they only need to serve as an effective filter for a global detector that can then use program analysis [56, 75] or network-based algorithms [71, 153] to build a robust global detector. We refer readers to Vasilomanolakis et al. [146] for a survey on collaborative malware detectors.
2.2.2 Hardware vs OS-level detectors
HMDs are more trustworthy, light-weight, and hard to hide from compared to detectors that use system call [62, 126], middleware [52], or network based be-havioral analysis [98],
HMDs’ are trustworthy since they can be isolated from most of the OS (and Android middleware) and run inside a hardware-based enclave [53, 94] or directly in hardware [122] – secure against even user errors and kernel rootkits [30]. HMDs can be battery efficient with feature extraction and detection logic implemented
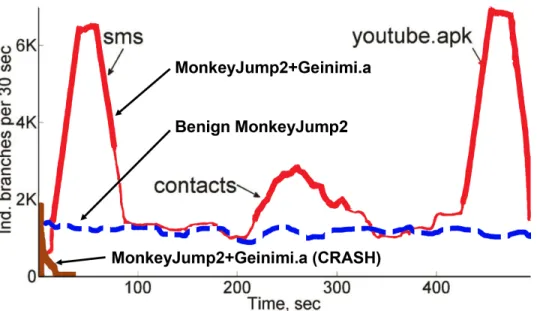
Figure 2.2: Executing malware payloads. The off-the-shelf Geinimi.a malware crashes immediately. Once fixed, Geinimi.a executes malicious payloads such as stealing SMSs or contacts or downloading files.
using accelerators [122]. Finally, HMDs can detect malware that leavesnosystem call trace – such as rowhammer [105, 135], A2 [158], and side-channel attacks [125] on desktops and, as we show in this paper, evasive mobile malware that hides behind benign applications and requests no additional sensitive permissions.
Interestingly, on mobile platforms, HMDs have comparable detection rates to OS-level detectors (although we leave details of this comparative experiment out of this paper). We find that OS-level detectors that model system calls also reach detection rates of almost 90% at false positive rates close to 10%. This is close to our HMDs’ performance (in Section 5)—as a result, HMDs can not just be more trustworthy than OS-level detectors but be competitive in detection performance as well.
Figure 2.3: Differential analysis of malware v. benignware. The plot shows prin-cipal components of benign Firefox, Firefox with malware, and arbitrary Android apps. Malicious Firefox’s traces are closer to Firefox than to random apps.
HMDs for desktops do not directly port over to mobile platforms. Ozsoy et. al’s [122] hardware-accelerated classifiers detect∼90% of off-the-shelf desktop malware with 6% false positive rate. Tang et. al’s [142] anomaly detector achieves 99% detection accuracy for less than 1% false positives on a set of PDF and Java malware. Such desktop HMDs, however, do not work well for mobile platforms – we quantify Tang et. al’s HMD against mobile malware in our first case study in Section 5 and build a 24.7% better HMD using Sherlock.
2.2.3 Challenges in Evaluating HMDs
The closest related work to ours – on HMDs for mobile malware – is by Demme et al. [72], where the authors present a supervised learning HMD that com-pares off-the-shelf Android malware to arbitrary benign apps, yielding a 90:10 true positive to false positive ratio. However, this methodology of using off-the-shelf malware and comparing it to arbitrary benign apps is fallacious, as we discuss next. Adaptive malware. One challenge in evaluating detectors is that malware devel-opers canadapttheir apps in response to proposed defenses. For example, we find that simply splitting a payload into multiple software threads dramatically changes the malware’s performance-counter signature and training a supervised HMD on the single-threaded execution yields a very low probability of labeling the multi-threaded version as malware. Adding delays, changing payload intensity, or choos-ing an alternative victim application also throws off a supervised HMD trained only on traces from existing malware.
Prior work analyzes malware samples categorized by family names like
CruseWinandAngryBirds-LeNa.C—this does not tell an analyst why a malware binary was (not) detected. Instead, we propose to determine whya particular mal-ware sample was (un)detectable, to anticipatehowit can adapt, and then to create a malware benchmark suite toidentify the operating rangeof the detector.
Correct execution. The second challenge is that mobile malware samples available online [33, 166], and used in prior work, seldom execute ‘correctly’. Malware often require older, vulnerable versions of the mobile platform, they may target specific
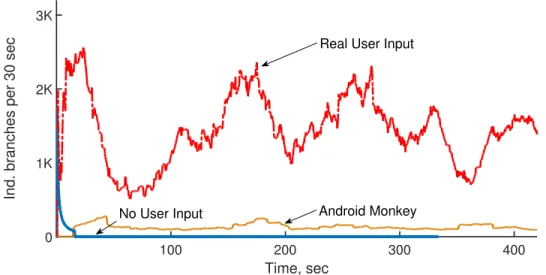
100 200 300 400 Time, sec 0 1K 2K 3K
Ind. branches per 30 sec
No User Input
Real User Input
Android Monkey
Figure 2.4: Real user inputs create hardware level activity, while providing no input or using Android’s input-generation tool (Monkey) creates a very small signal. geographical areas, include code to detect being executed inside an emulator, wait for a (by now, dead) command-and-control server to issue commands over the inter-net or through SMSs, or in many cases, trigger malicious actions only in response to specific user actions [3, 15].
Figure 2.2 shows that an off-the-shelf malware (Geinimi.a) simply crashes on our Android board and thus looks distinct from a benign MonkeyJump game’s trace. Prior work will mis-classify this as a true positive. 20% of malware execu-tions in Demme et al’s [72] experiments lasted less than one second and 56% less than 10 seconds – in comparison, stealing a single photo takes almost 3 seconds. Instead, we ensure that malware executes ‘correctly’ – steals SMSs and contacts, and downloads an app – and aim to identify these payloads.
appropriate differential analysis between benign and malware executions. Prior work [72] trains detectors on malware executions but tests againstarbitrarybenign applications. However, a benign app infected with malware looks more similar to the underlying benign app than an arbitrary benign app. Figure 2.3 plots the exe-cution traces of Firefox, Firefox with malware, and randomly chosen Android pro-cesses along the first two principal components that retain∼99% of the signal. We see that the infected Firefox traces are much closer to those of benign Firefox than to any other Android process likenetd. Hence, false positive rate of an HMD for Firefox should be tested using a benign Firefox – testing the HMD against arbitrary processes [72] will yield wrong results that favor the HMD.
Further, Figure 2.4 shows that driving Android applications using real user-input (red curve) has a major impact on the execution signals compared to giving no input (blue curve) or using the Android ‘Monkey’ app (light brown curve) to generate random inputs. Behaviors with ‘no inputs’ or ‘Android Monkey’ (blue and brown curves) can be easily captured by a behavioral detector, and, as in the pre-vious case, this leads to overestimation of its actual detection performance. Hence, we propose to test HMDs using malicious binaries against appropriate benign apps while both apps are being driven using real user-inputs.
Quantitative Comparison to Prior Evaluation Methods. We have shown in this section that prior ‘black-box’ methods yield traces that donotrepresent either mal-ware or benignmal-ware executions. The prior method has logical flaws – as a result, 20% of malware traces in [72] are shorter than 1 second, and 56% are<10s – and we deliberately eschew further quantitative comparisons with Sherlock. Instead, our
0 10 20 30 40 50 60 70 80 2012 2013 2014 2015 Per cen tag e o f Malwar e Po pu la tio n (%)
Infomation Stealers Networked Nodes Compute Nodes
Figure 2.5: Malware behaviors observed in a 126-family 229-sample Android mal-ware set from Contagio minidump. Most malmal-ware steals data or carries out net-work fraud. However, samples that use phones as compute nodes, e.g., to crack passwords or mine bitcoins, have been reported in 2014.
evaluation focuses on case studies using Sherlockto yield new insights into building effective HMDs.
2.3
Synthesizing Mobile Malware
The first major component of Sherlock generates a diverse population of malicious apps. To do so, we first introduce a taxonomy of high-level malware behaviors, and then use it to create a set of representative malware whose hardware signals have been explicitly diversified.
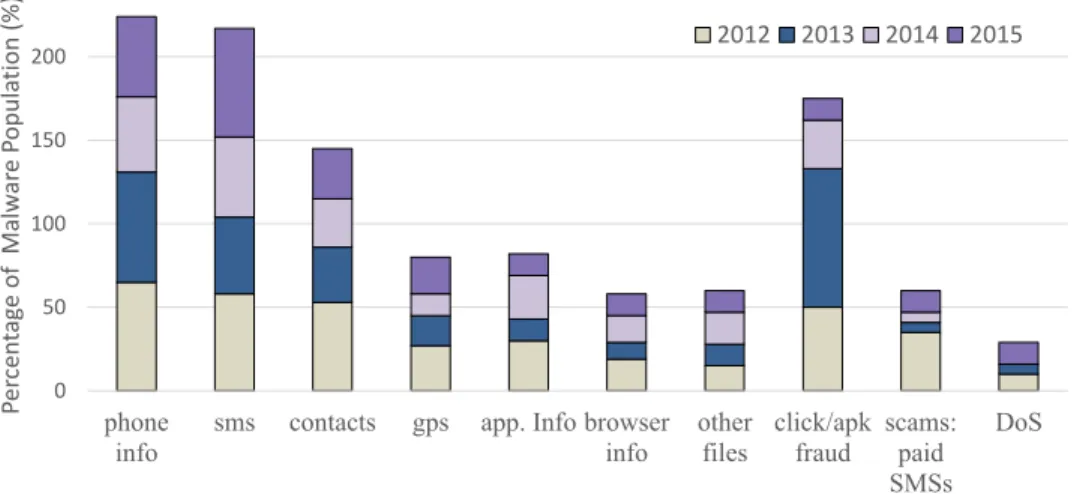
Figures 2.5 and 2.6 show our manual classification of malware into high level behaviors. We studied 53 malware families from 2012, 19 from 2013, 31 from 2014 and 23 from 2015 – a total of 229 malware samples in 126 families –
0 50 100 150 200 phone
info sms contacts gps app. Info browserinfo otherfiles click/apkfraud scams:paid SMSs DoS Per ce n tag e of M al w ar e P opul ati on ( %) 2012 2013 2014 2015
Figure 2.6: Examples of malware behaviors and their contribution to the malware dataset.
downloaded from public malware repositories [27, 28, 33]. Our classification’s goal is to identify orthogonal atomic actions and to determine concrete values for these actions (e.g., amount and rate of data stolen).
To classify malware, we disassembled the binaries (APKs on Android) and executed them on both an Android development board and the Android emulator to monitor: permissions requested by the application, middleware-level events (such as the launch of Intents and Services), system calls, network traffic, and descriptions of malware samples from the malware repositories. We describe our findings below. 2.3.1 Unique Aspects of Mobile Malware
Our key insight is that instead of trying to detect conventional root ex-ploits[13, 16, 44], we propose to detect maliciouspayloads. Here, payloads refer to code that achieves the malware developers’ goals, such as sending premium SMSs,
stealing device IDs or SMSs, etc. We observed root exploits in only 10 of 143 sam-ples in 2012 and 3 of 32 samsam-ples in 2013 – we now take a closer look at the attack vectors mobile malware rely on.
Mobile malware can successfully execute payloads due to vulnerable third-party libraries. In one instance that affected hundreds of millions of users, a “vuln-aggressive” ad-library had a deliberate flaw that led to downloaded files being executed as code [47]. Webviews, that enable Android apps to include HTML/-javascript components, are another major source of vulnerabilities [66] that allows payloads to be dropped to a device. Apps with this vuln-aggressive library or We-bviews are otherwise benign and can be downloaded from app stores as developer signed binaries, only to be compromised when in use.
In other cases, errors by an app’s benign developers themselves can lead to malicious payloads being executed. Misconfigured databases even in popular apps like Evernote [12] and AppLocker [5] (a secure data storage app) were vulnerable to malicious apps on the device simply reading out data from sensitive databases. In such cases, the malicious app could be an otherwise harmless wallpaper app that constructs an ‘Intent’ (a message) to AppLocker’s database at run-time and exfiltrates data if successful.
User errors are another cause for malware payloads executing successfully at run-time. Malicious apps read data from an online server, use it to construct a user prompt at run-time, and thus request sensitive permissions such as access to SMSs or microphone. Users often accept such requests [76] and once authorized, apps can siphon offallSMSs or conduct persistent surveillance attacks [4].
Worst of all, even the platform (Android) code can have severe vulnera-bilities that doesn’t require a conventional exploit. For example, the Master Key vulnerability [30] simply involved an error in how Android resolves a hash colli-sion due to resource-names in a binary at install time v. execution time. By packing the binary with a malicious payload such that the install time check passes but the execution time loader picks the other malicious payload, attackers could distribute their payloads through signed apps in official app-stores.
Finding: analyze payloads instead of exploits. We conclude that while there are many routes to getting a payload to execute as part of a benign app, exe-cuting the payload is mandatory for malware to win. Hence mobile HMDs shoud aim todistinguish malicious payloads from benign app executions. The challenge of detecting payloads is that payloads can look very similar to benign app’s func-tionality. For example, if a previously harmless AngryBirds game starts to comb through a database, can we distinguish whether it is reading a user’s gaming history (harmless) or a user’s SMS database (attack) using only hardware signals.
2.3.2 Behavioral Taxonomy of Mobile Malware
At a high level we assigned every malicious payload to one or more of three behaviors: information stealers, networked nodes, andcompute nodes(Figure 2.6). Information stealers look for sensitive data and upload it to the server. User-specific sensitive data includes contacts, SMSs, emails, photos, videos, and appli-cation specific data such as browser history and usernames, among others. Device-specific sensitive data includes identifiers – IMEI, IMSI, ISDN – and hardware and
network information. The volume of data ranges from photos and videos at the high end (stolen either from the SD card or recorded via a surveillance app) to SMSs and device IDs on the low end.
The second category of malicious apps requires compromised devices to act as nodes in a network (e.g., a botnet). Networked nodes can send SMSs to premium numbers and block the owner of the phone from receiving a payment confirmation. Malware can also download files such as other applications in order to raise the ranking of a particular malicious app. Click fraud apps click on a specific web links to optimize search engine results for a target.
Given the advances in mobile processors, we anticipated a new category of malware that would use mobile devices as compute nodes; for instance, mo-bile counterparts of desktop malware that runs password crackers or bitcoin min-ers on compromised machines. This was confirmed by recent malware that mines cryptocurrencies [32]. We use a password cracker as a compute-oriented malware payload. The cracker’s task is to recover sensitive passwords by making a guess, compute the guess’ cryptographic hash, and compare each hash against a secret database of hashed passwords.
Finding: Software-level actions are surprisingly long in hardware. Fig-ure 2.7 shows the specifics of each malware behavior we currently include in Sherlock. Interestingly, atomic malware payload actions take significant amount of time at the hardware level for several payloads – e.g., stealing even one SMS or a Contact requires 0.12s to 0.36s on average. These constants inform the design of our perfor-mance counter sampling durations and machine learning models in Section 2.4. The
Synthetic Malware Parameters (number of items) Malware-Specific Delay (ms) # of RPKG Mal. Apks Length per Action (sec) Inst. Count (Million) Steal files (4.2MB each) 1, 15, 35, 50 0, 1K, 5K 12 2.86 50.97 Steal contacts 25, 70, 150, 250 0, 10, 25 12 0.36 67.80 Steal SMSs 200, 400, 700, 1.7K 0, 15, 40 12 0.12 25.90 Steal IDs, GPS data size fixed 0, 200 2 4* 39.65 Click fraud (pages) 20, 80, 150, 300 0, 1K, 3K 12 0.40 44.40 DDos (slow loris) 500 connections 1, 40, 80, 200 4 425 49.70 SHA1 pass. cracker 10K, 0.5M, 1.5M, 2.5M 0, 20, 40 12 2.8E-5 1.9E-2 Figure 2.7: Malware payloads: 4 info stealers, 2 networked nodes, and 1 com-pute node. These settings represent a small but computationally diverse subset of malware behaviors. Interestingly, small software actions have large hardware foot-prints.
last two columns in Figure 2.7 show the average length of an atomic action in the malware payload (not counting delays such as being scheduled out by the operating system), and the instruction count per action (e.g. stealing 1 photo/contact/SMS, clicking on 1 webpage in click fraud, opening 500 connections and keeping them alive in a DDoS attack, generating 1 string and computing its hash using SHA1). 2.3.3 Constructing Malware Binaries
We now describe the steps required to create a realistic malware binary. Malware activation can be chosen from being triggered at boot-time, when the repackaged app starts, as a response to user activity, or based on commands sent over TCP by a remote command and control (C&C) server. In all cases, malware communicates back to the C&C server to transfer stolen data or compute results. Sherlock’s configuration parameters also specify network-level intensity of malware
App name Description # of Installs
User Actions User Time (min) CPU Time (min) Inst. Count (Billion) Amazon internet store 10M – 50M
searched for sporting goods; looked through 25 pages; clicked on 50 items 81.15 32.40 1,914.97 Angry Birds game 1M – 5M
played 9 rounds and completed 7 levels
76.97 63.76 1,047.73 CNN news app 5M –
10M
browsed several categories of news and a few articles of each type
58.04 11.60 254.85
Firefox browser 50M – 100M
browsed 20 webpages starting from google.finance
93.96 45.51 1,464.52 Google Maps map service 500M – 1B
browsed maps of a few cities and opened street views
56.09 35.38 768.31 Google Translate translator 500M – 1B translated 30 words, searched history, tried handwriting recognition 59.72 12.12 203.61 Sana MIT Medical medical app U/A completed 5-6 questionnaires 111.41 11.37 145.94 TuneIn Radio internet radio 50M – 100M
switched amongst 6 channels and listened to radio
78.10 26.17 407.99 Zombie
WorldWar
game 1M – 5M
played 5 rounds and completed 4 levels
91.62 88.40 2,261.99
Figure 2.8: Real user inputs on benign apps, with per app traces up to∼2 hours and
∼2 trillion instructions. We choose complex apps and include a mix of compute (games), user-driven (browsers, medical app), and network-centric (radio) apps. payload in terms of data packet sizes and interpacket delays, and device-level in-tensity in terms of execution progress (in terms of malware-specific atomic func-tions completed). We chose concrete parameters for malicious payload based on an empirical study of mobile malware as well as information about benign mobile devices [101].
The generated malware has a top-level dispatcher service that serves as an entry point to the malicious program; it parses the supplied configuration file, launches the remaining services at random times, and configures them. Malicious services can run simultaneously or sequentially depending on the configuration
pa-rameter. In some cases, the service that executes a particular malicious activity can serve as an additional dispatcher. For example, the service executing click fraud spawns a few Java threads to avoid blocking on network accesses. Every spawned thread is provided with a list of URLs that it must access. Besides Android services, we register a listener to intercept sensitive incoming SMS messages, forward them to C&C server, and remove them from the phone if needed. This listener simulates bank Trojans that remove confirmation or two-factor authentication messages sent by a bank to a customer.
Most professional apps are obfuscated using Proguard [17] to deter plagia-rism. Proguard shrinks and optimizes binaries, and additionally obfuscates them by renaming classes, fields, and methods with obscure names. We applied Proguard to the malware payloads (even when we did not use reflection and encryption) to make the payloads look like real applications.
After a malware payload is created, it must be repackaged into a baseline app. Repackaging malware into a baseline app involves disassembling the app (us-ingapktool), and adding information about new components and their interfaces in the application’s Manifest file. We then insert code into the Main activity to start the top-level malware dispatcher service (whose activation trigger is configurable), and add malicious code and data files into the apk. We then reassemble the decompiled app usingapktool. If code insertion has been done correctly, apktool produces a new Android app, which must be signed by jarsigner before deployment on a real device.