Page | 62
UPDATES MADE TO SECTION 4.0
• Added recent hazard events to the previous occurrences for all hazards • Gathered and analyzed any available new data for all hazards
• Combined all of the technological hazards into one hazard category • Combined all of the (remaining) societal hazards into one hazard category • Removed the sub-hazards societal alienation, substance abuse and
economic collapse completely form the risk assessment
• Updated all tables and figures with best available data to better reflect the impacts and risks associated with all hazards, when available
• Made minor editing changes to body of the text
• Included a new table displaying NFIP policy information for St. Lucie County and associated jurisdictions
• Included a new table displaying the CRS classes and activities for participating jurisdictions
• Included most recent maps displaying flood zones, storm surge areas, repetitive loss areas, and critical erosion zones
Page | 63
4.0 HAZARD IDENTIFICATION, VULNERABILITY, AND RISK
The purpose of this chapter is to describe the hazards facing St. Lucie County in terms of potential impact, vulnerability, and loss. The hazards faced in St. Lucie County fit into three general classifications – natural, technological, and societal hazards. Natural hazards include floods, hurricanes/tropical storms, tornadoes, severe thunderstorms and lightning, wildland fires, extreme temperatures, erosion, droughts, seismic hazards, agricultural pests and diseases, and epidemics. Tsunamis are not addressed in this plan because of the low probability of occurrence. According to the State Hazard Mitigation Plan, there have only been four occurrences of tsunamis in Florida since 1886. Technological hazards include radiological accidents, power failures, hazardous materials accidents, transportation system accidents, wellfield contaminations,
communication failures, and military ordnance. Societal hazards include terrorism and sabotage, civil disturbance, and immigration crises.
The hazard identification subsections of this chapter describe each hazard and provide previous occurrences and impacts if available. The hazard identification is based upon current information at the time of this update and do not include updated hazards descriptions anticipated from FEMA in the near future. When available, maps are provided to illustrate the location of the hazards within the county. The vulnerability assessment for each hazard describes the community assets and potential impact for each hazard. A community’s vulnerability depends on the extent of hazard exposure and the value of potentially vulnerable assets. Higher risk areas with higher potential damage warrant mitigation practices that are more extensive. Factors influencing vulnerability include, but are not necessarily limited to a community’s location, type of construction, demographics, and cultural characteristics.
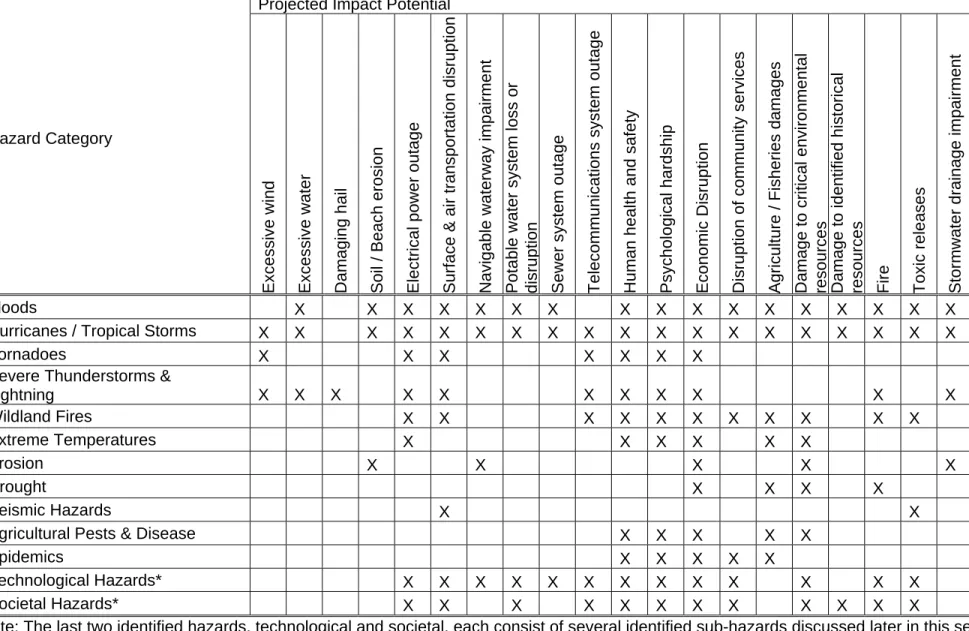
Table 4.1 lists the general hazards to which St. Lucie County is vulnerable and indicates their projected impact potential across the entire spectrum of community exposure and services. The hazards identified in Table 4.1 and discussed here are organized based on the maximum projected impact potential (i.e., hazards capable of producing the maximum community-wide impact, such as hurricanes and floods, are discussed first). This does not mean other identified hazards are less important or less worthy of
Page | 64 Table 4.1. Preliminary identification and projected impact potential for St. Lucie County Hazards
Hazard Category
Projected Impact Potential
Excessi ve wind Excessi ve water Damaging h a il Soil / Beach erosion Electrical po wer outage
Surface & air transportat
ion disruptio
n
Navigable waterway impairment Potable water system
lo ss or disru p tion Sewer syste m outage Telecommu
nications system outage
Human heal
th and safet
y
Psychological hardship Economic Disruption Disruption o
f community service s A griculture / Fisheries d a mages Damage to critica l envir onmental
resources Damage to identified historical resources Fire Toxic relea
s
es
Stormwater drainage
impairment
Floods X X X X X X X X X X X X X X X X X
Hurricanes / Tropical Storms X X X X X X X X X X X X X X X X X X X
Tornadoes X X X X X X X
Severe Thunderstorms &
Lightning X X X X X X X X X X X Wildland Fires X X X X X X X X X X X Extreme Temperatures X X X X X X Erosion X X X X X Drought X X X X Seismic Hazards X X
Agricultural Pests & Disease X X X X X
Epidemics X X X X X
Technological Hazards* X X X X X X X X X X X X X
Societal Hazards* X X X X X X X X X X X X
*Note: The last two identified hazards, technological and societal, each consist of several identified sub-hazards discussed later in this section. Table 4.1 displays the cumulative potential impacts from all sub-hazards contained within each category. Each sub-hazard should have
Page | 65 In order to effectively plan hazard mitigation projects and allocate scarce financial resources, a community’s vulnerability to a specific hazard must be coupled with other critical factors to perform a risk assessment.
Risk, or the likelihood of loss, depends on three elements:
• Probability- How probable is it that a known hazard will produce an impact within the community?
• Vulnerability - How vulnerable is a community to the impacts produced by a known hazard? and
• Exposure - What is the community’s exposure in terms of life and property to the impacts produced by a specific hazard?
In St. Lucie County, the overall exposure was determined by a risk assessment model called MEMPHIS (Mapping for Emergency Management, Parallel Hazard Information System) developed by the FDCA. Several other data sources and risk assessment
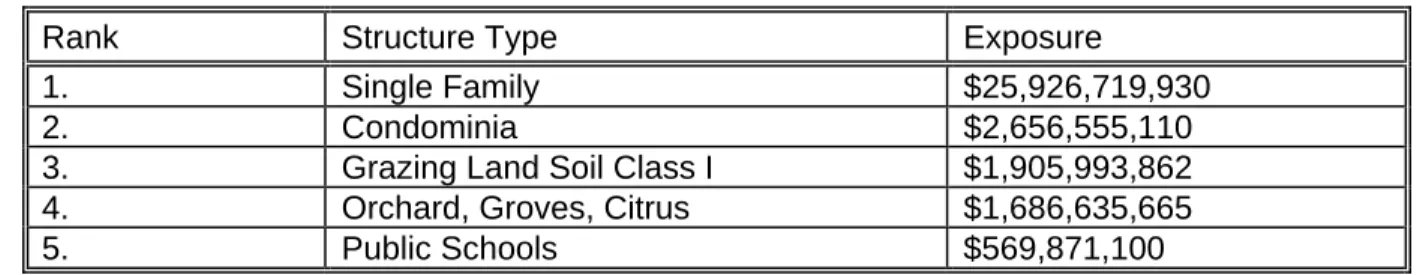
approaches were used to produce “best estimates” for those hazards not included in the MEMPHIS model. These methods include communicating with local officials to produce “best estimate” values and using more recent property appraiser data as a supplement for the MEMPHIS data. Table 4.2 displays the structure types in St. Lucie County with the highest exposure.
Table 4.2. Total exposure by structure type, St. Lucie County, 2009.
Rank Structure Type Exposure
1. Single Family $25,926,719,930
2. Condominia $2,656,555,110
3. Grazing Land Soil Class I $1,905,993,862
4. Orchard, Groves, Citrus $1,686,635,665
5. Public Schools $569,871,100
Source: Florida Department of Community Affairs, 2009 and St. Lucie County Property Appraiser Data, 2009
In terms of natural hazards, there is very little if anything that can be done to change the frequency with which they produce impacts in a community. Mitigation planning relative to natural hazards must therefore focus on reducing the community’s vulnerability or exposure. In terms of technological and societal hazards, the most cost effective type of mitigation is to limit or reduce the frequency with which such hazards actually occur.
At the time of publication, detailed risk assessments were only available for the flood, hurricane, tornado, sinkhole, and wildland fire hazards. Data sources used to prepare the hazard vulnerability and risk assessments are documented in Appendix D.
4.1 NATURAL HAZARDS
St. Lucie County is susceptible to a number of natural hazards with the potential to cause extensive damage within the community. The cost of responding to and recovering from these disasters has proven to be significant. Planning for these events before they occur can significantly reduce costs in the future. This subsection will now analyze those hazards in St. Lucie County identified as naturally occurring.
Page | 66 4.1.1. Floods
4.1.1.1 Hazard Identification
In St. Lucie County, several variations of flood hazards occur due to the different effects of severe thunderstorms, hurricanes, seasonal rains, and other weather-related conditions. For the majority of the County, the primary causes of flooding are hurricanes or tropical storms. However, the County’s low-lying topography, combined with its subtropical climate, make it vulnerable to riverine as well as storm associated flooding.
Flooding in St. Lucie County results from one or a combination of both of the following meteorological events:
1) Tidal surge associated with northeasters, hurricanes, and tropical storms; and 2) Overflow from streams and swamps associated with rain runoff.
When intense rainfall events occur, streams and drainage ditches tend to reach peak flood flow concurrently with tidal water conditions associated with coastal storm surge. This greatly increases the probability of flooding in the low-lying areas of the coastal zone. Areas along the Indian River are particularly susceptible to flooding under these conditions. The most flood prone areas in the eastern portion of the County feature poorly drained soils, a high water table, and relatively flat terrain, all of which contribute to flooding problems. Flat terrain and heavily wooded areas aggravate flood problems by preventing rapid drainage in some areas.
Riverine flooding occurs when the flow of rainwater runoff exceeds the carrying capacities of the natural drainage systems. During extended periods of heavy rainfall, certain low-lying neighborhoods within the County are subject to considerable flood damage and isolation caused by the inability of natural and mechanical drainage systems to effectively remove the water. Heavy rainfalls can cause considerable damage to County infrastructure including: roadbeds, bridges, drainage systems, and the water supply.
The buildup of uncontrolled sediment contributes to the problem of inadequate drainage in natural and mechanical drainage systems. When a storm produces an overwhelming amount of stormwater runoff, the accumulation of loose sediment causes flooding by clogging the drainage systems.
In comparison to riverine flooding, coastal flooding is usually the result of a severe weather system such as a tropical storm or hurricane. The damaging effects of coastal floods are caused by a combination of storm surge, wind, rain, erosion, and battering by debris. All coastal property and inhabitants are subject to severe damage and loss of life resulting from floods caused by hurricane-associated storm surge. Some coastal properties, road arteries, and bridge approaches are subject to severe flooding caused by rare astronomical tides as well.
Frequencies from flooding associated with rain events other than tropical storms and hurricanes are more difficult to estimate. Eastern Florida shows an annual dry cycle stretching from early November through mid-May. During this part of the year, monthly rainfall rarely exceeds 3.5 to 4.0 inches per month. The wet season, beginning in mid-May and
running through late October, shows monthly rainfall levels in the area to be between 6.0 to 8.5 inches. Heaviest rainfall usually occurs in June and September. In St. Lucie County, the eastern or coastal section of the County receives more rain than the western section. This
Page | 67 rainfall pattern coupled with the hurricane season (June through November) makes St. Lucie County particularly vulnerable to flooding associated with tropical storms and hurricanes because they typically occur when the water table is high and the ground is saturated.
4.1.1.2 Previous Occurrences of Floods
Hurricane of September 1903. This hurricane made landfall near West Palm Beach on 11 September 1903 and exited the state near Tampa Bay on 12 September. Maximum recorded windswere only 78 mph; however, 14 deaths were attributed to this storm, and one ship was wrecked near Jupiter, Florida. Damages specific to St. Lucie County are not
recorded.
Hurricane of July 1926. A Category 1 hurricane with winds of 90 mph made landfall near Jupiter, Florida on the morning of 27 July 1926. This hurricane circled inland along Florida’s east coast and exited the State at the Florida-Georgia border on 28 July; by that time it had been downgraded to a tropical storm. St. Lucie County experienced strong winds and flooding.
Hurricane of September 1928. This hurricane made Florida landfall near the City of Palm Beach as a strong Category 4 hurricane with one of the lowest barometric pressures ever recorded in this area (928.9 millibars [27.43 inches]). This was the fifth most intense hurricane ever to make landfall in U.S. territory. It reached Lake Okeechobee with very little decrease in intensity and moved across the lake’s northern shoreline. This sent a massive storm surge southward, flooding lower areas on the southern and western edge of the lake. In all, 1,836 people were killed and another 1,870 injured during this storm’s passage. Nearly all the loss of life was in the Okeechobee area and was caused by overflowing of the lake along its
southwestern shore. While all central Florida was affected by this killer storm, St. Lucie County experienced mainly wind damage and flooding from the associated rains.
Hurricane of September 1933. This major Category 3 hurricane passed over Jupiter Island with a barometric pressure of 947.5 millibars (27.98 in). Maximum winds recorded were 127 mph. There was considerable property damage all along the Florida east coast, mostly in the area between Jupiter and Fort Pierce. Severe waterfront damage was reported in Stuart. Moderate damage was reported from St. Lucie County, including considerable flooding in the lower areas of the County.
Hurricane of August 1939. This weak hurricane made landfall near Fort Pierce on the morning of 11 August and crossed the state in a northwesterly direction, exiting to the Gulf of Mexico near Crystal River on 12 August. Minimal damage and flooding were experienced in St. Lucie County.
Hurricane of June 1945. This hurricane entered Florida from the Gulf of Mexico, making landfall near Cedar Key and moving east-northeast to exit the state near St. Augustine. St. Lucie County received rain and wind from this storm.
Flood of Fall 1947. This flood is generally considered to be the most severe flood recorded in southern Florida. Heavy rainfall, including the rains from two hurricanes, occurred over a period of 5 months. Many parts of St. Lucie County were flooded for months, and there was extensive damage to dairy pastures and agriculture in general. Such a flooding event would be much more significant today because of the increase in land development.
Page | 68
Hurricane of August 1949. This Category 3/Category 4 hurricane made landfall in Florida between Delray and Palm Beach with winds of 130 mph and a barometric pressure of 954.0 millibars (28.17 inches). As it moved inland, its center passed over the northern part of Lake Okeechobee. The levees in that area held, and no major flooding occurred. Damages in Florida were estimated at $45 million. Tides of 11.3 feet at Fort Pierce, 8.5 feet at Stuart, and 6.9 feet at Lake Worth were reported. Stuart sustained severe damage in this storm.
Statewide, over 500 people lost their homes as a result of this storm.
Flood of October 1953. As in 1947, this flood was preceded by 5 months of heavier than normal rainfall, which included a tropical storm in October. June through October rainfall was approximately 48 inches. Damage was heaviest in the beef cattle industry, with extensive losses of improved pasture land, which required supplemental feeding of cattle. Vegetable growers and dairy farmers also suffered significant losses as a result of this flood.
Flood of June 1959. Heavy rains across most of central Florida associated with and following a tropical depression, caused extensive flooding in poorly drained and low-lying agricultural areas and some residential sections. Considerable pasture land and some citrus land in St. Lucie County was inundated. Some highways also sustained damage from these flood waters.
Hurricane (Donna) of September 1960. Hurricane Donna was the sixth most intense U.S. hurricane at landfall. This storm crossed the Florida Keys into the Gulf of Mexico and then turned back toward the northeast and struck the Florida mainland just south of Naples. It then turned north moved across Ft. Meyers, where it turned again to the northeast, moved across the state, and exited Florida just north of Daytona Beach. Rainfall ranged from 5 to 10 inches in an 80- to 100-mile wide belt following this storm’s track. Lakes and streams overflowed their banks and forced the evacuation of many homes throughout central Florida. The high water closed many roads, including portions of Route 60 in Indian River County and Routes 78 and 70 in St. Lucie County, and inundated considerable agricultural land. At least 12 people were killed statewide, and more than 1,794 people were injured.
Hurricane (Agnes) of June 1972. Hurricane Agnes moved through the Gulf of Mexico off Florida’s west coast. While it never struck the central Florida mainland, it spawned the worst severe weather outbreak in Florida history. The outer rainbands covered virtually the entire peninsula and spawned numerous tornadoes. There were 6 people killed and 40 injured in Okeechobee, 1 killed and 7 injured in LaBelle, 40 injured in Big Coppit Key, 2 injured in Bassinger, 3 injured in Haines City, 4 injured in Crystal Springs, 11 injured in Malabar, and 12 injured in Cape Canaveral. Most of those injured lived in manufactured housing. Damage estimates totaled $5 million to public property and $36 million to private property.
Hurricane (David) of September 1979. Hurricane David moved over the Dominican Republic with winds of 165 mph, but weakened drastically before reaching Florida’s east coast. David raked the eastern coast line of Florida from Palm Beach County northward. Officially classed as a minimal hurricane, its strongest winds were offshore when it made landfall
approximately 20 miles south of Melbourne. Tides were 3 to 5 feet above normal along the eye track and 1 to 2 feet above normal elsewhere along the Florida east coast. Light to moderate erosion was reported along the St. Lucie County coastline. Storm rainfall was quite variable from location to location. Totals generally ranged from 6 to 9 inches, but some stations reported as much as 11 inches during the storm’s passage.
Page | 69
The Great Thanksgiving Holiday East Coast Storm of 1984. A strong low pressure system developed east of Florida, and coupled with a high pressure system to the northwest produced an extremely strong pressure gradient leading to gale force winds and high seas along the entire Florida east coast. Heavy rains fell over most of central Florida, and this surface runoff, coupled with the wind packing of seawater along the coast resulted in extensive coastal erosion and flooding. Many coastal structures were damaged or destroyed including several in St. Lucie County.
Flood of September 1985. Between 20 and 24 September 1985, approximately 14 inches of rain fell in the City of Fort Pierce, 7 inches during a 7-hour period over the night of 20 September. Flooding of streets and houses was widespread, especially in the central areas around Five Mile Creek and Ten Mile Creek. Large numbers of people were evacuated from their homes. Flood elevations during this storm approximated the hundred year levels and were greater in many locations.
Flood of January 1989. On 21 and 22 January 1989, St. Lucie County experienced a gale with subtropical storm characteristics that caused extensive beach erosion and dropped 4 to 6 inches of rain across the County. This caused ponding of water in low-lying areas. Several homes were damaged. Road flooding caused several accidents.
Hurricane Andrew of August of 1992. Andrew was a small and ferocious Cape Verde hurricane that wrought unprecedented economic devastation along a path through the northwestern Bahamas, the southern Florida peninsula, and south-central Louisiana. Damage in the U.S. is estimated to be near $25 billion, making Andrew one of the most expensive natural disasters in U.S. history. The tropical cyclone struck southern Dade County, Florida, especially hard, with violent winds and storm surges characteristic of a Category 4 hurricane on the Saffir/Simpson Hurricane Scale, and with a central pressure (922 millibars) that is the third lowest this century for a hurricane at landfall in the U.S. In Dade County alone, the forces of Andrew resulted in 15 deaths and up to one-quarter million people left temporarily homeless. An additional 25 lives were lost in Dade County from the indirect effects of Andrew. The direct loss of life seems remarkably low considering the destruction caused by this hurricane.
Tropical Storm (Gordon) of October 1994. Following a similar track to Hurricane Donna of 1960, Tropical Storm Gordon crossed the Florida Keys into the Gulf of Mexico and then turned back to the northeast and struck the mainland Florida peninsula near Fort Myers on 13 October. It moved across the state and exited Florida into the Atlantic just north of
Vero Beach on 16 October. Although the maximum sustained winds reported from Gordon were only 53 mph, the storm caused 8 deaths and 43 injuries.
St. Lucie County had experienced a period of extensive growth during the 1970’s and 1980’s. Most of this growth took place in the form of residential and commercial land development in the eastern and southern portion of the County close to the Intracoastal Waterway and St. Lucie River. The rain event associated with Tropical Storm Gordon in October 1994 was the most significant rain event to occur after this period of development. Essentially, the County received 17+ inches of rain over a 3-day period. Rainfall was not evenly dispersed over the whole County.
Statewide, damages associated with Gordon totaled over $400 million. Agricultural interest sustained $275 million in damages primarily from the widespread flooding. Vegetable and citrus crops were damaged particularly hard. Exacerbating the flooding associated with Tropical Storm Gordon was the fact that prior to October 1994 St. Lucie County had a very wet
Page | 70 year. Rainfall recorded through September of that year had reached 74 inches before the Gordon event occurred. Altogether, St. Lucie County received approximately 100 inches of rain in 1994, making that year the wettest year since 1913.
Hurricane (Erin) of August 1995. Hurricane Erin made landfall near the Sebastian Inlet on 2 August1995. Brevard County bore the brunt of this storm with sustained winds of approximately 100 mph. While St. Lucie County was spared most of the damages associated with Erin’s wind field, heavy rains of up to 8 inches in 3 hours were associated with the
backside of this storm, and flooding occurred in low-lying areas along the County’s northern edge.
The Unnamed Storm ofOctober 1995. Almost exactly 1 year after the Tropical Storm Gordon flooding incident in 1994, a stalled frontal system dropped over 15 inches of rain on St. Lucie County over a period of 39 hours. In the intervening year between these two events, some communities in the southern part of St. Lucie County had conducted a number of mitigation projects and initiatives designed to improve drainage and prevent flooding in known flood prone areas.
Tropical Storm (Mitch) of October 1998. Hurricane Mitch was one of the deadliest storms in Atlantic history. By the time it reached Florida on 4 and 5 November 1998, it had been downgraded to a tropical storm. St. Lucie County received significant rains from this storm, which passed almost directly over the southern part of the County. Extensive
agricultural damage was reported throughout western St. Lucie County, and significant flooding again occurred in the Port St. Lucie area.
Hurricane Floyd of September 1999. This large Category 4 storm moved parallel to the southeast Florida coast. While the storm did not make landfall in Florida, it did impact Florida coastal communities. Peak gusts associated with the storm were estimated to be as high as 155 mph. Fifty-seven deaths and $1.3 billion in insured losses were attributed to the storm. Readings taken in Fort Pierce indicate that sustained winds were 33 mph, and peak wind gusts were up to 49 mph. The City of Fort Pierce experienced flooding and property damage during this event. The City of Port St. Lucie activated a special needs shelter and was federally declared. Damages in the City were estimated around $100,000.
Hurricane Irene of October 1999. This Category 2 hurricane made landfall in the Keys and moved north, heading back out to sea at the Jupiter Inlet. Insured property losses in Dade, Broward, and Palm Beach counties exceeded $600 million. Total insured losses from the rest of the state totaled $200 million. Over 700,000 customers were left without power following the storm. Readings taken in Fort Pierce indicate that sustained winds were 42 mph, and peak wind gusts were up to 51 mph. The City of Fort Pierce sustained both flooding and wind damage during Irene. The FPUA incurred over $1.3 million in damage to a 12-inch water main on South AIA and a 36-inch sewer line at the wastewater treatment plant. The City of Port St. Lucie experienced flooding citywide and was federally declared with an estimated $100,000 in damage.
Tropical Storm Leslie of October 2000. This tropical storm mainly impacted Miami-Dade and Broward counties, causing $700 million in damage, $500 million of which were agricultural crop losses.
Hurricane Gabrielle of September 2001. This hurricane made landfall on the west coast of Florida and traveled northeast across the state. The storm spawned a total of 18
Page | 71 tornadoes in the state. Insured losses associated with this storm totaled $115 million. Total damage is estimated to be nearly $230 million. Readings taken in Fort Pierce indicate that sustained winds reached 26 mph, and peak wind gusts were up to 37 mph. Rain meters in Fort Pierce indicated 1.97 inches of rainfall during this period.
The City of Port St. Lucie, directed by the City Council, has installed swale liners and supported the maintenance of roads that experience chronic flooding. The City also has a proactive drainage management program to maintain drainage basins.
Hurricane Charley of August 2004. This hurricane increased in strength to become a category 4 hurricane just before making landfall on Florida’s southwest coast just north of Captiva. At the time of the storm, the hurricane was the second strongest hurricane to it the United States since Andrew in 1992. Damage in the U.S. is estimated to be $14 billion. Readings taken in Fort Pierce indicate that sustained winds reached 21 mph, and peak wind gusts were up to 26 mph.
Hurricane Frances of September 2004. Roughly three weeks after Hurricane Charley made landfall in Florida, this hurricane made landfall near the southern portion of St. Lucie County as a category 2 storm on September 5. This hurricane produced a significant storm surge, with a highest measured peak of 5.89 ft above mean sea level at the St. Lucie Lock. This hurricane was directly responsible for 5 deaths in Florida and indirectly responsible for an additional 32 deaths in Florida. Readings taken in Fort Pierce indicate that sustained winds reached 70 mph, and peak wind gusts were up to 94 mph. The total property damage (for all affected counties) reported from this storm was $4.8 billion, with an additional $93.2 million in crop damage.
Hurricane Ivan of September 2004. This storm originally made landfall in the U.S. as a category 3 hurricane just west of Gulf Shores, Alabama on September 16. After passing through most of the eastern half of the U.S., the storm reentered into the Atlantic Ocean and then started to head directly south. On the morning of September 21, the then sub-tropical storm made landfall in south Florida, becoming the third major rainfall event to affect St. Lucie County in less than two months.
Hurricane Jeanne of September 2004. Only five days after the remnants of Hurricane Ivan passed through south Florida, this storm made landfall as a category 3
hurricane near the southern portion of St. Lucie County just miles away from where hurricane Frances had three weeks prior. This storm was the first major hurricane (category 3 or higher) to make landfall between Palm Beach and the mouth of the Savannah River since 1899. Readings taken in Port St. Lucie indicate that sustained winds reached 49 mph, and peak wind gusts were up to 74 mph. Readings taken in the Fort Pierce Inlet indicate that peak gusts were up to 111 mph. Over the three day period (25 September – 27 September), it is estimated that 7 inches of rain fell in Fort Pierce. The total damage reported for St. Lucie County was
estimated at $1.2 billion.
Hurricane Katrina of August 2005. This storm first made landfall in the U.S. as a category 1 storm near the border of Miami-Dade and Broward County on August 25. After quickly passing across the main body of Florida, the storm began to strengthen as it traveled over the warm waters of the Gulf of Mexico. By August 28, the storm strengthened to a category 5 with winds around 170 mph. On August 29, Katrina made its final landfall near the mouth of the Pearl River at the Louisiana/Mississippi border. To date, this storm is the costliest
Page | 72 natural disaster in the United States. Updated damage reports estimate a total of $125 billion in losses. Direct and indirect loss of life estimates caused by this storm total 1,833.
Hurricane Wilma of October 2005. Hurricane Wilma was the most intense hurricane ever recorded in the Atlantic basin. By the time it made landfall in Florida at Cape Romano, it had weakened but remained a major hurricane with sustained winds of 120 mph. Sustained winds at the Florida landfall, according to some sources, might have been stronger. Its large eye remained well-organized as it crossed the state and weakened to winds of 110 mph after entering the Atlantic Ocean near Jupiter, Florida. Rainfall in St. Lucie County was estimated to be between 5 to 7 inches. Highest estimated wind gusts were 160 mph.
Tropical Storm Fay of August 2008. This storm made landfall on the southwest coast of Florida near Everglades City on August 19 with wind speeds of approximately 63 mph. Soon after making landfall, the storm’s directional speed slowed significantly to speeds around 3-4 mph. This slow moving storm system remained over the main body of Florida for nearly 3 full days producing heavy amounts of rainfall and flooding in numerous counties throughout Florida. Rain meters in Fort Pierce indicated 14.7 inches of rainfall from this storm.
4.1.1.3 Flooding Vulnerability Assessment
Flooding events can have the following potential impacts within a community: • Excessive water;
• Soil/beach erosion; • Electric power outage;
• Surface and air transportation disruption; • Navigable waterway impairment;
• Potable water system loss or disruption; • Sewer system outage;
• Human health and safety; • Psychological hardship; • Economic disruption;
• Disruption of community services; • Agricultural/fisheries damage;
• Damage to critical environmental resources; • Damage to identified historical resources; • Fire;
• Toxic releases; and
• Stormwater drainage impairment. 4.1.1.4 Flooding Location
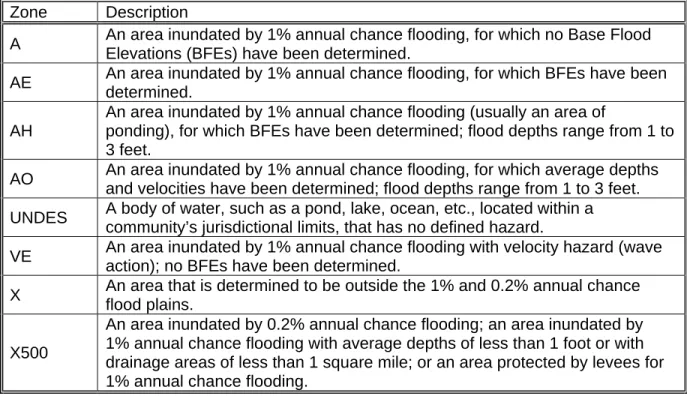
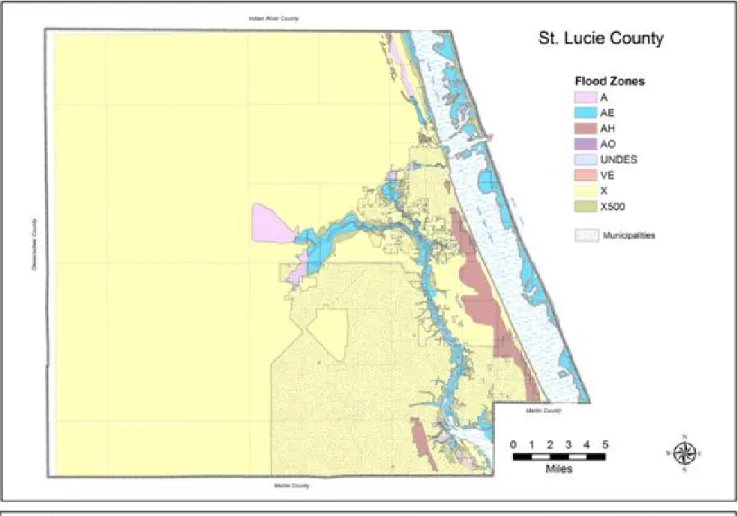
National Flood Insurance Program (NFIP). In response to mounting losses from flooding nationwide, the U.S. Congress initiated the National Flood Insurance Program (NFIP) in 1968. The program is administered through FEMA. Under this program, FEMA produces Flood Insurance Rate Maps (FIRMs), which show areas subject to various levels of flooding under different conditions (see Figure 4.1; see Table 4.3 key for figure). This flood risk information is based on historic, meteorological, hydrologic, and hydraulic data, as well as open-space
conditions, flood control works, and development. The current FIRMs for St. Lucie County and the associated jurisdictions were updated on 30 June 1999. Flood plains designated on the FIRMs are based on the 1% annual flood chance or the 100-year flood event. The 500-year
Page | 73 flood event with a 0.2% annual chance of occurrence is used to designate other areas of the community, which may have some vulnerability to flooding.
Table 4.3. Key for Figure 4.1. Zone Description
A An area inundated by 1% annual chance flooding, for which no Base Flood Elevations (BFEs) have been determined.
AE An area inundated by 1% annual chance flooding, for which BFEs have been determined.
AH
An area inundated by 1% annual chance flooding (usually an area of
ponding), for which BFEs have been determined; flood depths range from 1 to 3 feet.
AO An area inundated by 1% annual chance flooding, for which average depths and velocities have been determined; flood depths range from 1 to 3 feet. UNDES A body of water, such as a pond, lake, ocean, etc., located within a
community’s jurisdictional limits, that has no defined hazard.
VE An area inundated by 1% annual chance flooding with velocity hazard (wave action); no BFEs have been determined.
X An area that is determined to be outside the 1% and 0.2% annual chance flood plains.
X500
An area inundated by 0.2% annual chance flooding; an area inundated by 1% annual chance flooding with average depths of less than 1 foot or with drainage areas of less than 1 square mile; or an area protected by levees for 1% annual chance flooding.
Page | 74 As can be seen from the FIRM map; the areas of St. Lucie County that are most susceptible to flooding are the barrier islands and those areas bordering the Indian River Lagoon, the St. Lucie Savannahs, and the St. Lucie River and its tributaries.
Figure 4.2 delineates storm surges zones for Category 1, Category 3 and Category 5 storms. This map demonstrates that the barrier islands and areas bordering the Indian River Lagoon and the St. Lucie River are most susceptible to storm surge. According to the Florida
Assessment of Coastal Trends, 52% of residents in St. Lucie County live in the Category 1 Surge Zone (FDCA, 2000).
Page 75
Page | 76 St. Lucie County has identified 50 specific areas within the unincorporated portion of the
County where stormwater drainage is a known problem. Identified flood prone roadways consist of the following:
In the Indian River Estates area • Easy Street; • Savannah Street; • Howard Street; • Bradley Street; • Myrtle Drive; • Seagrape Drive; • Palm Drive; • Birch Drive; • Hickory Drive; • Sunset Drive; • Raintree Trail; • Tangelo Drive; • Spruce Drive; • Cassia Drive; • Bamboo Drive; • Balsam Drive; • Papaya Drive; and • Yucca Drive. In the White City area • Citrus Avenue; • Oleander Avenue; • Osceola Drive; • Seminole Drive; • Coral Street; • Echo Street; • Saeger Avenue; • Flood Road; • Buckeye Drive; • Gopher Ridge Road; • Fleetwood Lane; • Kingswood Lane; and • Driftwood Lane. Other unincorporated areas
• Bell Avenue at South 25th Street; • Lennard Road at Walton Road; • Deerwood Lane;
• Rosewood Lane; • Lakewood Park;
Page | 77 Within the City of Fort Pierce, the following areas have been identified as flood prone:
• Oleander Boulevard and the streets east to U.S. Highway 1 between Georgia Avenue and Emil Drive;
• South 15th Street; • South 16th Street; • South 3rd Avenue; • Shamrock Road; • Kelly Court; • Hispana Avenue;
• The intersection of Wyoming Avenue and South 13th Street; • The intersection of 25th Street and Virginia Avenue;
• The intersection of South 33rd Street and Okeechobee Road; • South 33rd Street between Dairy Road and Orange Avenue; • The intersection of South 10th Street and Georgia Avenue; • The intersection of South 10th
Street and Florida Avenue; • The intersection of South 10th
Street and Delaware Avenue; • The intersection of Delaware Avenue and Court Street; • The intersection of Delaware Avenue and South 7th Street; • The intersection of South 7th Street and Georgia Avenue; • The intersection of South 6th Street and Georgia Avenue; • The intersection of South 5th Street and Florida Avenue; • The intersection of South 7th Street and Boston Avenue; • The intersection of South 6th Street and Citrus Avenue; • The intersection of South 5th Street and Boston Avenue; • The intersection of South 5th Street and Orange Avenue; • The intersection of 9th Street and Avenue D;
• The intersection of Means Court and Avenue D; • The intersection of 13th Street and Avenue D;
• The intersection of Indian River Drive and Terminal Drive; • Indian River Drive from 2nd Street to Seaway Drive; • The intersection of 13th Street and Mobiles Terrace; • The intersection of 18th Street and Avenue I;
• Avenue G from 22nd to 24th Street; • Avenue I from 22nd to 24th Street;
• Avenue K from North 19th Street to North 24th Street; • Avenue M from North 19th Street to North 21st Street; and • The intersection of North 17th Street and Avenue M.
Within the City of Port St. Lucie, the following areas have been identified as flood prone:
• Zullo Street (Section 19); • South of Section 39;
• Airoso Boulevard and Eyerly Avenue; • Gatlin Boulevard;
• Westmoreland Boulevard;
• Walton Road (an evacuation route from Hutchinson Island to U.S. 1); • California and Savona Boulevard Intersection;
Page 78
• N1 Basin in St. Lucie West; • Watersheds A and B; and
• Eastern watershed (east of U.S. Highway 1).
In addition to these identified flood prone areas, only two pump stations, the Tiffany Pump Station and the Blackwell Pump Station, handle stormwater from all of Sections 29, 30, and 40, which encompass the Mid Port area. If either of these pump stations fail, there will be extensive flooding in the Mid Port area.
Flood Water Sources. Sources of flood waters in St. Lucie County include: • The Atlantic Ocean;
• The Fort Pierce Inlet;
• The St. Lucie Inlet and North Fork of the St. Lucie River; • Ten Mile Creek;
• Taylor Creek; • Moores Creek; • Five Mile Creek; • Platts Branch; • Blakes Lee Creek; • Winters Creek; • Canal C-25; • Canal C-24; and • Canal C-23.
4.1.1.5 Flooding Risk Assessment
Flooding is the single hazard producing the most recurrent impacts in St. Lucie County. All communities within St. Lucie County are vulnerable to both hurricanes and flooding, but they are not all vulnerable for the same reasons. The barrier island communities such as the Fort Pierce beach area and the unincorporated areas of Hutchinson Island obviously are highly vulnerable to both wind and storm surge damage from hurricanes. Due to the presence of the Fort Pierce Inlet, mainland Fort Pierce also is highly vulnerable to flooding associated with hurricane winds and storm surge. MEMPHIS maps indicate storm surge of greater than 21 feet potentially can be experienced on the barrier islands and communities bordering the Indian River Lagoon. Central Port St. Lucie and the White City area are vulnerable to storm surge related flooding along the North Fork of the St. Lucie River and the canals in those areas. Wind packing of the water within the Indian River Lagoon also may produce substantial flooding along low-lying river front property away from the inlet. Communities away from the water such as St. Lucie West, Lakewood Park, and the unincorporated areas north of Fort Pierce along U.S. Highway 1, are more vulnerable to wind damage from hurricanes and flooding associated with rain rather than storm surge.
Flooding other than that associated with storm surge usually results from heavy rainfall events occurring in association with stalled fronts, tropical storms, and occasionally hurricanes. Not all of the area within any given jurisdiction is equally vulnerable to flooding, but all jurisdictions have specific areas where flooding is a recurring problem.
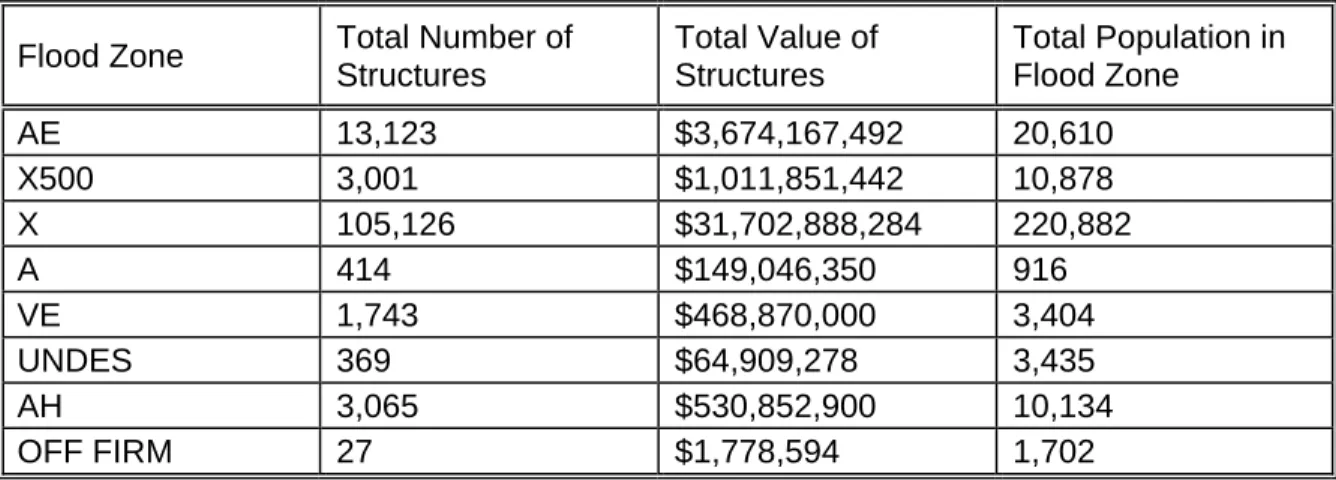
The following risk assessment data for flooding in St. Lucie County are based on data developed for the MEMPHIS model and St. Lucie County Property Appraiser data. Table 4.4 illustrates the number and value of structures in each of the FEMA-identified flood zones. The zone with the highest number of structures and structure value is the X zone, which is
Page | 79 known as the 500-year flood zone. Table 4.3 on Page 4-12 describes the definitions of each of the FEMA flood zones.
Table 4.4. Flooding exposure, St. Lucie County, 2009. Flood Zone Total Number of
Structures Total Value of Structures Total Population in Flood Zone AE 13,123 $3,674,167,492 20,610 X500 3,001 $1,011,851,442 10,878 X 105,126 $31,702,888,284 220,882 A 414 $149,046,350 916 VE 1,743 $468,870,000 3,404 UNDES 369 $64,909,278 3,435 AH 3,065 $530,852,900 10,134 OFF FIRM 27 $1,778,594 1,702
Source: Florida Department of Community Affairs, 2009 and St. Lucie County Property Appraiser Data, 2009.
Table 4.5 illustrates the total number and value of structures as well as the population expected to be flooded given certain annual storm event levels.
Table 4.5 Flood exposure, St. Lucie County, 2009.
Exposure 100 Year Event 50 Year Event 25 Year Event 10 Year Event Number of Structures in Flood 16,853 14,784 11,038 777 Estimated Loss in Value* $3,421,997,154 $2,463,085,864 $1,225,902,277 $312,116,224 Population in Flood 16,898 16,882 13,577 2,502
*Based on FDCA percent loss estimates for wind and rain; maxima estimates
Source: Florida Department of Community Affairs, 2009 and St. Lucie County Property Appraiser Data, 2009.
Table 4.6 displays the flood exposure associated with the five different hurricane intensities in St. Lucie County.
Table 4.6. Hurricane flood exposure, St. Lucie County, 2009.
Exposure Category 5 Category 4 Category 3 Category 2 Category 1 Number of Structures in Flood 75,700 39,957 16,765 14,794 9,271 Estimated Loss in Value* $22,186,574,960 $14,026,427,89 8 $6,430,346,3 02 $2,654,868,1 22 $864,900,379 Population in Flood 159,599 78,652 18,343 16,883 9,144
Page | 80 Source: Florida Department of Community Affairs, 2009 and St. Lucie County Property
Appraiser Data, 2009.
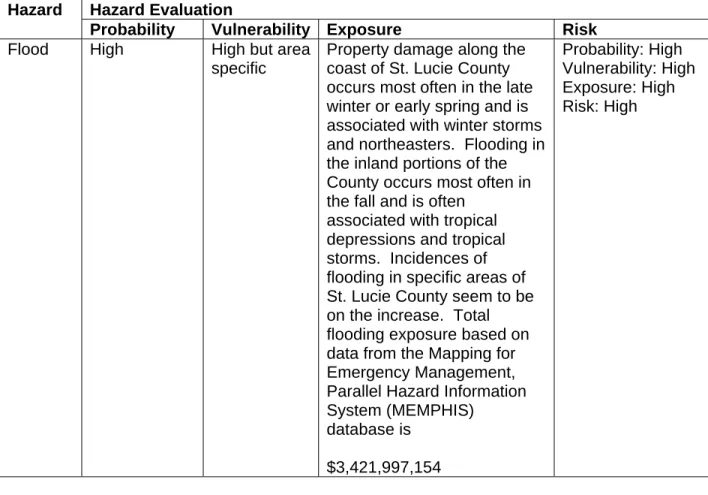
Table 4.7 summarizes St. Lucie County’s risk or potential for loss relative to flooding. Table 4.7 Flood Hazard Evaluation
Hazard Hazard Evaluation
Probability Vulnerability Exposure Risk Flood High High but area
specific
Property damage along the coast of St. Lucie County occurs most often in the late winter or early spring and is associated with winter storms and northeasters. Flooding in the inland portions of the County occurs most often in the fall and is often
associated with tropical depressions and tropical storms. Incidences of flooding in specific areas of St. Lucie County seem to be on the increase. Total flooding exposure based on data from the Mapping for Emergency Management, Parallel Hazard Information System (MEMPHIS) database is $3,421,997,154 Probability: High Vulnerability: High Exposure: High Risk: High
4.1.1.6 National Flood Insurance Program(NFIP) and Community Rating System(CRS) All of the jurisdictions represented by the St. Lucie County LMS are active participants in the NFIP. Table 4.8 displays NFIP policy information for each participating jurisdiction.
Table 4.8 NFIP policy information for St. Lucie County and associated jurisdictions. Community Name Policies
In-Force Insurance In-Force
Number of Paid Losses
Total Losses Paid
St. Lucie County 13,458 $2,805,909,300.00 1,389 $36,035,994.00 City of Fort Pierce 5,619 $894,695,700.00 730 $27,974,695.44 City of Port St.
Lucie 6,393 $1,569,649,600.00 148 $1,441,313.73
Town of St. Lucie
Village 118 $31,153,400.00 58 $2,349,744.23
Page | 81 The Community Rating System (CRS) is a voluntary incentive program that recognizes and encourages community floodplain management activities that exceed minimum NFIP
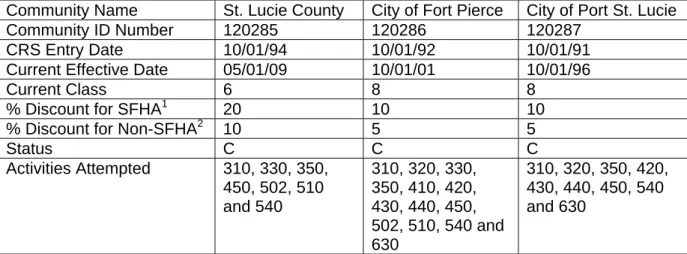
requirements. Any community that participates in the NFIP may elect to participate in the CRS. The goals of the CRS include reducing flood losses, facilitating accurate insurance ratings and promoting the awareness of flood insurance (FEMA, 2009). The incentives take the form of reductions on insurance premiums in 5% increments. A community’s CRS class ranges from 10 (0% reduction) to 1 (45% reduction). Table 4.9 displays CRS classes and activities for St. Lucie County and the associated jurisdictions. Three of the four jurisdictions represented by this LMS currently participate in the CRS. The Town of St. Lucie Village is currently in the process of applying for a CRS class rating.
Table 4.9 CRS classes and activities for St. Lucie County and associated jurisdictions. Community Name St. Lucie County City of Fort Pierce City of Port St. Lucie
Community ID Number 120285 120286 120287
CRS Entry Date 10/01/94 10/01/92 10/01/91
Current Effective Date 05/01/09 10/01/01 10/01/96
Current Class 6 8 8
% Discount for SFHA1 20 10 10
% Discount for Non-SFHA2 10 5 5
Status C C C Activities Attempted 310, 330, 350, 450, 502, 510 and 540 310, 320, 330, 350, 410, 420, 430, 440, 450, 502, 510, 540 and 630 310, 320, 350, 420, 430, 440, 450, 540 and 630
In order to ensure continued compliance with the NFIP, each jurisdiction will:
• Continue to enforce their adopted Floodplain Management Ordinance requirements, which include regulating all new development and substantial improvements located in the Special Flood Hazard Areas (SFHA)
• Ensure that each jurisdiction has an office and staff person designated as the Floodplain Administrator
• Continue to update the floodplain ordinance upon receiving new data from FEMA
• Continue to educate the public about the importance of flood hazards and the availability of flood insurance
• Continue to maintain or enhance their Community Rating System (CRS) scores In an additional effort to ensure continued compliance with the NFIP, the City of Port St. Lucie has included a six (6) inch freeboard above base flood elevation (BFE) for all new residential structures within their current Floodplain Ordinance. This ordinance is very significant considering the fact that a majority of the recent population growth and new construction has occurred within and proximate to the City of Port St. Lucie.
As part of the NFIP and CRS programs, FEMA documents repetitive flood losses. For this analysis, documented repetitive losses are restricted to the narrow FEMA definition and represent only those properties whose owners have made more than one claim on their flood insurance policies as recorded by the NFIP.
Page | 82 As of September 2008, the unincorporated area of St. Lucie County had a total of 132 repetitive loss properties with a total of 317 repetitive losses. The City of Fort Pierce had 119 repetitive loss properties with a total of 246 repetitive losses. There were four repetitive loss properties reported from the Town of St. Lucie Village with a total of nine repetitive losses. The City of Port St. Lucie showed a total of eight repetitive loss properties with a total of 17 repetitive losses. Table 4.10 documents the number of repetitive flood loss properties by jurisdiction and type. All repetitive loss properties within the County are residential properties. Table 4.10 Repetitive loss properties for St. Lucie County and associated jurisdictions
Community St. Lucie County City of Fort Pierce City of Port St. Lucie Town of St. Lucie Village Community No. 120285 120286 120287 120288 No. of Repetitive Loss Properties 132 119 8 4 No. of Claimed Repetitive Losses 317 246 17 9 Total Building Payment $15,802,486 $7,687,574 $77,502 $12,605 Total Content Payment $1,744,305 $2,119,789 $12,605 $51,870
Figure 4.3 shows the location of repetitive loss areas throughout St. Lucie County.
Page | 83 4.1.2 Hurricanes / Tropical Storms
4.1.2.1 Hazard Identification
Hurricanes are tropical cyclones with winds that exceed 74 mph and blow counter-clockwise about their centers in the Northern Hemisphere. They are essentially heat pumping mechanisms that transfer the sun’s heat energy from the tropical to the temperate and polar regions. This helps to maintain the global heat budget and sustain life. Hurricanes are formed from thunderstorms that form over tropical oceans with surface temperatures warmer than 81° Fahrenheit (26.5° Celsius). The ambient heat in the sea’s surface and moisture in the rising air column set up a low pressure center and convective conditions that allow formation of self sustaining circular wind patterns. Under the right conditions, these winds may continue to intensify until they reach hurricane strength. This heat and moisture from the warm ocean water is the energy source of a hurricane. Hurricanes weaken rapidly when deprived of their energy source by traveling over land or entering cooler waters.
When a hurricane threatens the coast, advisories are issued by the National
Hurricane Center (NHC). The storm’s current location and intensity are described along with its projected path. Advisories are issued at 6-hour intervals: 5:00 A.M., 11:00 A.M., 5:00 P.M., and 11:00 P.M., Eastern Time.
In addition to advisories, the NHC may issue a hurricane watch or warning. A hurricane watch indicates that hurricane conditions are a possibility and may threaten the area within 48 hours. A hurricane warning is issued when winds of at least 74 mph are to be expected in the area within 36 hours.
Advisories and hurricane watches and warnings will frequently refer to the category of the storm. Hurricanes are classified using the Saffir-Simpson Wind Scale as follows:
• Category 1: Winds 74 to 95 mph • Category 2: Winds 96 to 110 mph • Category 3: Winds 111 to 130 mph • Category 4: Winds 131 to 155 mph • Category 5: Winds more than 155 mph
Florida is the most vulnerable state in the nation to the impacts of hurricanes and tropical storms. South central Florida is particularly exposed to the dangers presented by hurricanes due to its topography. The region is largely a flat, low-lying plain. The potential for property damage and human casualties in St. Lucie County has been increased by the rapid growth of the County over the last few decades, particularly along the coastline.
Florida not only has the most people at risk from hurricanes, but it also has the most coastal property exposed to these storms. Over the 20-year period between 1980 and 2000, Florida’s population increased by 68%, while the value of insured residential property rose from $178 billion in 1980 to $882 billion in 2002, an increase of 395%. Between 1980 and 1993, the insured value of commercial property rose from $155 billion to $453 billion, an increase of 192%.
Hurricane damage occurs through two means: 1) high winds and 2) storm surge. Generally it is the wind that produces most of the property damage associated with hurricanes, while the greatest threat to life is from flooding and storm surge. Although hurricane winds can exert tremendous pressure against a structure, a large percentage of hurricane damage is caused
Page | 84 not from the wind itself, but from flying debris. Tree limbs, signs and sign posts, roof tiles, metal siding, and other loose objects can become airborne missiles that penetrate the outer shells of buildings, destroying their structural integrity and allowing hurricane winds to act against interior walls not designed to withstand such forces. Once a structure’s integrity is breached, the driving rains associated with hurricanes can enter the structure and completely destroy its contents.
Hurricane winds generate massive quantities of debris that can easily exceed a community’s entire solid waste capacity by three times or more. Debris removal is an integral first step toward recovery, and as such, must be a critical concern of all those tasked with emergency management and the restoration of community services.
A storm surge is a large dome of water often 50 to 100 miles wide and rising anywhere from 4 to more than 20 feet. The National Hurricane Center and the National Ocean and Atmospheric Administration are currently revamping storm sure catagories. The Saffir-Simpson scale has been modified to the Saffir-Simpson Wind Scale and no longer includes storm surge or central pressure as factors in categorizing hurricanes. The storm surge arrives ahead of the storm’s actual landfall, and the more intense the hurricane is, the sooner the surge arrives. Water rise can be very rapid, posing a serious threat to those who have waited to evacuate flood prone areas. A storm surge is a wave that has outrun its generating source and become a long period swell. The surge is always highest in the right-front quadrant of the direction the
hurricane is moving in. As the storm approaches shore, the greatest storm surge will be to the north of the hurricane eye.
Damage during hurricanes may also result from possible spawned tornadoes and inland flooding associated with heavy rainfall that usually accompany these storms. Hurricane Andrew, a relatively “dry” hurricane, dumped 10 inches of rain on south Florida and left many buildings extensively water damaged. Rainwater may seep into gaps in roof sheathing and saturate insulation and ceiling drywall, in some cases causing ceilings to collapse.
Crop damage is another powerful effect of hurricanes and tropical storms. Tropical Storm Mitch dropped as much as 10 inches of rain in some south Florida areas, which resulted in approximately $20 million in crop damage in Palm Beach County alone (Associated Press, 1998). According to the 2008 Florida Statistical Abstract, of St. Lucie County’s 452,520 total land acreage, 221,537 acres are farmland. With 49% of its land area being farmed, St. Lucie County is particularly vulnerable to crop damage resulting from the wind and rain from
hurricanes and tropical storms.
4.1.2.2 Previous Occurrences of Hurricanes / Tropical Storms
An extensive list of hurricanes/tropical storms that may have affected St. Lucie County is provided in the previous Section 4.1.1.2. From 1930 through 1959, a total of 58 hurricanes struck the U.S. mainland; 25 of which were Category 3 or higher (major storms). Between 1960 and 1989, 43 hurricanes struck the U.S. of which only 16 were Category 3 or stronger. Most hurricane experts feel we are entering a period of increased hurricane formation similar to the levels seen in the 1930’s and 1940’s. Current hurricane risk calculations are complicated by climatic factors suggesting the potential for even greater hurricane frequency and severity in all of the world’s hurricane spawning grounds. Between 2000 and 2008, there were 71 Atlantic hurricanes (not all made landfall) and there were 15 in 2005 alone (most ever in a single season). Global warming may cause changes in storm frequency and the precipitation rates associated with storms. A modest 0.9º Fahrenheit (0.5º
Page | 85 Celsius) increase in the mean global temperature will add 20 days to the annual hurricane season, and increase the chances of a storm making landfall on the U.S. mainland by 33%. The warmer ocean surface also will allow storms to increase in intensity, survive in higher latitudes, and develop storm tracts that could shift farther north, producing more U.S. landfalls.
Currently, an average of 1.5 hurricanes strike the U.S. every year. Severe
(Category 4 or 5 on the Saffir-Simpson Wind Scale) hurricanes strike the U.S. on the average of one every 5.75 years. Annually, hurricanes are estimated to cause approximately
$1.2 billion in damages. The proximity of dense population to the Atlantic Ocean, as well as the generally low coastal elevations, significantly increase the County’s vulnerability. The potential for property damage and human casualties in St. Lucie County has increased over the last several decades, primarily because of the rapid growth this County has experienced since 1970, particularly along the vulnerable coastline areas.
Since 1886, 56 storms of hurricane intensity have passed within 125 miles of St. Lucie County. This represents an average of one hurricane every 2 years. The number of direct hits on the southeastern Florida coastline between 1899 and 1999 has been as follows:
• Category 1 Storms (winds 74 to 95 mph) = 5 storms (4% annual probability); • Category 2 Storms (winds 96 to 110 mph) = 10 storms (10% annual probability); • Category 3 Storms (winds 111 to 130 mph) = 7 storms (7% annual probability); • Category 4 Storms (winds 131 to 155 mph) = 6 storms (6% annual probability);
and
• Category 5 Storms (>155 mph) = 1 storm (1% annual probability).
4.1.2.3 Vulnerability Assessment
Hurricane events can have the following potential impacts within a community: • Excessive wind;
• Excessive water; • Soil/beach erosion; • Electric power outage;
• Surface and air transportation disruption; • Navigable waterway impairment;
• Potable water system loss or disruption; • Sewer system outage;
• Telecommunications system outage; • Human health and safety;
• Psychological hardship; • Economic disruption;
• Disruption of community services; • Agricultural/fisheries damage;
• Damage to critical environmental resources; • Damage to identified historical resources; • Fire;
• Toxic releases; and
• Stormwater drainage impairment.
Due to the physical size of most tropical storms and hurricanes, the entire county is considered to be vulnerable to the effects of such storms should one pass within the County’s
Page | 86 boundaries. Although individual communities may be more or less vulnerable when
considering a number of varying factors, for the purposes of this vulnerability assessment, the entire county is considered to be vulnerable to the impacts of tropical storms and hurricanes.
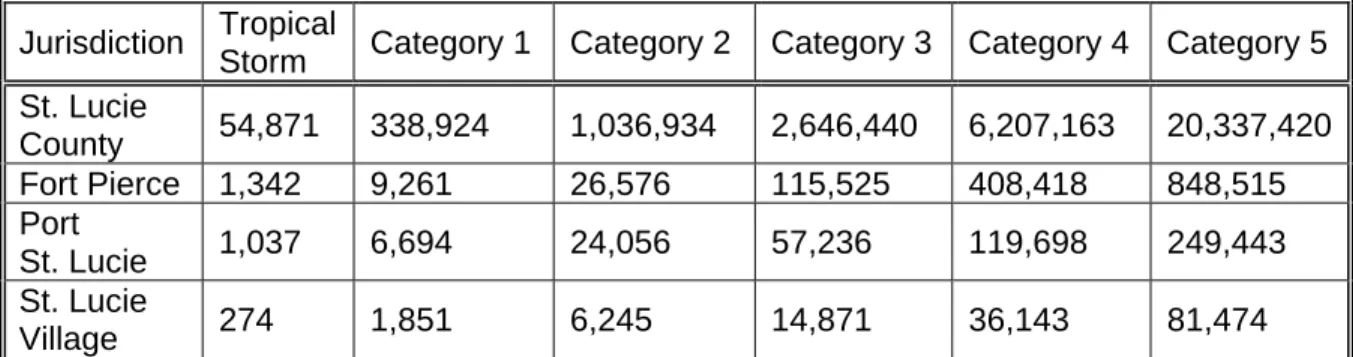
Table 4.11 illustrates the expected debris accumulation in St. Lucie County in cubic yards per acre. The St. Lucie County Comprehensive Emergency Management Plan identifies designated debris drop-off locations throughout the County.
Table 4.11. Debris accumulation in St. Lucie County in cubic yards per acre. Jurisdiction Tropical
Storm Category 1 Category 2 Category 3 Category 4 Category 5 St. Lucie County 54,871 338,924 1,036,934 2,646,440 6,207,163 20,337,420 Fort Pierce 1,342 9,261 26,576 115,525 408,418 848,515 Port St. Lucie 1,037 6,694 24,056 57,236 119,698 249,443 St. Lucie Village 274 1,851 6,245 14,871 36,143 81,474
Source: The Arbiter of Storms model.
4.1.2.4 Risk Assessment
All communities within St. Lucie County are highly vulnerable to hurricanes, but they are not all vulnerable for the same reasons. The barrier island communities (Hutchinson Island) are obviously highly vulnerable to both wind and storm surge damage from hurricanes. The communities fronting on St. Lucie County’s estuaries and rivers are also highly vulnerable to flooding associated with hurricane winds and storm surge. Communities away from the water may be more vulnerable to wind damage from hurricanes. Inland communities may have less hurricane vulnerability from flooding but more hurricane vulnerability from wind damage due to their older or less substantial type of construction.
Both the City of Fort Pierce and St. Lucie Village are old, historical communities of Florida’s east coast. Their age alone makes them particularly vulnerable to hurricane damage. Both cities have old, historically significant structures, whose loss would represent the loss of irreplaceable cultural resources. The age and construction type of much of the housing in Fort Pierce, and to a lesser extent St. Lucie Village, indicate that both communities would be very hard hit by a major storm. The City of Port St. Lucie is located at a greater distance from the ocean, and most of the construction there is relatively recent.
The risk assessment data for hurricanes in St. Lucie County are based on the MEMPHIS model and supplemental St. Lucie County Property Appraiser data. Table 4.12 illustrates the total exposure to wind damage for four different event categories.
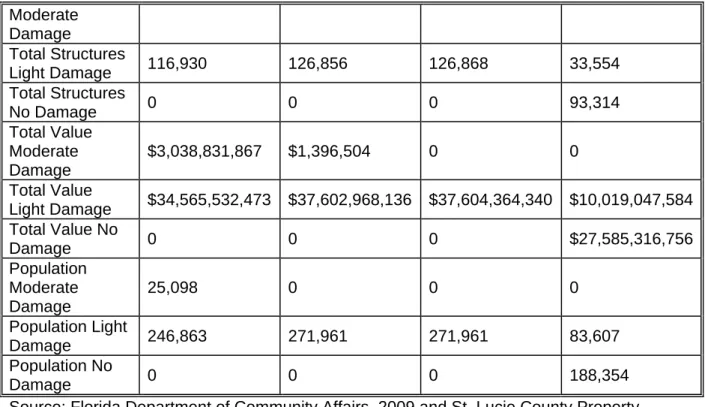
Table 4.12. Wind damage exposure, St. Lucie County, 2009.
Exposure 100-Year Event 50-Year Event 25-Year Event 10-Year Event
Page | 87 Moderate Damage Total Structures Light Damage 116,930 126,856 126,868 33,554 Total Structures No Damage 0 0 0 93,314 Total Value Moderate Damage $3,038,831,867 $1,396,504 0 0 Total Value Light Damage $34,565,532,473 $37,602,968,136 $37,604,364,340 $10,019,047,584 Total Value No Damage 0 0 0 $27,585,316,756 Population Moderate Damage 25,098 0 0 0 Population Light Damage 246,863 271,961 271,961 83,607 Population No Damage 0 0 0 188,354
Source: Florida Department of Community Affairs, 2009 and St. Lucie County Property Appraiser Data, 2009.
Table 4.13 illustrates the total exposure to wind damage for the five hurricane intensity categories.
Table 4.13. Hurricane wind damage exposure, St. Lucie County, 2009.
Exposure Category 5 Category 4 Category 3 Category 2 Category 1 Total Structures Destroyed 80,292 0 0 0 0 Total Structures Severely Damaged 44,828 32,452 0 0 0 Total Structures Heavy Damage 1,748 86,805 0 0 0 Total Structures Moderate Damage 0 7,611 124,952 3,370 0 Total Structures Light Damage 0 0 1,916 123,498 126,868 Total Value Destroyed $21,555,761, 446 0 0 0 0 Total Value $14,466,869, $8,479,582,6 0 0 0
Page | 88 Exposure Category 5 Category 4 Category 3 Category 2 Category 1 Severely Damaged 013 70 Total Value Heavy Damage $1,581,733,8 81 $25,196,255, 370 0 0 0 Total Value Moderate Damage 0 $3,928,526,3 00 $35,775,074, 940 $1,258,858,7 22 0 Total Value Light Damage 0 0 $1,829,289,4 00 $36,345,505, 618 $37,604,364,3 40 Population in Destroyed 175,288 0 0 0 0 Population in Severely Damaged 96,673 51,710 0 0 0 Population in Heavy Damage 0 207,221 0 0 0 Population in Moderate Damage 0 13,030 270,438 1,698 0 Population in Light Damage 0 0 1,523 270,263 271,961
Source: Florida Department of Community Affairs, 2009 and St. Lucie County Property Appraiser data, 2009.
4.1.3 Tornadoes
4.1.3.1 Hazard Identification
A tornado is a violent windstorm characterized by a twisting, funnel-shaped cloud extending to the ground. It is generated by a thunderstorm or hurricane when cool air overrides a layer of warm air, forcing the warm air to rise rapidly. The most common type of tornado, the relatively weak and short-lived type, occurs in the warm season, with June being the peak month. The strongest, most deadly tornadoes occur in the cool season, from December through April (FDCA, 2007). Occasional windstorms accompanied by tornadoes, such as the winter storm of 1993, also are widespread and destructive.
When a tornado threatens, only a short amount of time is available for life-or-death decisions. The NWS issues two types of alerts:
• A tornado watch, which means that conditions are favorable for tornadoes to develop.
Page | 89 On February 1, 2007, the United States started using the Enhanced Fujita Scale (EF Scale) in place of the previously used Fujita-Pearson scale. The EF scale is similar to the Fujita-Pearson scale in design, but was revised to more accurately align wind speeds with associated storm damage. Table 4.14 below illustrates the new associated wind speeds with each of the tornado damage categories used in the Enhanced Fujita scale.
Table 4.14. Enhanced Fujita Scale Wind speed category.
Category Wind Speed (mph)
F0 = Light 65-85 F1 = Moderate 86-110 F2 = Significant 111-135 F3 = Severe 136-165 F4 = Devastating 166-200 F5 = Incredible >200
Source: National Oceanic and Atmospheric Administration, 2009.
4.1.3.2 Previous Occurrences of Tornadoes
Florida ranks fourth in the U.S. in the number of tornado strikes and the first in the number of tornadoes per square mile. The odds of a tornado striking any specific point in southeastern Florida are 0.04, or once per 250 years.
The damage from a tornado is a result of the high wind velocity and wind-blown debris. Florida’s average is 55 tornadoes annually since 1950, causing an average of
3 fatalities and 60 injuries each year (FDCA, 2007). According to FDCA on-line hazard maps, there have been 18 light-damage and 1 significant-damage tornadoes in St. Lucie County between 1950 and 2002.
The National Climatic Data Center (NCDC) indicates that there have been a total of 36 tornado incidents in St. Lucie County since 1950. The majority of the events have been F0 and F1, but one F3 on April 15, 1958 cut a path 15 miles long and 33 yards wide and caused an estimated $250,000 in property damage. NCDC data also indicate that there have been 27 tornado-related injuries, 2 deaths, and $4,323,000 in property damage associated with tornado events in the County. Table 4.15 describes some of the tornado events that have occurred within the County.
Table 4.15. Tornado incidents, St. Lucie County, 1953 – 2008. Date Magnitude Path Length (miles) Path Width (yards) Description
April 15, 1958 F3 15 33 None available
May 8, 1979 F0 5 30 None available
April 11, 1982 F0 5 50 None available
July 10, 1995 F0 0 10
Minor damage in Spanish Lakes mobile home community - $50,000 property damage (FP)
Page | 90
February 2, 1998 F0 0 50
Touched down on Hutchinson Island - $30,000 property damage (FP)
March 9, 1998 F1 1 50
Caused damage at St. Lucie County Fairgrounds and
overturned airplanes at the airport - $3.2 million property damage (FP)
June 4, 2001 N/A N/A N/A $10,000 property damage (FP) May 14, 2002 F0 0 20 7 miles north of FP -$20,000
property damage
July 27, 2002 F1 0 30
Touched down in FP and damaged 70 cars - $100,000 property damage
August 6, 2004 F0 0 30 Touched down near I-95 (FP)
August 12, 2004 F0 0 30
Touched down in a PSL
community blowing down a tree and damaging 3 mobile homes (PSL)
May 25, 2005 F0 0 4 Touched down near PSL – $5,000
in damage
July 23, 2007 F0 N/A N/A Touch down near Florida Turnpike blowing down several trees (PSL) August 19, 2008 F0 N/A N/A Rain bands from TS Fay produced
a brief tornado in FP FP = Fort Pierce; PSL = Port St. Lucie
Source: National Climatic Data Center, 2008.
Based upon this history, it can be stated St. Lucie County can anticipate a tornado event approximately every 2 years with a maximum magnitude of F3.
4.1.3.3 Vulnerability Assessment
Tornado events can have the following potential impacts within a community: • Excessive wind;
• Electric power outage;
• Surface and air transportation disruption; • Telecommunications system outage; • Human health and safety;
• Psychological hardship; and • Economic disruption.
St. Lucie County’s vulnerability to tornadoes is compounded by the high
concentration of mobile home residents in large mobile home communities. According to the 2000 Census, there are 11,595 mobile homes in St. Lucie County, representing 12.7% of the total housing units in the County. Five population centers within St. Lucie County have significant concentrations of mobile homes. River Park has a total of 740 mobile homes, representing 28.4% of the total housing units. Fort Pierce North has a total of 827 mobile
Page | 91 homes, representing 26.7% of the total housing units. Fort Pierce has a total of 1,107 mobile homes, representing 6.4% of the total housing units, and, Fort Pierce South has a total of 143 mobile homes, representing 6.4% of the total housing units (U.S. Census, 2004).
4.1.3.4 Risk Assessment
Historical data indicate the frequency of tornadoes in St. Lucie County is relatively low, but some specific communities have a moderate to high vulnerability to this hazard due to the type of construction or numbers of mobile homes (manufactured housing units) within their boundaries. These communities include the greater Fort Pierce area and River Park. At the time of publication, no data were available to model loss in St. Lucie County from tornadoes.
According to the MEMPHIS risk assessment model, all of St. Lucie County lies in the 1 in 250 (medium) probability category for tornado risk. There are a total of 126,868
structures valued at $37,604,364,347 in St. Lucie County. The 2008 Florida Statistical Abstract estimates 271,961 residents in the County.
4.1.4 Severe Thunderstorms and Lightning
4.1.4.1 Hazard Identification
A severe thunderstorm is defined as a thunderstorm containing one or more of the following phenomena: hail ¾ inches or greater, winds gusting in excess of 57.5 mph, and/or a tornado (NOAA, NWS, 1994). Severe weather can include lightning, tornadoes, damaging straight-line winds, and large hail. Most individual thunderstorms only last several minutes; however, some can last several hours.
Long-lived thunderstorms are called super cell thunderstorms. A super cell is a thunderstorm that has a persistent rotating updraft. This rotation maintains the energy release of the thunderstorm over a much longer time than typical, pulse-type thunderstorms, which occur in the summer months. Super cell thunderstorms are responsible for producing the majority of severe weather, such as large hail and tornadoes (NOAA, NWS, 2003).
Downbursts also are occasionally associated with severe thunderstorms. A downburst is a strong downdraft resulting in an outward burst of damaging winds on or near the ground. Downburst winds can produce damage similar to a strong tornado. Although usually associated with thunderstorms, downbursts can occur with showers too weak to produce thunder (NOAA, NWS, 2003). Strong squall lines can also produce widespread severe weather, primarily very strong winds, and/or microbursts. A squall is a sudden violent gust of wind often associated with rain or snow (Merriam-Webster Dictionary, 2003).
When a severe thunderstorm approaches, the NWS will issue an advisory. According to NOAA, NWS (1994), two possible advisories are as follows:
Severe Thunderstorm Watch: Conditions are favorable for the development of severe thunderstorms.
Severe Thunderstorm Warning: Severe weather is imminent or occurring in the area.
Perhaps the most dangerous and costly effect of thunderstorms is lightning. As a thunderstorm grows, electrical charges build up within the thunder cloud. Oppositely charged