Open Access
Open Journal of Internet of Things (OJIOT)
Volume 4, Issue 1, 2018
http://www.ronpub.com/ojiot
ISSN 2364-7108
Smartwatch-Based
IoT Fall Detection Application
Anne H. Ngu
A, Po-Teng Tseng
A, Manvick Paliwal
A, Christopher Carpenter
A, Walker Stipe
BADepartment of Computer Science, Texas State University, 601 University Drive, San Marcos, Texas, USA,
{hn12, p t54, cc1778, m p475}@txstate.edu
BDepartment of Computer Science and Information System, University of North Georgia, Georgia, USA,
{walkerstipe}@gmail.com
A
BSTRACTThis paper proposes using only the streaming accelerometer data from a commodity-based smartwatch (IoT) device to detect falls. The smartwatch is paired with a smartphone as a means for performing the computation necessary for the prediction of falls in realtime without incurring latency in communicating with a cloud server while also preserving data privacy. The majority of current fall detection applications require specially designed hardware and software which make them expensive and inaccessible to the general public. Moreover, a fall detection application that uses a wrist worn smartwatch for data collection has the added benefit that it can be perceived as a piece of jewelry and thus non-intrusive. We experimented with both Support Vector Machine and Naive Bayes machine learning algorithms for the creation of the fall model. We demonstrated that by adjusting the sampling frequency of the streaming data, computing acceleration features over a sliding window, and using a Naive Bayes machine learning model, we can obtain the true positive rate of fall detection in real-world setting with 93.33% accuracy. Our result demonstrated that using a commodity-based smartwatch sensor can yield fall detection results that are competitive with those of custom made expensive sensors.
T
YPE OFP
APER ANDK
EYWORDSApplication paper:Smart health monitoring, fall detection, machine learning, streaming data processing, IoT system architecture
1
I
NTRODUCTIONInternet of Things (IoT) is a domain that represents the next most exciting technological revolution since the Internet. IoT will bring endless opportunities and impact every corner of our planet. In the healthcare domain, IoT promises to bring personalized health tracking
This paper is accepted at the International Workshop on Very Large Internet of Things (VLIoT 2018) in conjunction with the VLDB 2018 Conference in Rio de Janeiro, Brazil. The proceedings of VLIoT@VLDB 2018 are published in the Open Journal of Internet of Things (OJIOT) as special issue.
and monitoring ever closer to the consumers. This phenomena is evidenced in a recent Wall Street Journal (June, 29, 2015) article entitled ”Staying Connected is Crucial to Staying Healthy”. Modern smartphones and related devices now contain more sensors than ever before. Data from sensors can be collected more easily and more accurately. In 2014, it is estimated that 46 million people are using IoT-based health and fitness applications.
Currently, the predominant IoT-based health applications are in sports and fitness. However, disease management or preventive care health applications are
becoming more prevalent. For example, the real-time preventive care applications such as those for detecting falls in elderly patients is one of the active research areas due to the aging population [14]. Previous work in fall detection required specialized hardware and software which is expensive to maintain. In [2], the authors reviewed 57 projects that used wearable devices to detect falls in elderly. However, only 7.1 % of the projects reported testing their models in real-world setting. The same paper also pointed out that a wearable wrist watch for fall detection has the added benefit of being non-intrusive and not incurring any additional injuries during a fall. Indeed, the main challenge for fall detection is the ability to create a highly accurate detection model that can run on unobtrusive and inexpensive devices.
We designed a set of robust experiments to collect fall data, mainly acceleration, from volunteers and created a fall detection model using the Support Vector Machine (SVM) and Naive Bayes machine learning algorithms. Among them, Naives Bayes achieved the accuracy of 93.3% which beats the best accuracy reported in the literature [2] of 81% for wrist worn devices based on real-world falls testing. By wearing a smartwatch, the well being of an elderly person living alone can be monitored remotely and responded to in real-time. As noted in the literature, a significant danger with falling in elderly adults is the inability to get up after the fall, which is reported to occur in 30% of the time. The detection of the fall and the ability of sending a text message and a GPS location to a trusted family member, friend, or call 911 in real-time ensure a better survival or improved care of the subject after a fall.
The main contributions of the paper are:
• A demonstration that the fall detection model trained using Naive Bayes machine learning algorithm has better sensitivity than the model trained using Support Vector Machine in predicting falls based on live wrist worn acceleration data. • A streamlined methodology for collecting
simulated fall data from volunteers and an application for labeling the collected streaming data automatically and in real-time.
• A two steps approach for classifying fall data on a sequence basis. Step one consists of applying a trained fall model in a computationally efficient manner over streaming accelerometer data within a preset sliding window size to predict each instance of fall data. Step two counts the number of consecutive predicted fall instances within an interval. A fall is predicted if the consecutive number of positively predicted fall
instances lie within a pre-determined range which can be calibrated on an individual basis.
• A three layers IoT system architecture that is privacy preserving and computational efficient for edge computing.
The remainder of this paper is organized as follows. In section 2, we present the current work on fall detection and emphasize on research works that specifically address fall detection using wearable devices. In section 3, we provide a detailed description of the system architecture of our fall detection framework. In section 4, we outline the methodology we used to collect training data for fall detection and present the two steps approach for the fall prediction algorithm. In section 5, we discuss the evaluation of both SVM and the Naive Bayes models and finally in section 6, we present our conclusion and future work.
2
R
ELATEDW
ORK ANDB
ACKGROUNDThe World Health Organization (WHO) reported that 28%-35% of people aged 65 and above fall each year. This rate increases to 32%-42% for those over 70 years of age. Thus, a great deal of research has been conducted on fall detection and prevention. The early works in this area were concentrated on specially built hardware that a person could wear or installed in a specific facility. The fall detection devices in general try to detect a change in body orientation from upright to lying that occurs immediately after a large negative acceleration to signal a fall. Those early wearable devices are not well accepted by elderly people because of its intrusiveness and limited mobility.
However, modern smartphones and related devices now contain more sensors than ever before. Data from those devices can be collected more easily and more accurately with the increase in the computing power of those devices. Smartphones are also widespread and widely used daily by people of all ages. There is thus a dramatic increase in the research on smartphone-based fall detection and prevention in the last few years. This is highlighted in the survey paper [7]. The smartphone-based fall detection solutions in general collect accelerometer, gyroscope and magnetometer data for fall detection. Among the collected sensor data, the accelerometer is the most widely used. The collected sensor data were analyzed using two broad type of algorithms. The first is the threshold-based algorithm which is less complex and requires less computation power. The second is the machine learning based fall detection solutions. We will review both type of works below.
A threshold-based algorithm using a trunk mounted bi-axial gyroscope sensor is described in [1]. Ten young healthy male subjects performed simulated falls and the bi-axial gyroscope signals were recorded during each simulated-fall. Each subject performed three identical sets of 8 different falls. Eight elderly persons were also recruited to perform Activity of Daily Life (ADL) that could be mistaken for falls such as sitting down, standing up, walking, getting in and out of the car, lying down and standing up from bed. The paper showed that by setting three thresholds that relate to the resultant angular velocity, angular acceleration, and change in trunk angle signals, a 100% specificity was obtained. However, there was no discussion on the practicality of attaching a trunk mounted sensor on a person for a prolonged period of time. The restriction on the mobility of people and the privacy issue of data storage were not discussed as well. There are also research work utilizing a thresholding technique set to only detect falls greater than 6G (Gravity). While this will work extremely well for “hard” falls, we find that many of our falls were far below 6G and is more around 3.5G. A wrist mounted device may encounter even smaller force than 3.5G if the subject does not always use hands to stop his/her fall. This type of fall is of special note because an injury is more likely as the fall was not “caught” by the faller’s hands. This is one of the reasons machine learning approaches are considered more robust than thresholding techniques. Even though in controlled conditions thresholding techniques may appear to be superior, they often do not perform well on anomalous data, such as falls that only reach a maximum force of 3.5G.
A promising use of machine learning algorithms is recently presented by John Guirry in [5] for classifying ADLs with 93.45% accuracy using SVM and 94.6% accuracy using C4.5 decision trees. These ADLs include: running, walking, going up and down stairs, sitting and standing up. Their setup include a Samsung Nexus Galaxy smartphone and the Motorola Moto Actv smartwatch. Data was collected from the accelerometer, magnetometer, gyroscope, barometer, GPS, and light sensors. They synthesized a total of 21 features from all the sensors. They did not specifically address the fall detection.
Support Vector Machine (SVM) learning algorithm has also been used for fall detection by other scholars in [12]. These scholars used a trunk-mounted tri-axial sensor (a specialized hardware) to collect data. They were able to achieve 99.14% accuracy with four features using only high-pass and low-pass accelerometer data. They used a 0.1 second sliding window to record minimum and maximum directional acceleration in that time period for a feature. We drew inspiration from
this approach as it allowed us to access temporal data within each sampling point rather than having to choose a generalized feature for the whole duration which might not reflect a true fall. Other work in fall detection has focused on using multiple sensors attached to the subject. For instance sensors can be placed on the lapel, trunk, ankle, pocket, and wrist. These systems typically show marvelous results of 100% accuracy but lack convenience, portability, and are more computationally intense for a smartphone due to more data being collected and processed.
In summary, many different machine learning algorithms such as the SVM, Naive Bayes, KNN, Decision trees, and Neural networks have been applied to fall detection with some success. However, very few of those models have been tested in the real world setting and on a wrist watch. Recently, an Android Wear-based fall detection application called RightMiinder (http: //www.rightminder.com) is released on Google Play. While the goal of RightMinder is very similar to ours, no technical details are available on the accuracy of the fall detection model and the management of the collected sensor data.
3
S
YSTEMA
RCHITECTUREThe Microsoft Band 2 was chosen as the wrist worn device over other options due to its superior list of sensors. While most wrist worn health devices today have accelerometers, such as the Apple and Pebble smartwatches, the Microsoft Band 2 has the capability to also track heart rate, galvanic skin response, barometric pressure, skin temperature, UV ray intensity, GPS location, skin capacitance, ambient light, sound, and, of course, it has an accelerometer and gyroscope. The Microsoft Band 2 also has multiple sampling rate options.
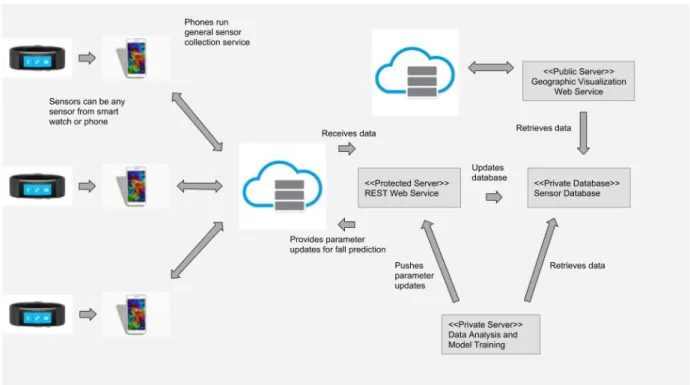
The Nexus 5X smartphone is chosen to run our fall detection IoT application and received sensor data from the smartwatch via a low-power bluetooth communication protocol. This Nexus smartphone has a 1.8GHz hexa-core processor and 2 gigabytes of RAM. This proved sufficient for real time computation of the features, and for making the predictions. Figure 1 shows an overview of the IoT system architecture. It is a three layered architecture with the smartwatch on the edge and the smartphone in the middle layer which runs the various IoT services. In our application, those IoT services are the data collection, the fall detection, data archiving, and the alert services.
In many IoT applications, it is critical that data can be stored locally to preserve privacy and is in close proximity to the program that processes and analyzes
Figure 1: Architecture of our fall detection IoT system
the data in real-time. However, the smartphone has a limited storage capacity and there is thus a need to periodically remove the sensed data or transfer the sensor data (with consent from user) to a cloud server securely for continuous refinement of the fall detection model and for the long term archival. The inner most layer serves as the cloud platform which consists of multiple services including a web server to host applications that can visualize aggregated sensor data for public health education, a sensor database for archiving sensed data from the smartwatch of the user who has given the consent, and machine learning services for analysis of the archived data for continuous refinement of the fall detection model.
We have implemented an archiving service which can be configured with a protocol where a participating user’s smartphone (with consent) will transmit both false positive and true positive fall predication data via a REST-based web service periodically to a cloud platform. These data samples can be used for re-training of the fall model and adapt the fall detection dynamically for a particular user. This three layer IoT system architecture is not specific for developing the fall detection IoT application. We have successfully used the same architecture for developing an IoT application for the prediction of blood alcohol content using the skin temperature and heart rate sensor data in [6]. In summary, this architecture has the potential to be
developed into a scalable service platform for IoT data for all kinds of devices and the associated applications.
When a fall has been detected by the application on the smartphone, an alert text message can be sent to the caretaker upon confirmation by the user (via voice on Google Home or Amazon Alexa or pressing a button on the app on the smartphone if the user is not nearby a voice device) or the message can be configured to be sent automatically after a specified duration if no confirmation is received. The alert service could include the user’s GPS location and other health metrics, such as the heart rate and body temperature at the time of the fall.
4
M
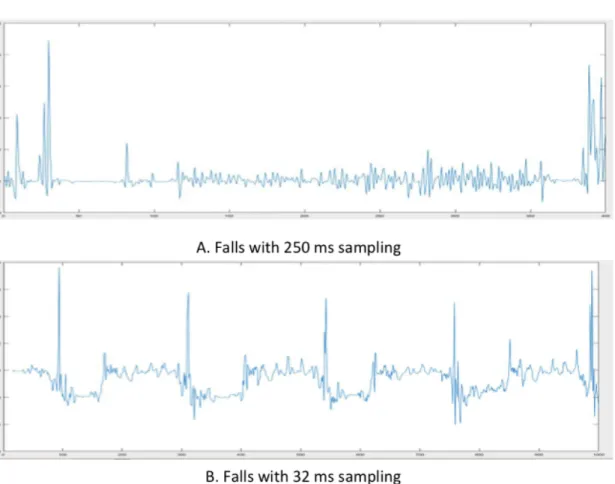
ETHODOLOGYOur initial method of collecting simulated fall data was labour intensive and had the danger of missing some critical fall signals. In that approach, the accelerometer data was collected via a smartwatch through the data collection service we developed that runs on an Android phone. The data was collected at the sampling frequency of 250 ms. A stopwatch was used to record the time stamp of each fall activity from the recruited volunteer as it occurred so that the fall data can be manually labelled afterwards by synchronizing stopwatch’s time with the recorded timestamp on the data point. This labelling was obviously very time consuming.
Figure 2: Fall patterns with 250 ms and 32 ms sampling frequency
frequency of 250 ms missed too many critical fall signals within the critical phase of a fall, which explains partly the low accuracy rate of 44.7% we obtained with real-world simulated falls using the SVM model trained with this dataset. On the other hand, the use of the lowest sampling frequency of 16 ms provided by the watch was flooding the application with too much data and incurred a high computation cost which is impractical for real-time prediction of falls. Figure 2 depicts fall data collected using sampling frequency of 250 ms verses 32 ms. It is clear from this visualization of the accelerometer data that fall data collected at 32ms sampling rate has clearly separated fall signals with the spikes. We thus revised the sampling frequency to 32 ms.
Beside making changes to the sampling frequency, we also modified the data collection service to have a button that, when pressed, labels data as ”Fall” and otherwise ”NotFall”. This eliminated the laborious manual labelling of the data. Data was labelled in real-time as it was collected. Seven subjects of good health with different heights and weights were recruited and
performed the falls and Activity of Daily Life (ADLs). Their ages ranged from 21-55, height ranged from 5 ft to 6.5 ft. and the weight from 100 lbs to 230 lbs. Each subject was told to wear the smartwatch on his/her left hand and performed a pre-determined set of ADLs consisting of: jogging, sitting down, throwing an object, and waving their hands.
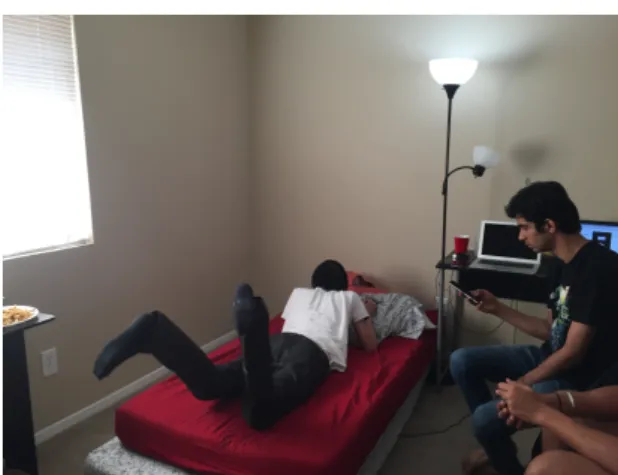
This initial set of ADLs was chosen based on the fact there are common activities that involved movement of the arms. These datasets were automatically labelled as ”NotFall”. We then asked the same subject to perform four types of falls onto a 12 inch high mattress on the floor; front, back, left, and right falls. Each subject repeated each type of fall 10 times. A second person was responsible for pressing the button on the data collection service when the subject performed one of the falls. Figure 3 shows the scene of a fall data collection experiment. Since the pressing of the button can introduce errors such as the button is being pressed too late or too long for a fall activity, the first few falls of each type performed by each subject is used as trials. These falls were visualized and the timing of when
Figure 3: Simulated fall data collection experiment
to press the button and when to release it, is adjusted accordingly to only capture the critical phase of a fall.
We also implemented an R script that can streamline the processing of the raw data collected from the smartwatch into a format that can be used as the input to various machine learning algorithms. The output of this processing is a file where each record/instance in the file has four features and a label of “Fall” or “NOT Fall”. The four features are: 1) length of the acceleration vector at the time of sampling (Ares), 2) minimum resultant acceleration in a 750ms sliding window (Smin), 3) maximum resultant acceleration in the same 750 ms sliding window (Smax), and 4) the euclidean norm of the difference between maximum and minimum acceleration in the same sliding window (∆S). More detailed descriptions for the features along with our methods for selecting them are further explained in the next section.
4.1
Feature Selection
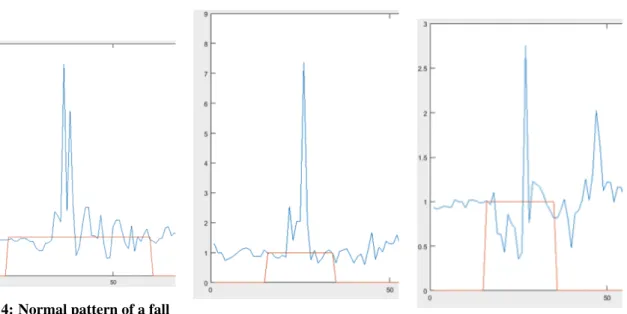
The determination of the four features mentioned in the previous section that can be used for training a model to recognize a fall was influenced by the concept of a critical phase of a fall in [10] as well as by the Principle Component Analysis (PCA) performed on raw fall data we collected. The critical phase of a fall which, in essence, encompasses the free-fall stage, the impact, and the dampening oscillations to rest. Figure 4 shows what we would expect to see from the definition of a normal fall which is defined by the critical phase. Note the height of the graph; the highest acceleration recorded for this fall was a fairly reasonable 5.5G.
We can also see the dampening oscillations in the latter half of the fall. However, because our accelerometer is wrist mounted, not all falls follow this pattern. Figure 5 shows a fall that has a reasonable maximum acceleration (the peak), but almost completely
lacks the weightlessness portion we would expect. In addition, the total time of this fall is roughly half of that of the “normal” fall as shown in Figure 4. In Figure 6, the overall fall pattern is similar but the scale is completely different. The maximum acceleration never exceeded 3G. These latter two examples may appear to be anomalies but are actually extremely prevalent especially for the left and right fall data we collected.
The variance in fall patterns is due to the accelerometer’s varying orientation depending on the specific fall (front, back, left, and right), as well as the varying methods in which the arms are used, or are not used, to catch a fall. This is another reason why we believe the machine learning is superior to thresholding technique when it comes to using a smartwatch for fall detection. Since there could be many more patterns of falls we have yet to encounter, the thresholding method must be manually re-adjusted for each of these whereas the machine learning method merely needs to train on the new pattern of fall.
We used the Euclidean norm to measure the length (magnitude) of acceleration and velocity vectors. That is, for any vector~rinR3, we used:
k~rk2=qr2
x+r2y+rz2 (1)
The four features that we selected for fall detection are Ares, ∆S, Smin, Smax, which are defined in the
following. Ares, resultant acceleration, is defined as the magnitude of the acceleration vector at the start of a fall. Using Equation 1, we defined:
Ares=kAk2. (2)
∆S, adapted from Liu and Cheng’s paper in [12], is the magnitude of the difference between minimum and maximum acceleration in a 750 ms sliding window. That is, using Equation 1, we defined:
∆S =kSmax−Smink2. (3) whereSminandSmaxadapted from Jantaraprim et. al’s paper [10] are defined as the minimum and maximum resultant acceleration in a sliding window of 750 ms. In the original implementation by Jantaraprim et. al and Liu and Cheng’s, the sliding window was designated to be 0.1 seconds. In the literature there is little consensus on what sliding window size is optimal for the calculation ofSminandSmax. 0.2 to 2 second windows have been used but windows between about 0.5 and 1 second were more common. When computing over streaming data, the computation must accommodate data at the boundary of a sliding window and thus it is important to set an overlapping threshold. We chose a 750 ms window with 50% overlap because it encompasses longer than average
Figure 4: Normal pattern of a fall
Figure 5: Fall without free fall
phase Figure 6: Shorter duration fall
falls and it covers the three common phases of a critical fall which are pre-fall, falling, and post fall.
Our model is trained to predict fall on a sample by sample basis, categorizing each sample as a fall or not a fall. This method does not necessarily suit the nature of the activities we are trying to detect as detecting a fall constitutes finding a pattern from a succession of sample points as shown in Figure 4. This means the final prediction of whether a movement of the wrist is a fall or not a fall must be derived by a second step which counts a range of consecutive positive fall labels within a prediction interval.
To determine this range, we experimented with the model in real life using activities that could be defined in two categories: (1) short term spikes in acceleration and (2) long term increases in acceleration. Activities that could be categorized as (1) are various hand and arm gestures such as waving, throwing an object, and punching. An activity that would belong in category (2) would be running or exercising involving arm movements which is demarcated by a sudden increase in acceleration that is maintained over a duration of at least three seconds (i.e longer than a typical fall).
We run classification experiments with these two categories of activity data from the seven subjects and determine the initial range/threshold to use based on the best predicted result. The low range of the threshold is used to filter out arm gestures that are not fall, but incurs short term spikes in acceleration. The high range/threshold is for filtering out the arm gestures that maintained spikes in acceleration over a longer duration than a typical fall. Our experimental result which is discussed in section 5 shows a threshold between 3 and
50 with the sampling frequency set to 32 ms as the ideal in the sense that it gives the highest recall and accuracy in fall prediction when tested.
To our knowledge, no other paper on fall detection application has used a combination of a machine learning model coupled with this second step of heuristics based on a consecutive positive labelled samples within the prediction interval/sliding window.
4.2
Prediction Algorithm
The predication algorithm is given in Algorithm 1. Our previous work utilized the Support Vector Machine (SVM) as the classifier of choice. This model achieved good theoretical result of 93.8% accuracy, but performed poorly in real world test of 40 falls with only 44.7% accuracy. We choose the Naive Bayes machine learning algorithm this time because it is computationally more efficient from our initial investigation (the model creation time for Naive Bayes used only 1.37 seconds verses 434 seconds with SVM using a dataset of 32092 sample points). This efficiency in computation has also been observed by other authors in [8]. They demonstrated that Naive Bayes could classify fall in less than 0.3 seconds as compared to Decision Tree which took more than 6 seconds.
Naive Bayes also provides better accuracy as opposed to other algorithms (Decision tree, SVM, KNN) that we attempted initially in the theoretical realm using the RapidMiner tool (https://rapidminer.com). Naive Bayes is a probabilistic model which only requires a small training data. This overcomes one of our main challenges of having to collect a large set of labelled fall
Algorithm 1 Prediction algorithm
Input: AccelerometerData (Ax, Ay, Az) in CSV file
Output: prediction of true or false of a fall
slidingW indow= 750ms consecutiveCount= 0
prediction=f alse
for allAccelerometerDatainslidingW indowdo
ComputeAres,∆S,Smin,Smax Write to CSV file
end for
Initialize the prediction interval (i.e which data sample in the CVS file to start the prediction)
naiveBayes = the trained Naive Bayes fall detection model
for allinstanceinpredictionIntevaldo
label= naiveBayes.classifyInstance(instance)
if(label== ”F all”)then
++consecutiveCount
else if(3<=consecutiveCount <= 50)then
prediction=true consecutiveCount= 0 else consecutiveCount= 0 end if end for return prediction
data. Naive Bayes model also does not assume relations between data but only the probability of the current input as being a fall. This fits well with the two steps approach we proposed where the second step is used for the final prediction which is guided by the threshold we set for consecutive number of labelled falls. This second step implicitly captures relationships among sets of consecutive data points. Below is the pseudo codes of our prediction algorithm which consists of fall features computation, classification of each fall instance, and the final prediction of fall or not fall using a threshold.
5
E
VALUATIONOur goal is to be able to detect accurately whether someone has fallen in real time based on the motion sensed by the smartwatch that a person is wearing on his/her wrist. We do not want to mis-classify a real fall which implies a fall detection model with a high recall or sensitivity.
In this section, we first compare the two fall models trained using SVM and Naive Bayes respectively. We then examine the impact on the accuracy of both models by incorporating a second step to count the number of consecutive positive fall labels in the final prediction of a fall within a particular window. We also examine varying the threshold for the consecutive number of positive fall
labels on the accuracy of the fall prediction. Finally, we investigate the effect on the accuracy of the model by adding the false positive (ADL data) samples back to the original labelled data set.
All our experiments use the same dataset of 32094 sample points. Among them, 2324 are labelled as fall. The 32094 sample points represent 270 simulated fall events and ADL data from seven volunteers. We used two third of these data to train both SVM and Naive Bayes models and reserved a third for testing. Table 1 shows the performance of fall detection models trained using SVM and Naive Bayes after the 10-fold cross validation without incorporating the consecutive falls threshold.
It is important to have a fall model that won’t mis-classify a true fall and this implies having a high recall or sensitivity. Naive Bayes has a much better recall as compared with the SVM model. However, the precision for this theoretical Naive Bayes model is low which implies that this model will have high false positive predictions and thus many non fall sample points will be classified as falls. This will render the application impractical for daily use.
However, as explained in Section 4, the low precision or recall seen in these two initial models is the result of the sample by sample prediction which does not account for the fact that a fall event constitutes a consecutive number of positive fall sample points. To confirm our hypothesis, we tested both models with the 90 falls (test set) using various consecutive fall thresholds. The result is shown in Table 2 for the Naive Bayes model and in Table 3 for the SVM model. The recall of the Naive Bayes model has increased from 55% to 94.44% using the 3-50 threshold. However the maximum recall for the SVM model with 3-50 threshold is only 71.11%. We also tested both models with 90 ADL test data set that accounts for sitting, hand waving, jogging and throwing an object.
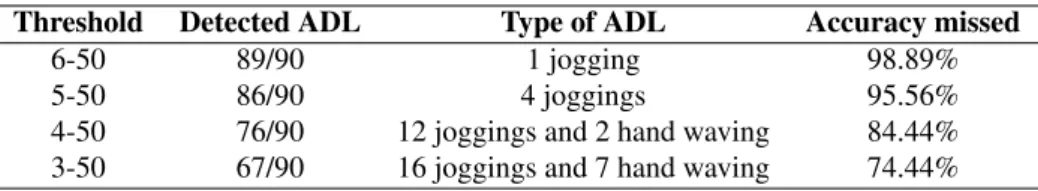
From Table 4, we can infer that the Naive Bayes model has no problem in detecting sitting down and throwing an object, but has difficulties in differentiating jogging and hand waving activities from the actual fall activity. This problem becomes more pronounced as we gradually decreased the lower end of the threshold from 6 to 3. However, while a higher number for the lower end threshold will detect ADL more accurately, the accuracy of positive fall detection decreased as shown in Table 2. For example, the threshold of 6-50 has an accuracy rate of positive fall detection of 83.33% versus the 94.4% with 3-50. Table 5 shows the results of using the trained SVM model in predicting ADL. SVM gives almost 100% accuracy for ADL prediction, but has very low recall for predicting actual falls as shown in Table 3. Since our objective is to detect falls as accurately as
Table 1: Results by algorithm without consecutive fall heuristics Algorithm Accuracy Recall Precision Model creation time
SVM 93.8% 16% 80% 443 s
Naive Bayes 90.5% 55% 38% 1.37 s
Table 2: Performance of Naive Bayes Model Threshold Detected Fall Accuracy
6-50 75/90 83.33%
5-50 77/90 85.56%
4-50 82/90 91.11%
3-50 85/90 94.44%
Table 3: Performance of SVM Model Threshold Detected Fall Accuracy
6-50 31/90 34.44%
5-50 37/90 41.11%
4-50 50/90 55.56%
3-50 64/90 71.11%
Table 4: Performance of Naive Bayes with ADL data
Threshold Detected ADL Type of ADL Accuracy missed
6-50 89/90 1 jogging 98.89%
5-50 86/90 4 joggings 95.56%
4-50 76/90 12 joggings and 2 hand waving 84.44%
3-50 67/90 16 joggings and 7 hand waving 74.44%
possible, we choose Naive Bayes over SVM model. The preferred threshold is 3-50 which gives an accuracy of 94.4% in detecting falls, and 74.44% of accuracy in detecting ADL. This is a huge increase from the accuracy of 44.7% for fall detection as reported in our earlier work [9] using a SVM model.
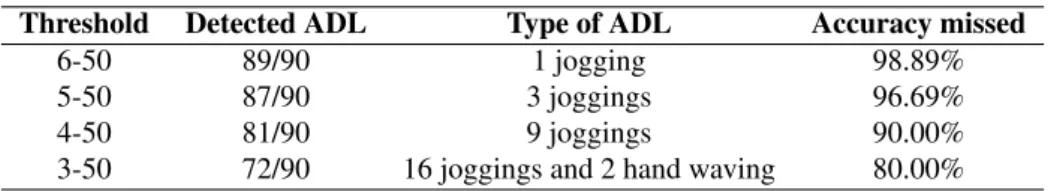
Next, we want to check whether we can reduce the false positive rate of the trained Naive Bayes fall detection model, that isnotmis-classifying some of the ADLs such as jogging and hand waving as falls. To do that, we trained a new Naive Bayes fall detection model with additional false positive samples (i.e. non fall actions that were classified as falls). Table 6 shows the performance of this model when tested with the 90 fall test data set.
This result demonstrated that the addition of false positive samples has improved the detection of ADL (from 74.44% to 80%). The accuracy of detection of actual falls has decreased from 94.44% to 93.3% with 3-50 threshold.
In summary, using a traditional Naive Bayes machine learning algorithm that is widely available and with a modest amount of labelled wrist mounted accelerometer data, we can achieve a fall detection model with a recall of 93.33% and a precision of 80% using a sampling rate of 32 ms and a threshold of 3-50. Our experiments also demonstrated that there is a tradeoff between achieving high fall detection accuracy (high sensitivity) and low false positive rate (high specificity) using only accelerometer data from a smartwatch.
In addition, our current Naive Bayes fall detection model has the problem in differentiating arm movement
caused by joggings from falls. However, considering older people are unlikely to perform jogging activities, our application is still practical for use in monitoring of falls for elderly people. We have shown that the detection of ADLs can be improved by adding labelled false positive data for re-training. For the current implementation of this Fall Detection application, false positive data can be archived via the archiving service via direct feedback from users. We are in the process of implementing also the archiving of true positive data. This enables the opportunity of providing a personalized fall detection model tailored to each user.
The accuracy for detecting fall has decreased by one percent in all experimented thresholds with the addition of false positive (i.e. ADL) data as shown in Table 6. Table 7 shows the accuracy of the model when tested with the 90 ADL test data set.
6
C
ONCLUSIONSUsing only a wrist mounted smartwatch’s accelerometer data for fall detection, a true positive rate of 93.33% was achieved using a model trained with Naive Bayes machine learning algorithm on our chosen four features (Ares,∆S,SmaxandSmin) sampled at 32 ms frequency. We have developed a two step procedure of classifying fall data on a sequence basis rather than just a point by point basis. This two step procedure allowed us to extend the results of our predecessors [10, 5], which used specialized sensors for activity recognition, into the realm of commercially available smartwatch sensors with comparable results.
Table 5: Performance of SVM with ADL data
Threshold Detected ADL Type of ADL missed Accuracy
6-50 90/90 none 100%
5-50 90/90 none 100%
4-50 90/90 none 100%
3-50 89/90 1 jogging 98.89%
Table 6: Fall detection with false positive samples using fall data set Threshold Detected Fall Accuracy
6-50 74/90 82.22%
5-50 76/90 84.44%
4-50 80/90 88.89%
3-50 84/90 93.33%
Table 7: Fall detection with false positive samples using ADL data Threshold Detected ADL Type of ADL Accuracy missed
6-50 89/90 1 jogging 98.89%
5-50 87/90 3 joggings 96.69%
4-50 81/90 9 joggings 90.00%
3-50 72/90 16 joggings and 2 hand waving 80.00%
There were many IoT devices that already existed for fall detection, but they relied on special hardware with multiple inconveniently placed sensors that added to the computational complexity beyond that which a standard smartphone device could comfortably manage. We believe the simplicity of only having to wear a smartwatch would not only reduce costs, but would also be very convenient and non-intrusive for the users.
The three layers IoT system architecture is not specific to fall detection application. It is an open architecture that can be used for many IoT devices. Our long term goal is to generalize this architecture to a light-weight IoT service platform using the accessor design pattern in [11].
We had developed a real-time IoT data collection and labelling process. This data collection service and labelling process can be generalized and used for the development of many other IoT applications. For example, an IoT application that needs to track arm movement of ADHD children can use the same data collection service and labelling process.
Our current fall detection model is promising in its efficiency as well as the predictive power, however, our model has some trouble distinguishing between arm gestures from jogging and actual falls. We have experimented with leveraging the accelerometer data on the smartphone to further improve the accuracy. However, this assumes that the user will carry the smartphone close to the body at all the time which might not be practical when the user is at home. Our
immediate future work in improving the accuracy of our fall detection model is to apply deep learning, in particular, the recurrent neural network [3] which works well on time-series data by considering past data points when making a single prediction. This will eliminate the necessity for estimating the best threshold to use which has to be fine-tuned with experiments. Moreover, the recurrent neural network model has the advantage that it can be trained using the raw accelerometer data rather than the preprocessed features. Some useful signals might get lost in the process of pre-processing of data.
We acknowledge that our fall detection model is trained using data from healthy volunteers, which might not reflect the actual fall data from elderly people. It is impossible to collect simulated fall data from the elderly group of people because of higher likelihood of injuries. Currently, the only real world fall data for elderly people available for our use is from the FARSEEING consortium [4]. However, none of their dataset is collected from smartwatches which made them not suitable for our research. There is another dataset from UniMiB SHAR [13], however, again all accelerometer data from this dataset are solely collected using a smartphone rather than a smartwatch. We plan to conduct a case study using our fall detection application in a nursing home in the near future. We aim to use the application to collect ADL data from elderly and verify how many of those ADL activities are falsely classified as falls to judge the practically of our application. Currently, we have obtained permission to
do a trial on senior citizens in a nursing home at San Marcos regarding wearing smartwatches and carrying smartphones to detect falls. We will recruit eight seniors for the case study. In particular, we want to know 1) How long seniors will wear smartwatches in a day? 2) How practical it is for seniors to carry smartphones in proximity to the smartwatches during the day? 3) How much ADL data we can collect in a week from one senior? 4) Which ADL activities our fall detection model has the most trouble in differentiating from falls? 5) What are seniors’ main concerns regarding wearing smartwatches and carrying smartphones ?
A
CKNOWLEDGEMENTWe thank the National Science Foundation (NSF) for funding this research under the Research Experiences for Undergraduates program (CNS-1358939) at Texas State University to perform this piece of work and the infrastructure provided by a NSF-CRI 1305302 award. We also like to thank REU students of 2016, in particular Ms. Yeahuay Wu, for her assistance in getting the original system up and running quickly.
R
EFERENCES[1] A. K. Bourke and G. M. Lyons, “A threshold-based fall-detection algorithm using a bi-axial gyroscope sensor,”Medical Engineering and Physics, vol. 30, no. 1, pp. 84–90, 2008.
[2] S. Chaudhuri, H. Thompson, and G. Demiris, “Fall detection devices and their use with older adults: A systematic review,” Journal of Geriatric Physival Therapy, vol. 37, no. 4, pp. 178–196, 2014. [3] P. Dagum, A. Galper, and E. Horvitz, “Dynamic
network models for forecasting,” inProceedings of the eighth international conference on uncertainty in artificial intelligence. Morgan Kaufmann Publishers Inc., 1992, pp. 41–48.
[4] FARSEEING, “The FARSEEING real-world fall respository,” 2018, http://farseeingresearch.eu. [5] J. J. Guiry, P. van de Ven, and J. Nelson,
“Multi-sensor fusion for enhanced contextual awareness of everyday activities with ubiquitous devices,”
Sensors, vol. 14, no. 3, pp. 5687–5701, 2014.
[6] M. Gutierrez, M. Fast, A. H. Ngu, and B. Gao, “Real-time prediction of blood alcohol content
using smartwatch sensor data,” in IEEE
International Conference on Smart Health. Phoneix, Arizona: Springer, November 2015. [7] M. A. Habib, M. S. Mohktar, S. B. Kamaruzzaman,
K. S. Lim, T. M. Pin, and F. Ibrahim, “Smartphone-based solutions for fall detection and prevention: challenges and open issues,”Sensors, vol. 14, no. 4, pp. 7181–7208, 2014.
[8] J. He, S. Bai, and X. Wang, “An unobtrusive fall detection and alerting system based on kalman filter and bayes network classifier,” Sensors, vol. 17, no. 6, 2017.
[9] N. A. Hee, W. Yeahuay, Z. Habil, P. Andrew, Y. Brock, and Y. Lina, “Fall detection using smartwatchsensor data with accessor architecture,” in International Conference for Smart Health (ICSH), 2017.
[10] P. Jantaraprim, P. Phukpattaranont, C. Limsakul, and B. Wongkittisuksa, “Fall detection for the elderly using a support vector machine,”
International Journal of Soft Computing and Engineering (IJSCE), vol. 2, no. 14, pp. 5687– 5701, March 2012.
[11] E. Latronico, E. A. Lee, M. Lohstroh, C. Shaver,
A. Wasicek, and M. Weber, “A vision of
swarmlets,” Internet Computing, IEEE, vol. 19, no. 2, pp. 20–28, 2015.
[12] S.-H. Liu and W.-C. Cheng, “Fall detection with the support vector machine during scripted and continuous unscripted activities,”Sensors, vol. 12, no. 9, p. 12301, 2012.
[13] D. Micucci, M. Mobilio, and P. Napoletano, “Unimib SHAR: a new dataset for human activity recognition using acceleration data from smartphones,”CoRR, vol. abs/1611.07688, 2016. [14] C. Tacconi, S. Mellone, and L. Chiari,
“Smartphone-based applications for investigating falls and mobility,” in5th International Conference on Pervasive Computing Technologies for Healthcare, May 2011, pp. 258–261.
A
UTHORB
IOGRAPHIESAnne H.H. Ngu is currently a Full Professor with the
Department of Computer
Science at Texas State
University. From 1992-2000, she worked as a Senior Lecturer in the School of Computer
Science and Engineering,
University of New South Wales, Australia. She had held the research scientist position with Telcordia Technologies; Lawrence Livermore National Laboratory, University of California, Berkeley; Commonwealth Scientific and Industrial Research Organization (CSIRO), Australia and the Tilburg University. Dr Ngu has published over 120 peer reviewed technical papers in computer science. Her main research interests are in large-scale service and information discovery and integration, service platforms for Internet of Things, workflows, databases and Software Engineering. She was bestowed with a special Outstanding Contribution Award for organizing ICDE in 1999. She was a winner of the 2013 NCWIT Undergraduate Research Mentoring Award.
Po-Teng Tseng is a recent Master’s graduate in Computer
Science from Texas State
University. He is passionate about solving practical and challenging problems. His research interests include
Machine Learning, Data
Analysis, Parallel Programing and Internet of Thing.
Manvick Paliwal is currently pursuing Master’s in Computer
Science at Texas State
University. From 2013-2017, he studied Computer Science at Sir Padampat Singhania University,
India. He has developed
many Web and mobile based applications and have organized several workshops for Web and Mobile app development to help other students learn about these technologies. He had worked with Smart City, Udaipur and have contributed in developing software solutions for Digital India Project. His main interests are in Internet of Things and Cloud Computing.
Chris Carpenter graduated from Texas State University with a Bachelor of Science degree in Computer Science and Applied Mathematics in Spring 2018. He participated in a NSF Research Experiences for Undergraduates program in Software Systems and Analysis in the summer of 2017. He is now employed at Oracle as a Solution Engineer.
Walker Stipe obtained his
undergraduate degree in
computer science at the
University of North Georgia. He is attending graduate school for data science at St. John’s University in the fall. He is currently creating a video series of introductory tutorials for kids to ignite interest and learn some of the basics of data science with Palo Alto Education. His research interests are in how to approximate multi-agent, multi-objective, partially observable, environments with large or continuous state/action spaces