AFIT Scholar
AFIT Scholar
Faculty Publications 9-1-2018The Effectiveness of Using Diversity to Select Multiple Classifier
The Effectiveness of Using Diversity to Select Multiple Classifier
Systems with Varying Classification Thresholds
Systems with Varying Classification Thresholds
Harris K. Butler IVMark A. Friend Kenneth W. Bauer
Air Force Institute of Technology Trevor J. Bihl
Air Force Research Laboratory
Follow this and additional works at: https://scholar.afit.edu/facpub Part of the Theory and Algorithms Commons
Recommended Citation Recommended Citation
Butler, H. K., Friend, M. A., Bauer, K. W., & Bihl, T. J. (2018). The effectiveness of using diversity to select multiple classifier systems with varying classification thresholds. Journal of Algorithms & Computational Technology, 12(3), 187–199. https://doi.org/10.1177/1748301818761132
This Article is brought to you for free and open access by AFIT Scholar. It has been accepted for inclusion in Faculty Publications by an authorized administrator of AFIT Scholar. For more information, please contact [email protected].
The effectiveness of using diversity
to select multiple classifier systems
with varying classification thresholds
Harris K Butler IV, Mark A Friend, Kenneth W Bauer Jr and
Trevor J Bihl
Abstract
In classification applications, the goal of fusion techniques is to exploit complementary approaches and merge the information provided by these methods to provide a solution superior than any single method. Associated with choosing a methodology to fuse pattern recognition algorithms is the choice of algorithm or algorithms to fuse. Historically, classifier ensemble accuracy has been used to select which pattern recognition algorithms are included in a multiple classifier system. More recently, research has focused on creating and evaluating diversity metrics to more effectively select ensemble members. Using a wide range of classification data sets, methodologies, and fusion techniques, current diversity research is extended by expanding classifier domains before employing fusion methodologies. The expansion is made possible with a unique classification score algorithm developed for this purpose. Correlation and linear regression techniques reveal that the relationship between diversity metrics and accuracy is tenuous and optimal ensemble selec-tion should be based on ensemble accuracy. The strengths and weaknesses of popular diversity metrics are examined in the context of the information they provide with respect to changing classification thresholds and accuracies.
Keywords
Accuracy, classifier fusion, classification threshold, classification, diversity, ensembles
Introduction
There is considerable effort in the pattern recognition field to combine the outputs of individual classifiers to create a multiple classifier system (MCS), also termed an “ensemble,” which endeavors for robustness over any single classifier in the MCS. The underlying principle is that greater accuracy can be achieved by combining the outputs of classifiers strong in different areas of the decision space. Classifiers that are strong in different areas of the decision space are said to be diverse, and intuitively selecting diverse classifiers would lend itself to improved accuracy.
However, the concept of diversity has yet to be for-malized but there is consensus among researchers that diverse classifiers make errors in different areas of the classification domain. Herein, we consider diversity to be the abstract concept that describes differences between outputs of multiple distinct classifiers, while a diversity metric will be considered to be a rigorously defined method for describing this abstract concept of diversity. Currently, there are many proposed diversity
metrics, c.f. literature,1–3 without any clear consensus as to which diversity metric is best.
Although studies have examined the relationship between accuracy and diversity, c.f. literature,4–6 limi-tations of these studies include that only a small part of the possible classification domain was considered. By selecting different classification thresholds for each individual classifier in an MCS, it is possible to look at a much wider range of the classification domain. We introduce an alternate scoring technique that allows selection of individual classification thresholds to gen-erate a classification surface instead of just a single
Department of Operational Sciences, Air Force Institute of Technology (AFIT), Wright Patterson AFB, Dayton, OH, USA
Corresponding author:
Trevor J Bihl, Sensors Directorate, Air Force Research Laboratory (AFRL), Wright Patterson AFB, Dayton, OH 45433, USA. Email: [email protected]
Journal of Algorithms & Computational Technology 2018, Vol. 12(3) 187–199
!The Author(s) 2018 Article reuse guidelines: sagepub.com/journals-permissions DOI: 10.1177/1748301818761132 journals.sagepub.com/home/act
Creative Commons Non Commercial CC BY-NC: This article is distributed under the terms of the Creative Commons Attribution-NonCommercial 4.0 License (http://www.creativecommons.org/licenses/by-nc/4.0/) which permits non-commercial use, reproduction and distribution of the work without further permission provided the original work is attributed as specified on the SAGE and Open Access pages (https://us. sagepub.com/en-us/nam/open-access-at-sage).
classificationcurve. Through employing the alternative scoring technique, we find that the relationship between diversity and accuracy in ensembles is ambiguous, despite there is a statistically significant relationship between accuracy and diversity when using academic data sets, classification algorithms, and ensemble tech-niques. The alternate scoring technique allows us to create and evaluate a large number of MCSs, from which we analyze with linear correlation, least squares regression, as well as accuracy-based and diversity-based ensemble selection algorithms to uncover a pos-sible relationship between accuracy and diversity.
This paper is organized as follows: the next section presents a review of fusion methods and diversity met-rics. The subsequent section discusses underlying theory along with the proposed scoring method. Application results, from using academic datasets, are then presented. The concluding remarks are discussed in the last section.
Background
Prior research
Numerous studies have attempted to show a relation-ship between the diversity measures and the perfor-mance of an MCS.3–16 Some studies have had some success in showing this relationship; however, they used diversity measures inherently correlated with accuracy. However, there have been no successes with the more “pure” measures of diversity.
Aksela and Laaksonen4 studied classifier selection using a number of diversity metrics and fusion techni-ques and state that diversity metrics that disregard clas-sifier correctness are not optimal for selection purposes. However, diversity metrics that take classifier correctness into account are “cheating’’ by really making the mea-sure about accuracy instead of diversity. In essence, it is desirable for the diversity of the errors to be high, but the agreement on the correct outputs should also be high.4
This idea of diversity being important but not at the cost of accuracy is echoed in other research as well. Brown and Kuncheva6 decomposed their diversity into “good” and “bad” diversity measures where increasing good diversity reduces error and increasing bad diversity increases error. However, they only did so for one fusion method and loss function combination; a separate decomposition must be performed for every combination of loss function and fusion method.6 Brown and Kuncheva6 also did not provide a way to use the good/bad diversity decomposition for building classifier ensembles. Canuto et al.7performed a study on ensemble selection with both hybrid (different types of classifiers) and non-hybrid (all classifiers are the same type) ensembles. They determined that
classifier selection does have an impact on an ensem-ble’s accuracy and diversity but they did not show any link between accuracy and diversity. They also show that hybrid ensembles provide the most diversity, this is one reason we use hybrid ensembles in our research. Gacquer et al.8proposed a genetic algorithm for ensem-ble selection that performs well with a specified accuracy-diversity trade off of 80/20, indicating that diversity must be of at least some use for selecting ensembles that generalize well over a population. However, they mentioned that this may not be true for small data sets, and it may not be true for all large data sets, either. Hadjitodorov et al.9looked at cluster ensembles which is a unsupervised learning technique, but still offer valid insight. They claim that accuracy peaks somewhere around medium diversity, and very high or very low diversity ensembles are a poor choice. Alternatively, Kuncheva10stated that while no rela-tionship between diversity and accuracy has been con-clusively proven, it is may still be a useful idea in creating ensemble selection heuristics. Kuncheva and Whitaker3noted that the diversity metrics tend to clus-ter with themselves indicating that there is some agreed upon idea of diversity, but stated that using diversity for enhancing the design of ensembles is still an open question. Ruta and Gabrys11 showed a correlation between one measure of accuracy, majority voting error, and two diversity metrics, the pairwise double-fault measure and the non-pairwise double-fault majority mea-sure. The non-pairwise fault majority measure of diver-sity was designed specifically for majority voting fusion, and thus is expected to show a relationship with majority voting error.11
Shipp and Kuncheva12 considered a large number of diversity metrics and fusion methods but did not find a correlation between ensemble accuracy and diversity. Windeatt2proposed a diversity metric that is measured across classes and not classifiers; he showed it to be correlated with the base classifier’s accuracy but it did not appear to be correlated with the accuracy of the MCS as a whole. While some of the studies claim a correlation between accuracy and a proposed diversity metric, all of the studies fall short of conclusively prov-ing a link between diversity and accuracy. Part of the problem stems from the fact that there is no formal definition of diversity.
With the current state of research in this area exam-ined, one area that has not been researched at all is the relationship between accuracy and diversity over the classifier threshold domain space. All previous studies focused on the correlation between the classification accuracy at a fixed classification threshold, i.e. for a two class problem with a decision threshold h¼0:5, the class with posterior probability greater than 0.5 is the winning class. In this paper, the relationship
between diversity and accuracy is explored as the clas-sification thresholds are varied over their full range, not justh¼0:5.
Classifier fusion
While it is possible to classify observations with a single classifier, greater accuracy may achieved by creating multiple classifiers and combining the results.17 Combining multiple classifiers creates an MCS.
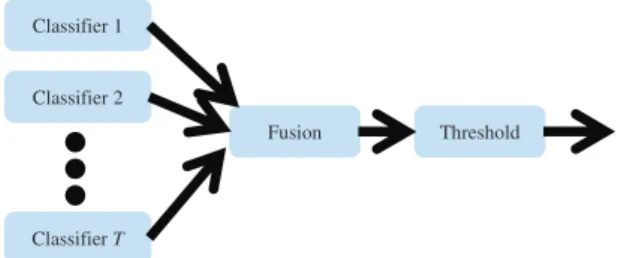
One of the most common structures is parallel com-bination, conceptualized in Figure 1, which we refer to as the standard method to contrast with our alternate method described later. The standard method is certain-ly not the oncertain-ly possible structure, and many other pos-sibilities exist for combining classifiers. Fundamentally, all combination rules within the parallel structure fall into three different levels; an abstract level which only requires class labels as outputs, a rank level which requires a ranked list of class outputs, and finally a mea-surement level which requires class probabilities.11
Majority voting
Majority voting is the simplest abstract level fusion method. It involves selecting the most commonly assigned class as the final assigned class. If there is a case where no class gets more than one vote, the final assignment is given to the individual classifier with the best accuracy.1 There are other possible voting meth-ods than just the simple majority described above, c.f.,1 but these are not used in our research.
Measurement level fusion
Measurement level fusion requires more information than abstract level fusion and possibly performs better due to the additional information over abstract level fusion methods. Measurement level fusion schemes require fuzzy measures on the interval [0, 1] as the classifier outputs. These fuzzy measures are treated as class probabilities or one of the other meas-ures of evidence: possibility, necessity, belief, or plau-sibility. There are a wide range of measurement level fusion schemes, only some of the most popular are
discussed below. The following symbol conventions are used with measurement level fusion:
• ljðxÞ– the support given by the MCS to classjfor an observationx.
• dt;jðxÞ– the support given by the individual classifier tto classjfor an observationx.
• T– the number of classifiers in the MCS
Generalized mean
The generalized mean fusion method encompasses many commonly used fusion methods. The formula for a gen-eralized mean fusion is1
ljðx;aÞ ¼ 1 T XT t¼1 dt;jðxÞa !1=a (1)
The choice ofadetermines the behavior of the rule. Ifa¼1, we obtain the mean rule,1also called the basic ensemble model (BEM).18 If a¼ 1 then we obtain the minimum rule
ljðxÞ ¼mint¼1...Tdt;jðxÞ (2)
and similarly,a¼ 1then we obtain the minimum rule,1 ljðxÞ ¼maxt¼1...Tdt;jðxÞ (3)
Product rule
The product rule multiplies the support given by each classifier and if the posterior probabilities are correctly estimated then the product rule gives the best estimate of the overall class probabilities.1However, if one clas-sifier gives very low support to a class, it effectively removes the chance of that class being selected
ljðxÞ ¼ 1 T YT t¼1 dt;jðxÞ (4)
Generalized ensemble
The generalized ensemble model (GEM) is a general-ized model of the mean rule, also called the BEM.18 At its core, GEM is a weighted average of the support given by each classifier
ljðxÞ ¼X T t¼1 atdt;j (5) Classifier 1 Classifier 2 Classifier T Fusion Threshold
The alphas are selected in a way that minimizes the mean squared error of the MCS. This is done by cal-culating the misfit function,mið Þx , for each classifier
miðxÞ ¼fðxÞ fiðxÞ (6) where f xð Þis the truth and fið Þx is the output of clas-sifieri. The correlation matrix between the misfit func-tions of all the classifiers i and j is then constructed, with individual entries
Cij¼E miðxÞmjðxÞ
(7)
The weights, ai, are calculated using the entries in the correlation matrix
ai¼ RjC
1
ij RkRjCij1
(8)
Perrone and Cooper18 state that weights calculated using equation (8) creates the linear combination of classifier outputs that minimizes the MSE. GEM is proven to be more accurate than the best individual classifier and also more accurate than using BEM for fusing classifier outputs.
Diversity metrics
As discussed in the introduction, researchers do not agree on an exact definition of diversity or a definitive diversity metric. However, as mentioned by Polikar,1 an effort must be made to make the component classi-fiers of an MCS as diverse as possible to ensure an efficient MCS. In the sections below, the most common measures of diversity are discussed, as well as how to use them to create a diverse set of classifiers. The challenge we face with current diversity measures is that the goal of linking diversity to accuracy is ham-pered by the fact that there is not a one to one mapping between diversity and accuracy. For each diversity metric discussed below, an example is provided to dem-onstrate how different sets of classifier outputs may have the same diversity but vastly different accuracies. Diversity is easy to understand qualitatively, but dif-ficult to rigorously quantify. There are many different measures that have been proposed to measure diversity. Some of the most popular metrics are discussed below. Most diversity metrics are designed for pairwise com-parisons of classifiers. There are a few global diversity measures that can handle more than two classifiers such as Entropy and Kohavi–Wolpert Variance. A common approach is to compare multiple classifiers using pairwise diversity metrics by computing the diversity of every pairwise combination and averaging
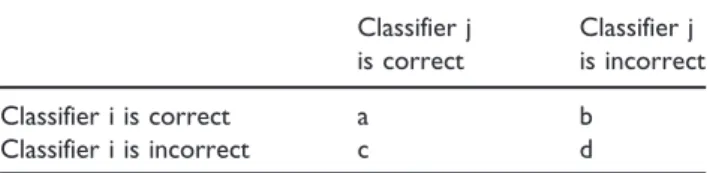
these results. In the pairwise diversity metrics, the con-vention used is the lettersa,b,c, drepresent fractions of instances as shown in Table 1.
Correlation
One of the most commonly used diversity metrics is the correlation between two classifiers, qi;j.
3
Maximum diversity is obtained when qi;j¼0. Correlation is cal-culated as qi;j¼ adbc ffiffiffiffiffiffiffiffiffiffiffiffiffiffiffiffiffiffiffiffiffiffiffiffiffiffiffiffiffiffiffiffiffiffiffiffiffiffiffiffiffiffiffiffiffiffiffiffiffiffiffiffiffiffiffiffiffiffiffi ðaþbÞðcþdÞðaþcÞðbþd Þ p ; 0 qi;j 1 (9) Two identical classifiers that produce identical labels haveq¼1 and fusing their outputs using BEM will give an MCS that has an accuracy equal to the accuracy of the individual classifiers. Another set of identical classi-fiers will also have q¼1, but if the accuracy of the individual classifiers in this new set does not equal the accuracy of the previously mentioned classifiers then the two MCSs will not have the same accuracy.
Yule’s Q
Yule’s Q statistic,Qi;jis another commonly used diver-sity metric, which takes on positive values if both clas-sifiers tend to correctly classify the same instances, and negative values if both classifiers tend to incorrectly classify the same instances.2 Maximum diversity is achieved at Qi;j¼0. Yule’sQis calculated as:
Qi;j¼
adbc
adþbc (10)
Two different MCSs can have the same Yule’s Q statistic as long as the products ad and bcremain the same. For example, if one MCS has a ¼0.85%,b ¼
0.05%,c¼0.05, andd¼0.05 and the other classifier has the same values except a and d have swapped values so a¼0.05 andb¼0.05 then both MCSs will have the same Yule’s Qstatistic but the first MCS will be very strong and the second MCS will be very weak.
Table 1. Reference for pairwise diversity metrics, from
ChoiChaand Tappert.19 Classifier j is correct Classifier j is incorrect Classifier i is correct a b Classifier i is incorrect c d
Disagreement
Disagreement, Di;j, is the probability that classifiers will disagree, and is calculated as3
Di;j¼bþc (11)
Maximum diversity is achieved whenDi;j¼1. Two different MCSs can have the same disagreement but different accuracies as long as the sum bþc remain the same. Similar to Yule’s Q statistic, if the valuesa
anddswap values, one MCS will be strong, while the other MCS will be weak even though they have the same disagreement.
Double fault
Double fault,DFi;j is the probability that both classi-fiers will misclassify an observation, and is equal tod3
DFi;j¼d (12)
Maximum diversity is achieved whenDFi;j¼0:Two MCSs will have the same double fault value as long as they have equal values d. One MCS may have 99% “double correctness” and 1% double-faults, while another MCS may have 99% “single faults” and 1% double-faults. The former MCS is far more robust than the latter MCS despite them having the same double-fault values.
Entropy
Entropy,E, operates under the assumption that diver-sity is highest if half of the classifiers are correct and half of the classifiers are wrong. Diversity is highest whenE¼1 and lowest whenE¼0. Entropy is calcu-lated as1 E¼ 1 N XN i¼1 1
T½T=2minðfi;ðTfiÞÞ (13)
wherefi is the number of classifiers that misclassified the observationxi, thereforeðTfiÞis the number of classifiers that correctly classified observationx, andN
is the number of observations in the data set. These definitions will also be used in the formula for Kohavi–Wolpert variance, discussed below. If one MCS always has three correct classifiers and two incor-rect classifiers and the second MCS always has two correct classifiers but three incorrect classifiers then they will have the same entropy values but different accuracies.
Kohavi–Wolpert variance
Kohavi–Wolpert variance is similar to the disagree-ment measure but can be calculated with more than two classifiers. Diversity is maximized when Kohavi– Wolpert variance is high. Kohavi–Wolpert variance is calculated as3 KW¼ 1 NT2 XN i¼1 fiðTfiÞ (14)
Kuncheva has proven that Kohavi–Wolpert vari-ance of an MCS is related to the average of all pairwise disagreement.3 Kohavi–Wolpert variance shares the same weaknesses as the entropy measure.
Methodology
Theory
Ruta and Gabrys11 claim the difference between abstract level fusion techniques and measurement level fusion techniques is the information used by each tech-nique, but there is one other difference that is important to this research. With an abstract level fusion method such as Majority Voting, class labels are given by each individual classifier then fused into a single label. Because class labels are given before the fusion takes place, each individual classifier can have its own decision threshold independent of the other classifiers. With a measurement level fusion method such as Mean Fusion, the measurements are fused and then a single label is made. Because there is only one label made (and it comes after fusion), there is only one decision thresh-old for the entire MCS. Although the measurement level fusion techniques make use of more information (fuzzy measures vs. binary labels), they lose degrees of freedom in that they cannot apply decision thresholds to individ-ual classifiers. The following section proposes an alter-nate scoring technique that attempts to keep the increased information of the fuzzy measures required for measurement level fusion but allows each classifier output to be transformed independently.
Alternative scoring technique
The proposed alternate scoring technique, conceptual-ized in Figure 2, transforms class probabilities into scores restricted to the interval [0, 1] by selection of a classification threshold,h.
The alternative scoring technique procedure takes clas-sifiert’s output probability of an observation belonging to class 1dt;1, and re-scores it todt;0 anddt;1:The score not only captures the predicted class for an exemplar but also the relative distance of the original classifier score to
the selected classification threshold dt;0 ¼max 0;hdt;1 h dt;1 ¼max 0;dt;1h h (15)
For an individual classifier, an assignment to class 0 would occur if dt;0>dt;1, and an assignment to class 1 would occur if dt;0 dt;1. A pictorial view of two examples is shown in Figure 3, once where dt;1>h;
and once where dt;1 < h. The alternate scoring
tech-nique will be applied to the classifier outputs prior to performing fusion, as opposed to the standard method which applies thresholds after performing fusion. The benefit of this is that it allows fusion methods employ-ing the alternate scoremploy-ing technique to look at many additional threshold combinations and explore a wider range of possible diversity and accuracy combi-nations. By allowing for individual classification thresholds, we can explore a greater range of diversity. To compare the procedural flow of the two methods, one can contrast Figures 1 and 2. Because the scores all fall on the same interval, we can perform the same fusion techniques on them as we could on class prob-abilities. We expect the performance of creating
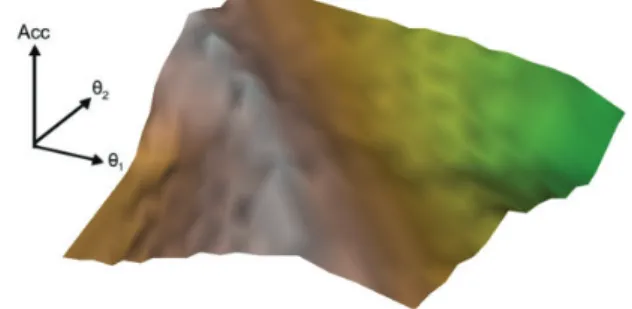
ensembles using this alternate scoring technique to per-form similarly to ensembles created using class proba-bilities. Mean fusion of ensemble alternate scores produces classification accuracy equal to mean fusion when allh¼0:5: A graphical comparison of the bene-fits of the alternate scoring technique is shown in Figure 3. Figure 4 shows an ensemble of two classifiers, with each point on this surface representing a single threshold combination, the height of the surface repre-sents the accuracy. The alternate scoring technique can explore this entire domain, allowing a more in-depth look at the relationship between accuracy and diversity.
Experiment
The primary goal of this research is to discover if a relationship between ensemble accuracy and diversity exists.
Example academic datasets
In order to avoid data-driven results and to examine the relationship between accuracy and diversity across a wide spectrum of problem characteristics, 14 data sets were obtained from the UCI Machine Learning Repository.20 The selected data sets: Balance Scale,21 Breast Cancer Wisconsin,22 BUPA Liver Disorders23 Credit Approval,24 Glass,25 Haberman’s Survival,26 Fisher’s Iris,27 Mammographic Masses,28 Parkinson’s,29 Pima Indians Diabetes,30 Spambase,31 SPECTF,32 Transfusion,33 and Wisconsin Diagnostic Breast Cancer.34 These datasets have between 3 and 58 features, tens to thousands of observations, and benchmark accuracy values between 65% and 95%. All data sets have two classes or have been coerced into two class data sets by grouping similar classes until there are two distinct classes.
Classification algorithms
Six classifiers were employed to examine diversity and accuracy in ensembles:
• Quadratic discriminant analysis (QDA)
1 0 1 0 Q= 0.4 dt,1= 0.75 Q= 0.6 dt,1= 0.25 (a) (b)
Figure 3. Graphical representation of proposed alternative scoring technique: (a) Using the alternate scoring technique, support for class 1 (d*t,1) is 0.35/0.6¼0.58, support for class 0 (d*t,0) is 0 sincedt,1>H. (b) A second example gives a support for class 0, (d*t,0) 0.45/0.6¼0.75, support for class 1 (d*t,1) is 0 sincedt,1<H.
Figure 4. Sample accuracy surface over a range of thresholds.
Classifier 1 Classifier 2 Classifier T Fusion Threshold 1 Threshold 2 Threshold T
Figure 2. Conceptualization of proposed alternative scoring technique.
• k-Nearest Neighbors (kNN)
• Feed Forward Neural Network (FFNN) • Radial Basis Function (RBF)
• Probabilistic Neural Network (PNN) • Support Vector Machines (SVM).
Classifier settings and background were as follows: 1. QDA was considered, consistent with Wu et al.,35if
a dataset was rank deficient then LDA, consistent with, Wu et al.35and Bihl et al.36was used.
2. kNN was employed consistent with Fukunaga and Narendra,37 using the e1071 package38 and default options.
3. FFNN was implemented per MeyerDimitriadou et al.39with one hidden layer with three nodes (used throughout), with a “softmax” (log-linear model). 4. RBF was implemented per Chen et al.40 and
DemuthBeale and Hagan,41 with mean squared error goal of 0.0, spread¼1.0, max neurons equal to the number of input vectors, and 25 neurons added between displays.
5. PNNs were considered, per literature,42–44 with a radial basis function spread of 0.1
6. SVMs used the e1071 package was used, c.f.,38with a linear kernel and default e1071 options.
For algorithms with tunable architecture settings, e.g. kNN, FFNN, RBF, PNNs, and SVMs, perfor-mance gains would logically be possible by selecting settings for each dataset. However, the authors have aimed for repeatability, consistent with the study in Liu and Zaidi,45 in this study by using global settings which are likely overall suboptimal.
Experiment description
An area not examined in prior research and provided for by our alternate scoring technique is the relation-ship between accuracy and diversity over the entire domain of individual classifier thresholds. Most prior research has only investigated ensemble performance at single classification thresholds (typically h¼0:5). In the few studies where the thresholds were varied, only ROC curves of single classifier accuracy and MCS accuracy are presented. The ensembles we construct vary the classification threshold independently for each classifier and employ our proposed alternate scor-ing technique. Each unique combination of component classifiers and threshold settings produces a unique MCS whose accuracy and diversity may be examined. Another way to think of this experiment is as a full factorial design with the factors and levels as given in Table 2. This creates an experiment with 69,138,720 points. To evaluate the created ensembles, a function
was created that takes as input the test and validation class probabilities from three classifiers, three individ-ual classification thresholds as well as the truth. Using this information, the function performs the alternate scoring technique, calculates the diversity metrics, per-forms the fusion techniques, and returns the perfor-mance metrics of the fused ensembles. This function can be thought of as a wrapper that takes an ensemble and returns the desired performance metric, accuracy, and the desired diversity metrics; Correlation, Yule’s Q, Disagreement, Double Fault, Entropy, and Kohavi–Wolpert Variance.
f
test;validate; class:1; class:2;class:3;
h1;h2;h3;truth ¼acc;q;Q;D;DF;E;KW 0 B B B B B @ 1 C C C C C A (16)
In our experiments, every possible ensemble of three classifiers was evaluated at every threshold from 0.05 to 0.95 with threshold step sizes of 0.05. The diversity metrics and ensemble performances were saved in a database and used in the analysis performed.
Looking for relationships
There are a number of different ways to look for a relationship between accuracy and diversity with the wealth of data produced by our experimental design. One preprocessing step taken for all procedures was to map the diversity metrics to the interval [0, 1] where 0 is minimum diversity and 1 is maximum diversity. This mapping facilitates comparisons between accuracy and
Table 2. Experiment factor/level description.
Factor # Levels Notes
Data set 14 Previously mentioned data
sets from UCI Machine Learning Repository
Fusion method 6 Maj. Vote, BEM, GEM,
Product, Min, Max
Diversity metric 6 Correlation, Yule’s Q,
Disagreement, Double Fault, Entropy, Kohavi-Wolpert Variance
Classifiers 20 Out of six different classifiers
(QDA, kNN, FFNN, RBF, PNN, and SVM), select 3 to make an ensemble
Thresholds 6859 19 thresholds (0.05 to 0.95 by
0.05) for each of the three classifiers in the ensemble
diversity and allows their relative affects to be com-pared directly. Some diversity metrics already meet this criteria, such as disagreement and entropy. The remaining of the diversity metrics are mapped in the following manner q¼1 jqj Q¼1 jQj DF¼1 jDFj KW¼3KW (17)
Correlations
The first logical step to uncovering a relationship between diversity and accuracy is to determine if there is a linear correlation between the diversity metrics col-lected and the ensemble accuracies. The correlation between test set diversity and test set accuracies are examined for within set correlation, and the correlation between test set diversity and validation set accuracies are examined for between set correlation.
Regression
Another possible way to uncover a relationship between diversity and accuracy is through linear regres-sion. If there is a relation between diversity and accu-racy then the validation set accuaccu-racy may be able to be predicted by test set diversity (which would be very useful in ensemble building). It is probable that test set accuracy is the main predictor of validation set accuracy and that diversity may only explain some of the residual error. To determine if this is the case, four regressions are performed on each data set- one with diversity as the only regressor, one with accuracy as the only regressor, one with both diversity and accura-cy as regressors, and one with diversity and accuraaccura-cy as regressors including their interaction. In each regres-sion, the accuracy from the validation set is used as the dependent variable and all of the independent variables come from the test set. This ensures that the regressions show the actual predictive power of the independent variables and does not show spurious correlation within the test set. The regression results are examined to determine the effect of test set diversity and accuracy on validation accuracy. To account for the effects of the diversity metric used, the data set, the ensemble combination, and the fusion technique used, dummy variables are encoded. These dummy variables are included as main effects to allow for a change in the regression intercept, and are also interacted with testing accuracy, AccTST, and diversity, Div, to allow for the coefficients for accuracy and diversity to change based
on the ensemble’s properties (diversity metric, data set, and fusion technique). A regression of validation set accuracy with test set accuracy and diversity as the regressors without dummy variables is shown below
d
Accval¼b0þb1AccTSTþb2Div (18)
This regression does not take into account the diver-sity metric, data set, and fusion technique in use. The full regression with dummy variables is
d
Accval¼b0þb1AccTSTþb2Divþb3D1þb4D2þb5D3 þb13AccTSTD1þb14AccTSTD2þb15AccTSTD3 þb23DivD1þb24DivD2þb25DivD3
(19) where D1 is the vector of dummy variables associated
with which diversity metric is used, D2is the vector of
dummy variables associated with the data set the ensemble comes from, and D3is the vector of dummy
variables associated with the fusion technique used.D1
could be [00000] which would indicate the first diversity metric being used (correlation), a vector of [10000] would indicate the second diversity metric (Yule’s Q), [01000] would indicate the third diversity metric being used (double-fault), etc. The other dummy variable vectors for data set and fusion technique are arranged similarly. The b0j s and b0ijs associated with dummy variables are a vector as well. This full regression with dummy variables not only allows for the change of intercept and coefficients depending on the dummy variables and their interactions, it also allows for test-ing the statistical significance of the dummy variables and the information they are associated with.
Ensemble selection
To examine the utility of diversity to determine classi-fier membership in an ensemble, three ensemble selec-tion schemes are used on the test set and compared against the most accurate ensemble and threshold com-bination in each validation set. The first scheme selects the ensemble with the highest ensemble test accuracy. The second scheme selects the ensemble with the three classifiers with the highest individual test accuracy. The third scheme selects the ensemble with the highest test diversity. These schemes are performed with each fusion type and their validation set accuracy is com-pared to the best ensemble’s validation accuracy as determined by the oracle. These comparisons will be placed in percentages for relative comparison across fusion techniques, diversity measures, and data sets. If diversity is a useful metric to select classifiers for
an ensemble then the selection schemes that use diver-sity should compare favorably against the selection schemes that use accuracy.
Results
In our analysis, we evaluate the performance of the alternate scoring technique and ensure that it did allow us to look at a greater range of diversity. Next, we show the linear correlation between accuracy and the different diversity measures and the relative effects of accuracy versus diversity using regression techniques. Finally, we demonstrate the utility of selecting MCS membership using diversity as the primary criteria per-forms against using accuracy as the primary criteria. The experimental results first establish that the alternate scoring technique does provide ensemble selection over a wider range of diversity. Next, the correlation between accuracy and the examined diversity measures is exam-ined. Following that outcome, the results from the regressions and the utility of using test accuracy and diversity to predict ensemble performance with valida-tion data are presented.
Alternative scoring technique
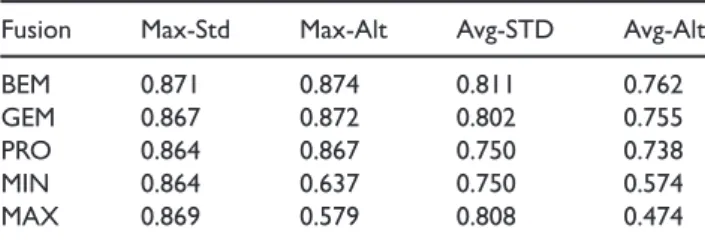
The alternate scoring technique in general did not pro-vide higher MCS accuracy but did allow examination of a greater range of diversity. For three of the fusion techniques: BEM, GEM, and Product Rule (denoted PRO in the tables), the alternate scoring technique was able to achieve a higher level of accuracy. With the two remaining fusion techniques, MIN and MAX, the alternate fusion technique did not achieve a very high level of accuracy. This is attributed to the manner in which the alternate scoring technique forces one of the scores to become zero which can greatly affect the behavior of these statistics. Table 3 shows a compari-son of the alternate scoring technique’s maximum and average performance for each fusion technique applied, averaged across all data sets. It is apparent the alter-nate scoring technique has the potential to perform as well as the standard method but loses some accuracy in the “tails” as the accuracy of the alternate scoring tech-nique averaged across the range of classification thresh-olds is lower than the standard method. While we are pleased that the alternate scoring technique showed a potential improvement in “tuning” some ensemble techniques for better performance, the actual perfor-mance of alternate scoring technique is not of interest for this study. The primary reason for applying this technique is to allow us to examine a greater range of classification threshold combinations and a greater range of diversity. This focus on achieving greater
diversity is why we feel that the lower average perfor-mance of the alternate scoring technique is acceptable.
Diversity increase
Using the alternate scoring technique allowed the exploration of ensembles over a wider range of diver-sity. The expectation was that this greater range of diversity achieved would provide greater insight into the relationship between the accuracy and diversity of an MCS. As shown in Table 4 the alternate scoring technique achieves a higher range of diversity for every diversity metric. The diversity ranges are aver-aged across all data sets in Table 4. The use of the alternate scoring technique increased the diversity for every data set and all diversity metrics.
Ensemble combinations
The results of the experiment are described in Table 2.
Correlations
Similar to Kuncheva,10we begin our exploration of the relationship between diversity and accuracy by exam-ining the correlation coefficient between the two meas-ures. For each diversity metric and fusion method, we calculated the Pearson’s r coefficient between the test diversity and test accuracy to determine if there was any within set correlation. The Pearson’s r coefficient between the test diversity and validation accuracy was also examined to determine if there was any between
Table 3. Comparison of standard method to alternative scoring technique-achieved accuracy.
Fusion Max-Std Max-Alt Avg-STD Avg-Alt
BEM 0.871 0.874 0.811 0.762
GEM 0.867 0.872 0.802 0.755
PRO 0.864 0.867 0.750 0.738
MIN 0.864 0.637 0.750 0.574
MAX 0.869 0.579 0.808 0.474
BEM: basic ensemble model; GEM: generalized ensemble model; PRO: product.
Table 4. Comparison of standard method to alternative scoring technique-achieved diversity range.
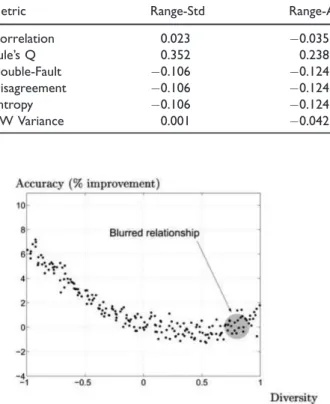
Metric Range-Std Range-Alt
Correlation 0.924 0.967 Yule’s Q 0.955 0.982 Double-fault 0.408 0.424 Disagreement 0.549 0.653 Entropy 0.823 0.979 KW Variance 0.549 0.653
set correlation that could possibly be exploited for ensemble selection. The correlation aggregated by diversity metric is perhaps the most informative, and is presented in Table 5.
The correlation for all diversity metrics is small, and for most of the metrics, the sign is opposite what the conventional wisdom states. The conventional wisdom says that higher diversity should lead to higher accura-cy and therefore have a positive correlation, but most of the correlation coefficients observed are negative. This result is supported, however, by Kuncheva10 where she shows how for most of the diversity range there is a negative correlation with accuracy as shown in Figure 5, but once diversity exceeds a certain (fairly high) threshold, the relationship reverses to a positive correlation.
We believe that these results do not show anything new or novel; however, they serve to illustrate some common sense concepts about diversity. The more accurate a group of classifiers are, the less opportunity there is for diversity to exist. At the most extreme case if all the classifiers are 100% accurate then the ensem-ble will have zero diversity. Similarly, if all the classi-fiers are completely wrong then zero diversity will exist for all measures except for measures such as double-fault that only measure “half” the picture of diversity. We mentioned in the ‘Diversity metrics’ section, how
each of the diversity measures we examined can pro-duce multiple accuracy values for the same diversity value. Therefore, the results we observed are expected, there cannot be a one-to-one relationship between diversity and accuracy so no measure of correlation, linear or non-linear, will be able to show anything but a general trend. With regard to the double-fault measure, recall that double-fault measures the proba-bility that both classifiers will misclassify an observa-tion. We then changed to using the diversity score of
DF¼1jDFj so this now captures the probability that at least one classifier will correctly classify an observation. It should be clear then that this measure will have a positive correlation with accuracy.
Regression results
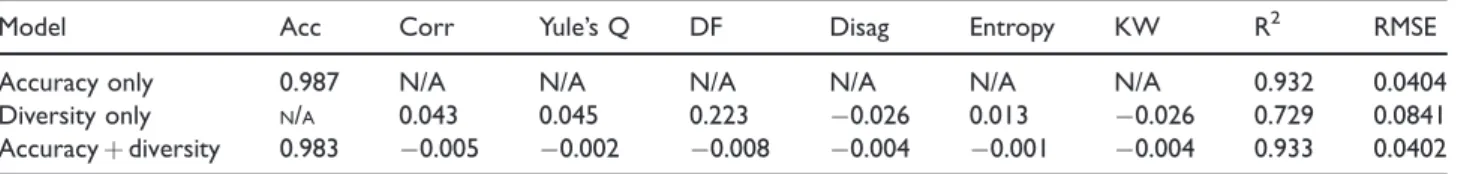
Regression analysis was performed to determine if a relationship exists between accuracy and diversity and can be used for ensemble selection. With this goal in mind, we use ensemble validation set accuracy as the response and metrics from the test set as the regressors. This process emulates a real-world application of pick-ing an ensemble based on test set performance, with the validation set as new observations that are classified after an ensemble is selected. We performed three regres-sions; using test set accuracy as the only regressor, using test set diversity as the only regressor, and using both test set accuracy and diversity as regressors. Dummy variables were coded to allow for differences between data sets, fusion techniques, as well as the different diversity metrics. The primary focus was the coefficients related to accuracy and diversity, which gave insight on the relationship between accuracy and diversity. The results of the regressions are presented in Table 6, including the coefficients we were interested in as well as two measures of prediction performance (consistent with KutnerNachtsheim et al.46), the coefficient of deter-mination (R2) and root mean square error (RMSE). With over 69 million data points, practically any non-zero number will be statistically significant, c.f.,47–50thus statistical significance of the coefficients was not considered.
Readily apparent is that while diversity may be used as a selection criteria, diversity as the only regressor has the lowest R2 and highest RMSE of the regressors examined. While an R2 of 0.729 certainly indicates that diversity does offer some explanatory power for validation accuracy, it is outweighed by the much greater explanatory power of test set accuracy.
When both accuracy and diversity are included the linear model, theR2is increased only slightly, indicat-ing that diversity does not provide much explanatory power beyond what accuracy already provides. Since all of the regressors are bounded on the same interval
Table 5. Correlations by diversity metric.
Metric Range-Std Range-Alt
Correlation 0.023 0.035 Yule’s Q 0.352 0.238 Double-Fault 0.106 0.124 Disagreement 0.106 0.124 Entropy 0.106 0.124 KW Variance 0.001 0.042
Figure 5. A typical accuracy-diversity scatterplot. Reprinted
[0, 1], their coefficients can be directly compared to look at the effect of accuracy and each diversity metric. It is apparent that test set accuracy has a far greater impact on the validation set accuracy than any of the diversity metrics, indicating that even a large change in test diversity can only affect a small change in validation set accuracy. One observation to note is that of the diversity measures examined, the double-fault metric initially appears to be the best in terms of explanatory power. We believe this is again due to the fact that double-fault is more of a secondary mea-sure of accuracy than it is a meamea-sure of diversity. As evidence of this, the coefficient for double-fault is relatively large compared to the other diversity meas-ures when accuracy is not included in the regression, but when accuracy is included in the regression, the coefficient for the double-fault metric decreases to a level comparable to the other diversity measures.
Ensemble selection results
As a result of creating every possible ensemble combi-nation, it was possible to determine which one of the possible ensembles was optimal for classifying each val-idation set. For each data set and fusion technique, there is an ensemble that delivers the maximum possi-ble accuracy that can be obtained by choosing the very best combination of classifiers classification thresholds. We call these best possible ensembles “oracles” because that is the ensemble that an all-knowing oracle would select if it desired maximum performance. In our
analysis, ensembles were selected based on results from the test set and the performance those ensembles achieved on the validation set was compared to the best ensemble selected by the oracle. Each selected ensem-ble’s validation accuracy was compared to the oracle validation accuracy as a percentage
% Achieved¼Val: Acc: of given ensemble
Oracle Val: Acc: (20)
The selection criteria used were ensemble test accura-cy, individual classifier accuraaccura-cy, and all six test diversity metrics. The percent performance that each selection criteria achieved, aggregated by fusion method, is shown in Table 7. In table 7, the best selection techni-ques based on accuracy and the best selection technitechni-ques based on the diversity measure are shown in bold.
As shown in Table 7, selecting ensembles based on accuracy achieves the highest performance for all fusion techniques, while selecting ensembles based on diversity gives lower performance. In fact, the lowest performing accuracy selection technique is never beaten (and is only tied once) by the highest performing diversity selection technique regardless of the fusion technique used. The double-fault diversity metric performed the best out of all the diversity metrics, but this is somewhat expected because of the inherent link between accuracy and the double-fault metric. This analysis shows that, even with an expanded range of diversity, test set accuracy should be the primary criteria for selecting ensembles. If there are two ensembles that tie in accuracy criteria, diversity
Table 6. Regression coefficientsþresults.
Model Acc Corr Yule’s Q DF Disag Entropy KW R2 RMSE
Accuracy only 0.987 N/A N/A N/A N/A N/A N/A 0.932 0.0404
Diversity only N/A 0.043 0.045 0.223 0.026 0.013 0.026 0.729 0.0841
Accuracyþdiversity 0.983 0.005 0.002 0.008 0.004 0.001 0.004 0.933 0.0402
RMSE: root mean square error.
Table 7. Percent achieved by fusion technique.
Accuracy Diversity
Fusion
technique Ensemble Individual Corr Yule’s Q DF Disag Entropy KW
BEM 94 95 90 90 93 91 91 91 GEM 93 93 87 89 91 86 86 86 PRO 95 93 78 80 78 66 66 66 MIN 95 93 78 80 78 66 66 66 MAX 95 95 90 88 91 91 91 91 MVOTE 93 95 86 86 93 83 83 83
may be useful as a secondary criteria to break the tie, this will be investigated in further research.
Conclusions
This research presented an alternate scoring technique that allowed a wider range of diversity to be reached when creating MCSs. It demonstrated that there is not a one-to-one relationship between diversity and accura-cy. Among the diversity measures examined, we single out the double fault metric as appearing to be the best measure, but this is likely due to its inherent link to accuracy and not due to it being a good measure of diversity. We have shown that validation accuracy is related to diversity but is greatly outweighed by the rela-tionship between test set accuracy and validation accu-racy. With our alternate scoring technique allowing us a wider range of ensembles to examine, we confirm that test set accuracy is still the best way to select ensembles.
Disclaimer
The views expressed in this article are those of the authors and do not reflect the official policy of the United States Air Force, Department of Defense, or the U.S. Government. Declaration of Conflicting Interests
The author(s) declared no potential conflicts of interest with respect to the research, authorship, and/or publication of this article.
Funding
The author(s) received no financial support for the research, authorship, and/or publication of this article.
References
1. Polikar R. Ensemble based systems in decision making.
IEEE Circuits Syst Mag2006; 6: 21–45.
2. Windeatt T. Diversity measures for multiple classifier system analysis and design.Inform Fusion2005; 6: 21–36. 3. Kuncheva L and Whitaker C. Measures of diversity in classifier ensembles and their relationship with the ensem-ble accuracy.Mach Learn2003; 51: 181–207.
4. Aksela M and Laaksonen J. Using diversity of errors for selecting members of a committee classifier. Pattern Recog2006; 39: 608–623.
5. Brown G, Wyatt J, Harris R, et al. Diversity creation methods: a survey and categorisation. Inform Fusion
2005; 6: 5–20.
6. Brown G and Kuncheva L. “Good” and “bad” diversity in majority vote ensembles. In:International workshop on multiple classifier systems, Cairo, Egypt, 7–9 April 2010, pp. 124–133. Berlin, Heidelberg: Springer.
7. Canuto A, Abreu M, de Melo Oliveira L, et al. Investigating the influence of the choice of the ensemble members in accuracy and diversity of selection-based and
fusion-based methods for ensembles.Pattern Recog Lett
2007; 28: 472–486.
8. Gacquer D, Delcroix V, Delmotte F, et al. On the effectiveness of diversity when training multiple classifier systems. In:European conference on symbolic and quanti-tative approaches to reasoning and uncertainty, Verona, Italy, 1–3 July 2009, pp. 493–504. Berlin, Heidelberg: Springer.
9. Hadjitodorov ST, Kuncheva LI and Todorova LP. Moderate diversity for better cluster ensembles. Inform Fusion2006; 7: 264–275.
10. Kuncheva L. That elusive diversity in classifier ensem-bles. In: Iberian conference on pattern recognition and image analysis, Puerto de Andratx, Mallorca, Spain, 4–6 June 2003, pp. 1126–1138. Berlin, Heidelberg: Springer.
11. Ruta D and Gabrys B. Analysis of the correlation between majority voting error and the diversity measures in multiple classifier systems. In:4th international symposium on soft computing, Paper No. 1824-025, Paisley, UK, 2001, ISBN: 3-906454-27-4, pages 1–7
12. Shipp C and Kuncheva L. Relationships between combi-nation methods and measures of diversity in combining classifiers.Inform Fusion2002; 3: 135–148.
13. Didaci L, Fumera G and Roli F. Diversity in classifier ensembles: fertile concept or dead end? In:International workshop on multiple classifier systems, Nanjing, China, 15–17 May 2013, pp. 37–48. Berlin, Heidelberg: Springer. 14. Wang S and Yao X. Relationships between diversity of classification ensembles and single-class performance meas-ures.IEEE Trans Knowledge Data Eng2013; 25: 206–219. 15. Mohamad M, Saman MYM and Hitam MS. The use of output combiners in enhancing the performance of large data for ANNs.IAENG Int J Comput SciFeb 13, 2014; 41(1): 38–47.
16. Mohamad M and Saman M. Comparison of diverse ensemble neural network for large data classification.
Int J Adv Soft Comput Appl2015; 7(3): 67–84.
17. Kuncheva LI. Diversity in multiple classifier systems.
Inform Fusion2005; 6: 3–4.
18. Perrone MP and Cooper LN. When networks disagree: ensemble methods for hybrid neural networks. InHow We Learn; How We Remember: Toward An Understanding Of Brain And Neural Systems: Selected Papers of Leon N Cooper. Brown University, Providence, RI, pp. 342–358. 19. Choi S, Cha S and Tappert C. A survey of binary simi-larity and distance measures. J Syst Cybernet Inform
2010; 8: 43–48.
20. Lichman M. UCI machine learning repository, http:// archive.ics.uci.edu/ml (2013, accessed 10 January 2018). 21. Siegler RS. Three aspects of cognitive development.Cogn
Psychol1976; 8: 481–520.
22. Mangasarian OL and Wolberg WH. Cancer diagnosis via linear programming.SIAM News1990; 23: 1–18. 23. Forsyth RS. Liver disorders. In: PC/BEAGLE user’s
guide.Bupa Medical Research Ltd, 1990.
24. Quinlan JR. Simplifying decision trees.Int J Man Mach Stud1987; 27: 221–234.
25. Evett I and Ernest J. Rule induction in forensic science, reading, Berkshire RG7 4PN: Central Research Establishment. Home Office Forensic Science Service, 1987. 26. Haberman SJ. Generalized residuals for log-linear models. In:Proceedings of the 9th international biometrics conference, 1976, pp. 104–122.
27. Fisher R. The use of multiple measurements in taxonomic problems.Ann Eugen1936; 7: 179–188.
28. Elter M, Schulz-Wendtland R and Wittenberg T. The prediction of breast cancer biopsy outcomes using two CAD approaches that both emphasize an intelligible decision process.Med Phys2007; 34: 4164–4172. 29. Little M, McSharry P, Roberts S, et al. exploiting
non-linear recurrence and fractal scaling properties for voice disorder detection.Biomed Eng Online2007; 6: 23. 30. Smith J, Everhart J, Dickson W, et al. Using the ADAP
learning algorithm to forecast the onset of diabetes mel-litus. In:Proceedings of the symposium on computer appli-cations and medical care, Washington DC, 6–9 November 1988, pp. 261–265. Institute of Electrical and Electronics Engineers.
31. Hopkins M, Reeber E, Forman G, et al.Spam base data-set. Hewlett-Packard Labs, 1999.
32. Kurgan L, Cios K, Tadeusiewicz R, et al. Knowledge discovery approach to automated cardiac SPECT diag-nosis.Artif Intell Med2001; 23: 149–169.
33. Yeh I-C, Yang K-J and Ting T-M. Knowledge discovery on RFM model using Bernoulli sequence.Exp Syst Appl
2009; 36: 5866–5871.
34. Street W, Wolberg W and Mangasarian O. Nuclear fea-ture extraction for breast tumor diagnosis. InBiomedical Image Processing and Biomedical Visualization, Vol. 1905. International Society for Optics and Photonics. San Jose, CA, 1993, pp. 861–871.
35. Wu W, Mallet Y, Walczak B, et al. Comparison of reg-ularized discriminant analysis linear discriminant analysis and quadratic discriminant analysis applied to NIR data.
Anal Chim Acta1996; 329: 257–265.
36. Bihl TJ, Bauer K and Temple MA. Feature selection for RF fingerprinting with multiple discriminant analysis and
using ZigBee device emissions. IEEE Trans Inform Forensic Secur2016; 11: 1862–1874.
37. Fukunaga K and Narendra PM. A branch and bound algorithm for computing k-nearest neighbors. IEEE Trans Comput1975; C-24: 750–753.
38. Meyer D, Dimitriadou E, Hornik K, et al. “ackage ’e1071’, CRAN R Project., 2015.
39. Ripley B, Venables W and Ripley B. Package ‘nnet’. R package version, 2016.
40. Chen S, Cowan C and Grant PM. Orthogonal least squares learning algorithm for radial basis function net-works.IEEE Trans Neural Netw1991; 2: 302–309. 41. Demuth H, Beale M and Hagan M. Radial basis
net-works (Chapter 7). In: Neural network toolbox. The MathWorks, Inc., 2008.
42. Wasserman P. Advanced methods in neural computing. New York: Van Nostrand Reinhold, 1993, pp. 35–55. 43. Situ J, Friend M, Bauer K, et al. contextual features and
Bayesian belief networks for improved synthetic aperture radar combat identification.Milit Oper Res J2016; 21: 89–106.
44. Specht D. Probabilistic neural networks. Neural Netw
1990; 3: 109–118.
45. Liu N and Zaidi NA. Artificial neural network: deep or broad? An empirical study. In:Australasian joint con-ference on artificial intelligence, Hobart, TAS, Australia, 5–8 December 2016, pp. 535–541. Berlin, Heidelberg: Springer.
46. Kutner M, Nachtsheim C, Neter J, et al.Applied linear statistical models. New York: McGraw-Hill Irwin, 2005. 47. Matthews JN and Altman DG. Interaction 2: compare
effect sizes not P values.BMJ1996; 313: 808–828. 48. Boos DD and Stefanski LA. P value precision and
repro-ducibility.Am Stat2011; 65: 213–221.
49. Anderson DR, Link WA, Johnson DH, et al. Suggestions for presenting the results of data analysis. J Wildlife Manage2001; 65: 373–378.
50. Halsey LG, Curran-Everett D, Vowler SL, et al. The fickle P value generates irreproducible results.Nat Meth