Towards Actionable Visualization for Software Developers
Leonel Merino, Mohammad Ghafari and Oscar Nierstrasz
Software Composition Group, University of Bern, Bern, Switzerland
Correspondence
Email: {merino, ghafari, oscar}@inf.unibe.ch
Abstract
Abundant studies have shown that visualization is advantageous for software developers, yet adopting visualization during software development is not a common practice due to the large effort involved in finding an appropriate visualization. Developers require support to facilitate that task.
Among 368 papers in SOFTVIS/VISSOFT venues, we identify 86 design study papers about the application of visualization to relieve concerns in software development. We extract from these studies the task, need, audience, data source, representation, medium and tool; and we charac-terize them according to the subject, process and problem domain. On the one hand, we support software developers to put visualization in action by mapping existing visualization techniques to particular needs from different perspectives. On the other hand, we highlight the problem domains that are overlooked in the field and need more support.
KEYWORDS:
software visualization taxonomy, actionable visualization, literature review
1
INTRODUCTION
Software visualization provides enormous advantages for the development process; to name a few, it supports project managers in communicating insights to their teams1, it guides testers when exploring code for anomalies2, it helps analysts to make sense of multivariate data3, and it aids new developers in open software communities4. However, visualization is not yet commonly used by developers. More than a decade ago researchers wonderedwhy is software visualization not widely used?5. They observed that one of the reasons is that efforts in software visualization are out of touch with the needs of developers6. Several attempts have tried to fill in the gap and encourage developers to adopt visualization. For instance, Maleticet al.7proposed a taxonomy of software visualization to support various tasks during software development; Schotset al.8extended this taxonomy by adding the resource requirements of visualizations, and providing evidence of their utility; Storeyet al.9proposed a framework to assess visualization tools; Kienleet al.10performed a literature survey to identify quality attributes and functional requirements for software visual-ization tools; Paddaet al.11proposed some visualization patterns to guide users in understanding the capabilities of a given visualization technique; Sensalireet al.12classified the features that users require in software visualization tools; and Merinoet al.13proposed meta-visualization of key-words that represent development concerns connected to visualization examples for helping developers to find suitable visualizations. However, the lack of organization among visualization approaches is still an important barrier to finding and using them in practice8. In fact, developers are still unaware of existing visualization techniques to adopt for their particular needs. A few studies have tried to address this issue by investigating to which software engineering tasks particular visualization techniques have been applied14,15,16. Nevertheless, we believe these studies are still too coarse-grained to match a suitable visualization to their concrete needs.
When developers perform a particular programming task they ask some questions such as“what code is related to a change?”or“where is this method called?”Several studies have investigated such questions and classified them into groups17,18,19. Indeed, such questions reflect developer needs, and we believe that mapping them to existing types of visualization can help developers to adopt visualization in their daily work. In particular, we would like to answer the following research questions:
source:
https://doi.org/10.7892/boris.126935
RQ1. What are the characteristics of visualization techniques that support developer needs?
RQ2. How well are developer needs supported by visualization?
We believe answering these questions, (1) helps practitioners to find suitable visualization for their specific needs, and (2) assists researchers in the field to identify needs with little visualization support.
This article is an extension of previous work20in which we analyzed 65 design study papers that we classified by task, need, audience, data source, representation, medium and tool. We grouped needs by the problem domains that we discussed in relation to the proposed visualization techniques. The extension we present here consists of 86 design study papers,i.e., a 32% increase in size (Tables 2 and 3 ). In addition to a problem-oriented classification we also perform subject (Table 11 ) and process-oriented (Table 12 ) classifications, we cross-validate our findings by consulting 57% of the authors of the included studies, and finally we thoroughly discuss the evolution of the community in software visualization.
In particular, we review 86 design studies from which we extracted task, need, audience, data source, representation, medium and tool. We characterize them according to the subject, process and problem domain that we discuss in relation to the proposed visualization techniques. We found that one third of the studies combined various visualization techniques, but most of them belong to one of the following three types: (1) techniques that usegeometric transformationsto explore structure and distributione.g., Parallel Coordinates, (2)stackedtechniques that are tailored to present data partitioned in a hierarchical fashione.g., Treemap, and (3)pixel-orientedtechniques that are suitable for displaying large amounts of datae.g., Table lens. We found that software visualizations address problem domains that receive diverse levels of attention from developers. That is, many visualizations have been proposed to tackle problems in domains that are highly important for developers such as history and debugging, but also in domains that are reported less frequently among developers such as dependencies and concurrency. In contrast, there is little support for needs in contract and policy domains, which are fairly important for developers.
The remainder of the paper is structured as follows: Section 2 describes the methodology that we followed to collect relevant literature and select design studies proposed in the software visualization field; Section 3 presents our results by classifying them based on theirtask,need, audi-ence,data source,representation,tool, andmedium7; Section 4 discusses our research questions and threats to validity of our findings, and Section 5 concludes and presents future work.
2
METHODOLOGY
We applied the Systematic Literature Review (SLR) approach, a rigorous and auditable research methodology forEvidence-Based Software Engineer-ing(EBSE). The method offers a means for evaluating and interpreting relevant research to a topic of interest. We followed Keele’s comprehensive guidelines21, which make it less likely that the results of the literature survey will be biased.
2.1
Data sources and search strategy
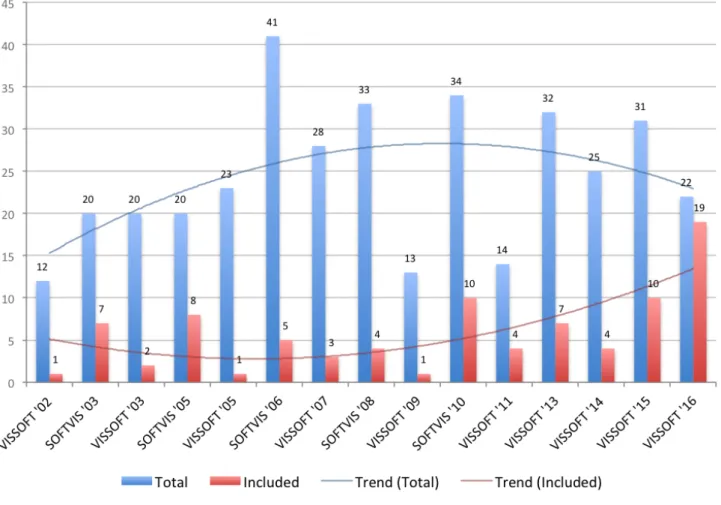
We sought papers that are relevant to the aim of this study,i.e., that propose a visualization technique useful to solve a specific problem in software development. Although such papers are expected to be found across multiple software engineering venues, we decided to collect them from the complete set of papers published by SOFTVIS22and VISSOFT23. We opted for these two venues because we believe their fifteen editions and hun-dreds of papers dedicated specially to software visualization offer a sound body of literature reflected in the good (B) classification that they obtain in the CORE ranking24(which considers citation rates, paper submission and acceptance rates among other indicators). Figure 1 summarizes the number of papers collected as well as those included in this study.
2.2
Included and excluded studies
We searched for problem-driven studies in which we could identify the role of the user, specific development needs, a proposed visualization tech-nique, and an evaluation demonstrating utility. We excluded short papers of one or two pages (like posters, keynotes and challenges) which due to limited space are unlikely to contain enough detail. We also excluded short papers for which a longer version exists. Of the 295 remaining papers we selected design study papers that describe how a visualization is suitable for tackling a particular problem in software development. We included such papers in our study and excluded papers in the other categories proposed by Munzner25(evaluation, model, system and technique) because we considered them unlikely to provide a visualization to tackle a problem in software development.
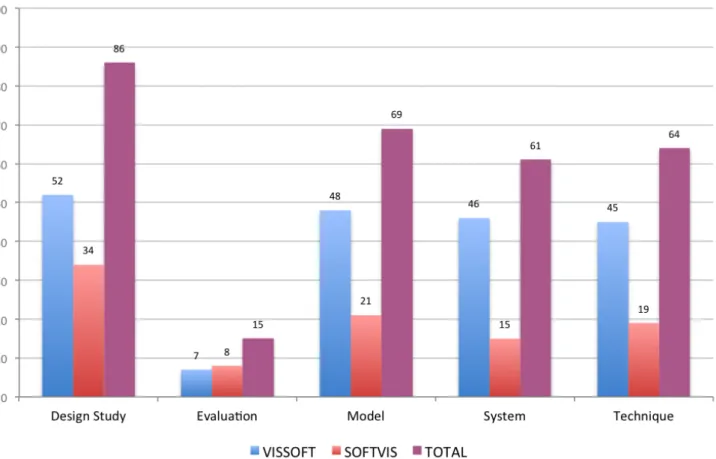
We classified the types of papers by first reading the abstract, second the conclusion, and finally, in the cases where we still were not sure of their main contribution, reading the rest of the paper. Although some papers might exhibit characteristics of more than one type, we classified them focusing on their primary contribution. Figure 2 shows the outcome of our classification. We identified 86 design study papers and included them
FIGURE 1 The 86 included papers from the collection of 368 papers published in SOFTVIS/VISSOFT venues.
in the study. Although more than two thirds of the papers came from VISSOFT, selected papers that we classify as design studies are moderately balanced.
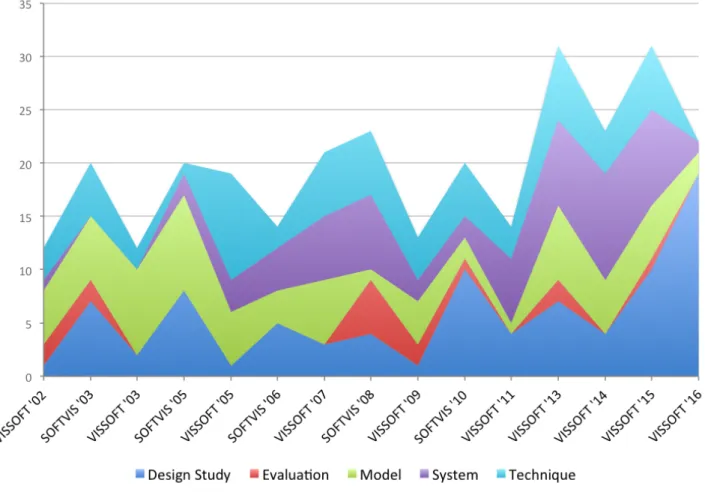
A frequent critique of visualization papers is their lack of evaluation. Indeed, Figure 3 shows that papers that take evaluation as their main focus are unusual. The chart also shows an important increment in the number of design study papers in VISSOFT’16, while only a few correspond to model and system papers. Traditionally, the number of papers in SOFTVIS editions (2003-2010) was consistently higher than in VISSOFT workshops (2002-2011). The trend of the publications once they merged in the VISSOFT conferences (2013-2016) seems more influenced by SOFTVIS.
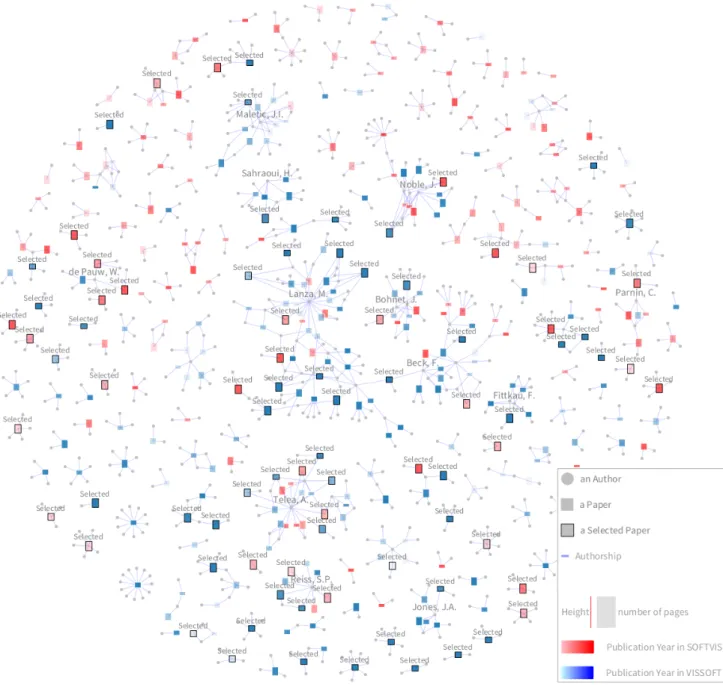
Figure 4 shows a visualization of the universe of 368 papers published in SOFTVIS/VISSOFT26. In this visualization, rectangles represent papers, their height encodes the number of pages (a 5-page paper is depicted by a square), and the color is used to identify its venue (VISSOFT in blue, and SOFTVIS in red). We used the intensity of the color to represent the publication year, thus the darker the color the newer the paper. Edges connect authors (gray circles) to papers (rectangles). Paper and author nodes are distributed using a force-directed layout. The 86 selected design study papers are distinguished by a black border and a label on top. In the visualization the topology of the community is exposed. A few large groups of collaborators that agglomerate many publications (for which we labeled a main contributor) contrast with the large number of groups that have few of them. We identify two main groups: (1) a cohesive one where we labeled the author“Telea, A.”, and (2) another less cohesive but larger one, where we labeled the author“Lanza, M.”. Although the graph does not show the usual topology of a community (due the lack of collaboration), we notice that in VISSOFT’16 both main groups collaborated in a recent publication27. The visualization facilitates the observation that in small groups only one color predominates, thus their publications are not intermingled between SOFTVIS and VISSOFT. Moreover, we observe that the selected papers are scattered among groups of different size, venues and years of publication. An interactive version of this visualization is available1.
FIGURE 2 Classification of the 295 SOFTVIS/VISSOFT papers by type.
2.3
Data Extraction
Table 1 presents the attributes that we extracted from each paper:1) task;2) need;3) audience;4) data source;5) representation;6) medium; and
7) tool.
TABLE 1 Data extracted from papers. Attribute Description
Task whythe visualization is needed (e.g., testing) Need whichquestions motivated the visualization Audience whowill use the visualization (e.g., analyst) Data source whatsource of data is visualized (e.g., source code)
Representation whattechnique is used to represent the data (e.g., pixel-oriented) Medium whereto render the visualization (e.g., wall-disp.)
Tool whichtool is used for evaluation (e.g., lviz)
We scanned the papers and identified recurrent sections that are likely to contain the data we sought. In our experience, attributes such as task, need, audience and data source are frequently described in the evaluation section, while the representation, medium and tool are typically found in another section dedicated to describe the architectural decisions and implementation of the prototype. Consequently, we extracted the task by identifying frequent terms used to describe development concerns such as programming, testing, debugging, maintenance, reverse-engineering. For the need we looked for questions that are used to specify what can be answered with the visualization. When there were no explicit questions,
FIGURE 3 Evolution of SOFTVIS/VISSOFT papers by type. From the bottom upwards: Design Study, Evaluation, Model, System, and Technique.
we extracted the goal that motivated the need for a proposed visualization. The audience was detected by identifying roles that users play in devel-opment such as programmer, engineer, tester. We extracted the data source by identifying the origin of the software artifacts that are visualized, such as source code and running system. For the representation we reflected on the description of visualization techniques, analyzed figures, and looked for their description. We extracted the medium by recognizing in the description the technology required to display the visualization such as wall display, standard monitor. We also extracted attributes of tools from the description of the artifact used in the evaluation such as tool name, and availability. When we were not able to identify an attribute, we searched for common terms already found in other studies. When we still did not find a description, we reported it asnot identified.
We validated the quality of the extracted data by asking the authors of the included studies to review the data of their papers. In particular, for each study we prepared a message that includes the extracted data and classification. We sent the message to the main author of each study, and when their address was not longer valid or we did not receive an answer after some weeks, we sent the message to co-authors. In the few cases that the same person was the main author of several studies, we only sent the message to the co-authors to balance the workload. Unfortunately, we could not contact the authors of 10 studies as their reported e-mail addresses were no longer valid (dash-marked in Tables 2 and 3 ). Among the 76 remaining studies, 43 of them (i.e., 57%) contributed to our survey (check-marked in Tables 2 and 3 ). Eight studies (S1, S3, S19, S30, S55, S62, S67, S68) completely agreed with our classification (we appreciate the rigorous feedback from S30, S55, S67, and S68, which effectively improved this work); nine studies (S5, S17, S31, S37, S46, S47, S48, S57, S81) agreed with the extracted data and also provided further informatione.g., specified a category for the data that we classified asnot identified; and twenty-six studies (S2, S6, S9, S10, S11, S14, S16, S20, S23, S24, S25, S27, S33, S41, S42, S43, S44, S45, S50, S59, S61, S70, S71, S73, S75, S77) partially agreed and reclassified some attributes. We observe that the classification of therepresentationused in studies is the greatest source of disagreement. Most authors were not aware of the proposed classification, and preferred to specify a category such asgraph,tree,glyph.
FIGURE 4Overview of the complete publication record of SOFTVIS/VISSOFT. The 86 selected papers (out of 368) correspond to design studies.
3
RESULTS
In this section we describe various characteristics of the 86 papers. A complete set of extracted data in our study is available online1.
3.1
Task
Table 4 shows the classification of the papers based on the type of tasks7they tackled. Figure 5 shows the distribution of the types of tasks pre-sented in each edition of the venues. We sorted the venues chronologically starting by SOFTVIS editions followed by VISSOFT ones. We think it provides a better understanding of their various contribution. We observe that even though we selected papers from all editions of SOFTVIS and VISSOFT, we included only few papers from the first editions of VISSOFT. This can be a consequence of the lower percentage of design study papers in VISSOFT than in SOFTVIS (see Figure 1 ). We also detected that papers tackling testing appear for the first time only in the two last editions of
TABLE 2 The included papers in the study [S1-S50] (the ones reviewed by their authors have a check mark).
Id Reference Year Rev.
[S1] Merge-tree: Visualizing the integration of commits into Linux,Wild, E. et al. 2016 X
[S2] Visualizing Project Evolution Through Abstract Syntax Tree Analysis,Feist, M.D. et al. 2016 X
[S3] Visually Exploring Object Mutation,Schulz, R. et al. 2016 X
[S4] Jsvee & Kelmu: Creating and Tailoring Program Animations for Computing Education,Sirkiae, T. 2016
[S5] Towards Visualization of Feature Interactions in Software Product Lines,Illescas, S. et al. 2016 X
[S6] Perquimans: A Tool for Visualizing Patterns of Spreadsheet Function Combinations,Middleton, J. et al. 2016 X
[S7] Metrics visualization technique based on the origins and function layers for OSS-based development,Ishizue, R. et al. 2016
[S8] DAHLIA 2.0: A Visual Analyzer of Database Usage in Dynamic and Heterogeneous Systems,Meurice, L. et al. 2016
[S9] A Visualization Framework for Parallelization,Wilhelm, A. et al. 2016 X
[S10] An Interactive Microarray Call-Graph Visualization,Shah, M.D. et al. 2016 X
[S11] On using Tree Visualisation Techniques to support Source Code comprehension,Bacher, I. et al. 2016 X
[S12] Visualizing Modules and Dependencies of OSGi-based Applications,Seider, D. et al. 2016
[S13] vizSlice: Visualizing Large Scale Software Slices,Alomari, H. et al. 2016
[S14] Visualization Tool for 3D Graphics Program Comprehension and Debugging,Podila, S. et al. 2016 X
[S15] CuboidMatrix: Exploring Dynamic Structural Connections in Software Components.,Schneider, T. et al. 2016
[S16] Walls, Pillars and Beams: A 3D Decomposition of Quality Anomalies,Tymchuk, T. et al. 2016 X
[S17] Critical Section Investigator: Building Story Visualizations with Program Traces,Shah, M.D. et al. 2016 X
[S18] Visualizing the Evolution of Working Sets,Minelli, R. et al. 2016
[S19] MetaVis: Exploring Actionable Visualization,Merino, L. et al. 2016 X
[S20] Kayrebt: An Activity Diagram Extraction and Visualization Toolset Designed for the Linux Codebase,Georget, L. et al. 2015 X
[S21] XVIZIT: Visualizing Cognitive Units in Spreadsheets,Hodnigg, K. et al. 2015
[S22] Vestige: A Visualization Framework for Engineering Geometry-Related Software,Schneider, T. et al. 2015
[S23] Hierarchical Software Landscape Visualization for System Comprehension: A Controlled Experiment,Fittkau, F. et al. 2015 X
[S24] Interactive Tag Cloud Visualization of Software Version Control Repositories,Greene, G.J. et al. 2015 X
[S25] Blended, Not Stirred: Multi-concern Visualization of Large Software Systems,Dal Sasso, T. et al. 2015 X
[S26] Pixel-Oriented Techniques for Visualizing Next-Generation HPC Systems,Cottam, J. et al. 2015
[S27] SMNLV: A Small-Multiples Node-Link Visualization Supporting Software Comprehension,Abuthawabeh, A. et al. 2015 X
[S28] Live Visualization of GUI Application Code Coverage with GUITracer,Molnar, A.J. 2015
[S29] Advancing Data Race Investigation and Classification through Visualization,Koutsopoulos, N. et al. 2015 —
[S30] Visual Clone Analysis with SolidSDD,Voinea, L. et al. 2014 X
[S31] Polyptychon: A Hierarchically-Constrained Classified Dependencies Visualization,Daniel, D.T. et al. 2014 X
[S32] ChronoTwigger: A Visual Analytics Tool for Understanding Source and Test Co-evolution,Ens, B. et al. 2014
[S33] Visualizing the Evolution of Systems and Their Library Dependencies,Kula, R.G. et al. 2014 X
[S34] The visualizations of code bubbles,Reiss, S.P. et al. 2013 —
[S35] Visualizing software dynamicities with heat maps ,Benomar, O. et al. 2013
[S36] DEVis: A tool for visualizing software document evolution,Junji Zhi et al. 2013 —
[S37] SourceVis: Collaborative software visualization for co-located environments ,Anslow, C. et al. 2013 X
[S38] SYNCTRACE: Visual thread-interplay analysis,Karran, B. et al. 2013 —
[S39] Automatic categorization and visualization of lock behavior,Reiss, S.P. et al. 2013
[S40] Chronos: Visualizing slices of source-code history,Servant, F. et al. 2013
[S41] Visual support for porting large code bases,Broeksema, B. et al. 2011 X
[S42] Visualising concurrent programs with dynamic dependence graphs,Lonnberg, J. et al. 2011 X
[S43] Visual exploration of program structure, dependencies and metrics with SolidSX,Reniers, D. et al. 2011 X
[S44] MosaiCode: Visualizing large scale software: A tool demonstration ,Maletic, J.I. et al. 2011 X
[S45] An interactive ambient visualization for code smells,Murphy-Hill, E. et al. 2010 X
[S46] Exploring the inventor’s paradox: applying jigsaw to software visualization,Ruan, H. et al. 2010 X
[S47] Towards anomaly comprehension: using structural compression to navigate profiling call-trees,Lin, S. et al. 2010 X
[S48] Heapviz: interactive heap visualization for program understanding and debugging,Aftandilian, E.E. et al. 2010 X
[S49] Trevis: a context tree visualization analysis framework.,Adamoli, A. et al. 2010
[S50] Dependence cluster visualization,Islam, S.S. et al. 2010 X
SOFTVIS and then reappear in VISSOFT’14. Although most of the reviewed studies tackled programming tasks (as shown in Table 4 ) they concen-trate on SOFTVIS’03 and VISSOFT’15-’16, showing little presence in the rest of the editions. We reflect that the result provides a good overview of the degree of attention that each development concern has had, but since many different visualization techniques are proposed within each type, it provides little help to practitioners to find a suitable visualization for their specific needs. The authors of just two studies considered multiple categories to classify the task ([S43],[S61]). The authors of three other studies proposed to include software comprehension as a category ([S67],
[S27],[S68]). The authors of one study — although disagreeing with our classification (programming) — proposed system design and architecture as subcategories.
3.2
Need
In Table 8 and 9 we present the developer needs that we identified from studies. Although some studies tackle more than one need we report the most representative one (the complete set of needs is available online1). On the one hand, we found that 90% of studies (i.e., 77) describe envisioned user needs by explicitly posing questions that can be answered using the proposed visualization, such as“what is the software doing when performance issues arise?” [S69],“what does this called method do?” [S76]. On the other hand, in 10% of studies (i.e., 9) there was no explicit question formulation. In such cases, we identified the goals that the proposed visualization achieve, examples of them being“to assist designers of scheduling-based, multi-threaded, out-of-core algorithms” [S59],“to get a better insight into the control or data flow inside a program” [S20]. Although questions allow users to assess whether a visualization is useful, we observe that uncategorized questions hinder the reuse of visualization. We tackle this issue with a classification of needs based on problem domains. A detailed analysis is provided in Section 4.
TABLE 3 The included papers in the study [S51-S86] (the ones reviewed by their authors have a check mark).
Id Reference Year Rev.
[S51] Embedding spatial software visualization in the IDE: an exploratory study,Kuhn, A. et al. 2010
[S52] Visualizing windows system traces,Wu, Y. et al. 2010 —
[S53] Zinsight: a visual and analytic environment for exploring large event traces,de Pauw, W. et al. 2010
[S54] Representing development history in software cities,Steinbrückner, F. et al. 2010
[S55] Case study: Visual analytics in software product assessments,Telea, A. et al. 2009 X
[S56] Representing unit test data for large scale software development,Cottam, J.A. et al. 2008
[S57] A catalogue of lightweight visualizations to support code smell inspection,Parnin, C. et al. 2008 X
[S58] Streamsight: a visualization tool for large-scale streaming applications,de Pauw, W. et al. 2008
[S59] Stacked-widget visualization of scheduling-based algorithms,Bernardin, T. et al. 2008 X
[S60] “A Bug’s Life” Visualizing a Bug Database,D’Ambros, M. et al. 2007
[S61] Visualizing Dynamic Memory Allocations,Moreta, S. et al. 2007 X
[S62] A Visualization for Software Project Awareness and Evolution ,Ripley, R.M. et al. 2007 X
[S63] Experimental evaluation of animated-verifying object viewers for Java,Jain, J. et al. 2006 —
[S64] Execution patterns for visualizing web services,de Pauw, W. et al. 2006
[S65] Visualizing live software systems in 3D,Greevy, O. et al. 2006
[S66] Visual exploration of function call graphs for feature location in complex software systems,Bohnet, J. et al. 2006
[S67] Multiscale and multivariate visualizations of software evolution,Voinea, L. et al. 2006 X
[S68] CVSscan: visualization of code evolution,Voinea, L. et al. 2005 X
[S69] Jove: Java as it happens,Reiss, S.P. et al. 2005
[S70] Methodology and architecture of JIVE,Gestwicki, P. et al. 2005 X
[S71] Visual Exploration of Combined Architectural and Metric Information,Termeer, M. et al. 2005 X
[S72] Visual data mining in software archives,Burch, M. et al. 2005
[S73] The war room command console: shared visualizations for inclusive team coordination,O’Reilly, C. et al. 2005 X
[S74] Visualizing structural properties of irregular parallel computations,Blochinger, W. et al. 2005
[S75] Visualization of mobile object environments,Frishman, Y. et al. 2005 X
[S76] Towards understanding programs through wear-based filtering,DeLine, R. et al. 2005
[S77] Program animation based on the roles of variables,Sajaniemi, J. et al. 2003 X
[S78] Visualizing Java in action,Reiss, S.P. 2003
[S79] EVolve: an open extensible software visualization framework,Wang, Q. et al. 2003 —
[S80] Visualization of program-execution data for deployed software,Orso, A. et al. 2003
[S81] A system for graph-based visualization of the evolution of software,Collberg, C. et al. 2003 X
[S82] Interactive locality optimization on NUMA architectures,Mu, T. et al. 2003 —
[S83] Graph visualization for the analysis of the structure and dynamics of extreme-scale supercomputers,Zhou, C. et al. 2003 —
[S84] KScope: A Modularized Tool for 3D Visualization of Object-Oriented Programs,Davis, T.A. et al. 2003
[S85] Self-Organizing Maps Applied in Visualising Large Software Collections,Brittle, J. et al. 2003 —
[S86] Revision Towers,Taylor, C.M.B. et al. 2002
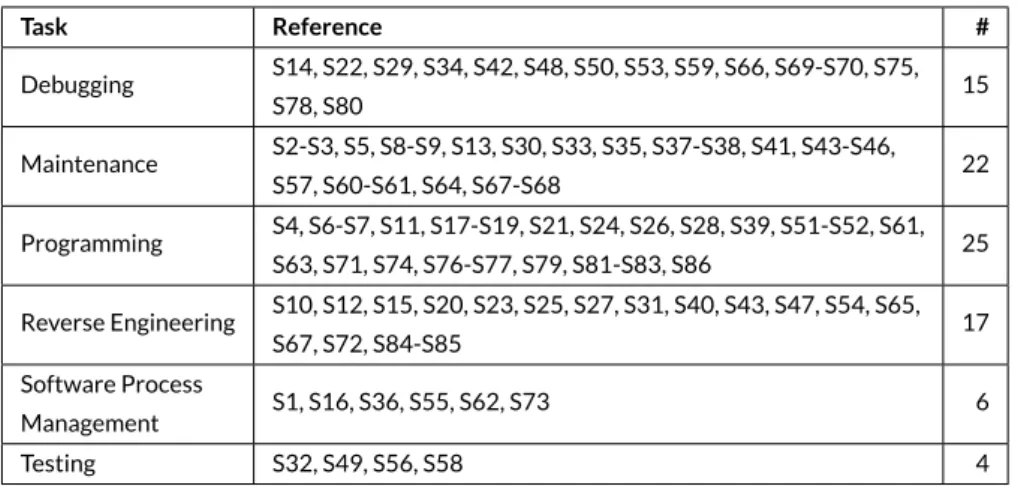
TABLE 4 Classification of papers based on the tasks.
Task Reference # Debugging S14, S22, S29, S34, S42, S48, S50, S53, S59, S66, S69-S70, S75, S78, S80 15 Maintenance S2-S3, S5, S8-S9, S13, S30, S33, S35, S37-S38, S41, S43-S46, S57, S60-S61, S64, S67-S68 22 Programming S4, S6-S7, S11, S17-S19, S21, S24, S26, S28, S39, S51-S52, S61, S63, S71, S74, S76-S77, S79, S81-S83, S86 25 Reverse Engineering S10, S12, S15, S20, S23, S25, S27, S31, S40, S43, S47, S54, S65, S67, S72, S84-S85 17 Software Process Management S1, S16, S36, S55, S62, S73 6 Testing S32, S49, S56, S58 4
3.3
Audience
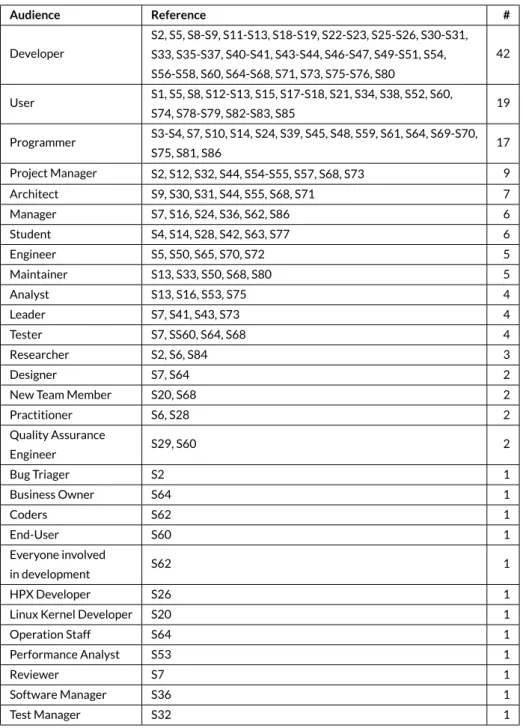
Software developers play specific roles such asinteraction designer,solution architect,GUI designer,requirements analyst,release coordinator. In con-trast, as shown in Table 5 , 85% of the studies (i.e., 73) envisioned a generic audience described asdeveloper(42),user(19),programmer(17) and
engineer(5). In the remaining studies the role of the user was more specific such asproject manager(9),architect(7),maintainer(5),tester(4), or
designer(2). Less frequent roles werebug triager,HPX developer,operation staff,performance analyst,quality assurance engineer, andreviewer. Some studies envisioned roles of users from other fields such asbusiness ownerandstudent. One study envisioned managers as well as developers pursu-ing the same questions“(1) when were the changes made? (2) what kind of changes have been made? and (3) how does visit / download time vary over time?” [S36]. Another study envisioned that their tool would be suitable for“everyone involved in software development” [S62]. We observed that a better understanding of the scope of the role that an audience plays would (1) help researchers to propose solutions focused on the particular problems that roles cope with and (2) facilitate adoption of visualization by practitioners.
3.4
Data source
FIGURE 5 Distribution of papers by task in each venue. Bottom-up: Debugging, Programming, Reverse Engineering, Maintenance, Software Process Management and Testing.
1. Running systemsfrom which studies visualized traces of execution, metrics (e.g., CPU usage) and user interactions. Some studies visual-ized events among applications to analyze operating systems and distributed architectures. A few studies visualvisual-ized memory accesses and behavior of live objects.
2. Source codethat provided the input to build models of systems for the visualization of dependencies, metrics, structure and inheritance. A few studies visualized annotations used to define features, the scope of variables and program slices. We found that the most frequent language supported was Java, followed by C/C++, which was supported by half of the studies. Other languages with little support include Smalltalk and Pascal.
3. Version control systemsfrom which studies visualized meta-data from the commit (e.g., author, date, message), and less frequently changes of code (e.g., added and removed files).
Less frequently we found non-traditional sources such asspreadsheets,bug tracking systems(e.g., Bugzilla),build automation tools(e.g., Maven),
databasesanddocumentation.
We observe that visualizations have focused on sources of complex data that are difficult to analyze by other means, but this also shows that sources of complex data are not limited to the traditional ones. We also noticed that studies focus mainly on describing how they modeled data rather than specifying the source and type of data. We observe that detailed descriptions of data that include not only the source but the format as well as other characteristics can facilitate developers to adopt visualizations. For instance, users who are aware of a technique for visualizing a stack trace gathered from a running system can decide whether their context is similar enough to adopt the visualization.
TABLE 5 Classification of papers based on the audience. Audience Reference # Developer S2, S5, S8-S9, S11-S13, S18-S19, S22-S23, S25-S26, S30-S31, S33, S35-S37, S40-S41, S43-S44, S46-S47, S49-S51, S54, S56-S58, S60, S64-S68, S71, S73, S75-S76, S80 42 User S1, S5, S8, S12-S13, S15, S17-S18, S21, S34, S38, S52, S60, S74, S78-S79, S82-S83, S85 19 Programmer S3-S4, S7, S10, S14, S24, S39, S45, S48, S59, S61, S64, S69-S70, S75, S81, S86 17 Project Manager S2, S12, S32, S44, S54-S55, S57, S68, S73 9 Architect S9, S30, S31, S44, S55, S68, S71 7 Manager S7, S16, S24, S36, S62, S86 6 Student S4, S14, S28, S42, S63, S77 6 Engineer S5, S50, S65, S70, S72 5 Maintainer S13, S33, S50, S68, S80 5 Analyst S13, S16, S53, S75 4 Leader S7, S41, S43, S73 4 Tester S7, SS60, S64, S68 4 Researcher S2, S6, S84 3 Designer S7, S64 2
New Team Member S20, S68 2
Practitioner S6, S28 2 Quality Assurance Engineer S29, S60 2 Bug Triager S2 1 Business Owner S64 1 Coders S62 1 End-User S60 1 Everyone involved in development S62 1 HPX Developer S26 1
Linux Kernel Developer S20 1
Operation Staff S64 1 Performance Analyst S53 1 Reviewer S7 1 Software Manager S36 1 Test Manager S32 1
3.5
Representation
Describing the representation used in a visualization is a complex task. Authors proposing a visualization use various strategies to describe the applied techniques. Some used verbose descriptions[S62, S65]by specifying dimensions, metaphors, marks, and properties of them. Others[S68, S71]opted for concise but sometimes vague descriptions. We classify the visualization techniques used in the studies according to the popular taxonomy proposed by Keim28. This taxonomy provides a concise list of categories upon which abundant research has relied. In it, visualization techniques can belong to one of four categories (examples are shown in Figure 6 ):1)Stackedtechniques that are tailored to present data in a hier-archical fashion (e.g., Treemaps and Cone Trees);2)Iconictechniques that map the data attributes to the features of an icon (e.g., CocoViz[S46]);
3)Geometrically-Transformedtechniques that aim at finding interesting transformations of data attributes (e.g., Scatter-plots and Parallel Coordi-nates);4)Dense Pixeltechniques that map each data attribute to a colored pixel and group the pixels belonging to each attribute into adjacent areas (e.g., Vampir[S7]) ; and5)Standard 2D/3Dtechniques such as Bar Charts, X-Y Plots;
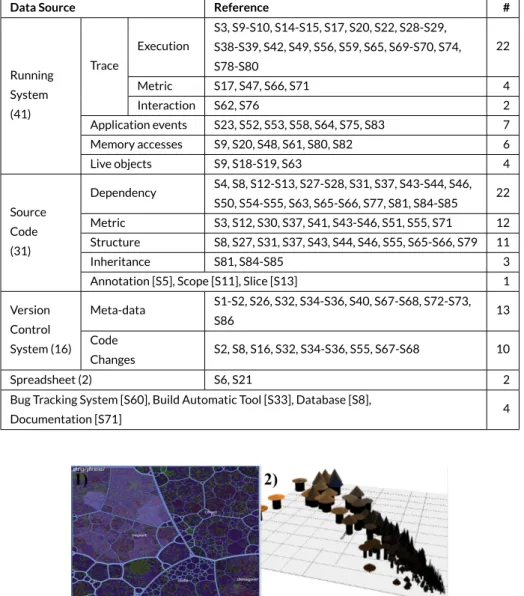
TABLE 6 Classification of papers based on the data source.
Data Source Reference #
Running System (41) Trace Execution S3, S9-S10, S14-S15, S17, S20, S22, S28-S29, S38-S39, S42, S49, S56, S59, S65, S69-S70, S74, S78-S80 22 Metric S17, S47, S66, S71 4 Interaction S62, S76 2 Application events S23, S52, S53, S58, S64, S75, S83 7 Memory accesses S9, S20, S48, S61, S80, S82 6 Live objects S9, S18-S19, S63 4 Source Code (31) Dependency S4, S8, S12-S13, S27-S28, S31, S37, S43-S44, S46, S50, S54-S55, S63, S65-S66, S77, S81, S84-S85 22 Metric S3, S12, S30, S37, S41, S43-S46, S51, S55, S71 12 Structure S8, S27, S31, S37, S43, S44, S46, S55, S65-S66, S79 11 Inheritance S81, S84-S85 3
Annotation [S5], Scope [S11], Slice [S13] 1
Version Control System (16) Meta-data S1-S2, S26, S32, S34-S36, S40, S67-S68, S72-S73, S86 13 Code Changes S2, S8, S16, S32, S34-S36, S55, S67-S68 10 Spreadsheet (2) S6, S21 2
Bug Tracking System [S60], Build Automatic Tool [S33], Database [S8],
Documentation [S71] 4
FIGURE 6 Examples of visualizations for each type 1) Stacked, 2) Iconic, 3) Geometrically-Transformed, and 4) Dense Pixel.
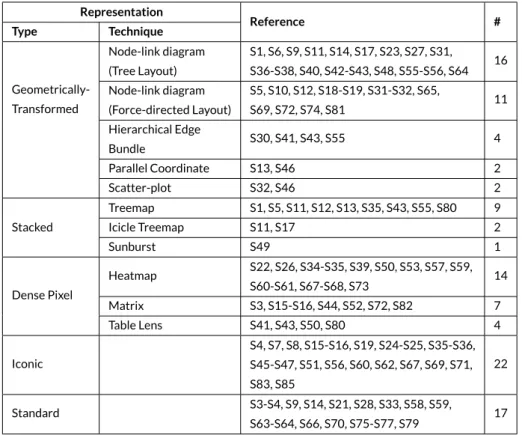
Table 7 presents these categories. We note that approximately half of the studies (i.e., 44) combine techniques from several categories. The most frequent combination occurred between Treemaps and Node-link diagrams (Stacked and Geometrically-Transformed). Combinations of other types of techniques occurred with less frequency (less than four studies). Frequent types are Geometrically-Transformed (GT), Dense Pixel (DP) and Stacked (ST). We observe that GT is frequent since node-link techniques, that belong to this category, are commonly used by visualizations that explore relationships. The DP type contains techniques suitable for depicting massive data sets such as Heatmap. ST also includes popular techniques for hierarchical data such as Treemap.
TABLE 7 Classification of papers based on the representation. Representation Reference # Type Technique Geometrically-Transformed Node-link diagram (Tree Layout) S1, S6, S9, S11, S14, S17, S23, S27, S31, S36-S38, S40, S42-S43, S48, S55-S56, S64 16 Node-link diagram (Force-directed Layout) S5, S10, S12, S18-S19, S31-S32, S65, S69, S72, S74, S81 11 Hierarchical Edge Bundle S30, S41, S43, S55 4 Parallel Coordinate S13, S46 2 Scatter-plot S32, S46 2 Stacked Treemap S1, S5, S11, S12, S13, S35, S43, S55, S80 9 Icicle Treemap S11, S17 2 Sunburst S49 1 Dense Pixel Heatmap S22, S26, S34-S35, S39, S50, S53, S57, S59, S60-S61, S67-S68, S73 14 Matrix S3, S15-S16, S44, S52, S72, S82 7 Table Lens S41, S43, S50, S80 4 Iconic S4, S7, S8, S15-S16, S19, S24-S25, S35-S36, S45-S47, S51, S56, S60, S62, S67, S69, S71, S83, S85 22 Standard S3-S4, S9, S14, S21, S28, S33, S58, S59, S63-S64, S66, S70, S75-S77, S79 17
3.6
Tool
Tables 8 and 9 summarize the tools collected from the papers. Normally, they are developed as prototypes to evaluate a proposed visualization. All studies, among the 77 that explicitly identified a tool (i.e., 90%), introduced a new visualization tool. Notice that the tool namedJivethat was used in two studies[S70, S78]corresponds to a different tool. A few (i.e., 26%) made their tool and source code publicly available. As one can expect, few prototypes were maintained and extended over time. The most notable cases areJive [S70], and two tools used for teaching programming:jGrasp [S63]andPlanAni [S77]. If we consider tools for which current information is available, their average lifespan is 3.7 years2. We acknowledge that this value represents only a lower bound, since it does not consider possible earlier presentations of the tools. Various studies often used different visualization frameworks. The most frequent ones areOpenGL(11) used over multiple years, andD3.js(9) andRoassal(6) used only recently. Also, three studies usedJava3Din more than a decade ago.GraphVizwas used in four studies. The rest of the studies use multiple frameworks, and in twenty-three there is no explicit information about any frameworks used.
3.7
Medium
In our previous work20, we included the medium as one of the dimensions of the proposed software visualization taxonomy. Although the authors of a previous taxonomy7envisioned a future where software visualizations would use a variety of media (e.g., head-mounted displays29), Table 10 shows that only few studies that we found exploited this dimension (and that we analyzed in detail in a recent experiment30). Almost 56% of the reviewed studies do not mention the expected medium on which the visualization should be displayed (labeled as not identified). Among the 44% that explicitly mentioned a medium the majority (i.e., 87%) specified the standard PC display. However, there were other studies that indicated diverse media, from a small window in a standard monitor to a wall-display, large multi-touch tables, tablets, 3D glasses, and an immersive 3D environment.
TABLE 8 Visualization tools and needs extracted from papers [S1-S50].
Ref. Tool Year Framework Questions and Goals that Motivate Visualization
[S1] Linvis 2016 Python, Flask How and by whom commits arrive and merge into the Linux repository?
[S2] TypeV 2016 JavaScript, TypeScript, D3.js What is a developer’s contribution to a repository?
[S3] Object EvolutionBlueprint 2016 Smalltalk, Roassal How the value of variables change during the execution of a program?
[S4] Jsvee 2016 JavaScript How program code behaves when it is executed?
[S5] ECCO 2016 JavaScript, D3.js How features are implemented and interact?
[S6] Perquimans 2016 JavaScript, D3.js How are spreadsheet users building formulae?
[S7] MAF and OC 2016 JavaScript, HTML5 To show the origins and function layers in development
[S8] DAHLIA 2016 Not identified How the database elements are mapped in the Java code?
[S9] Parceive 2016 JavaScript, D3.js To assist users in identifying scenarios that benefit from parallelization
[S10] Not identified 2016 Java, Processing How execution time is spent in the program?
[S11] Not identified 2016 JavaScript, D3.js, ace.js,esprima.js, estraverse.js,
escope.js What is the static structure of a source code document?
[S12] Not identified 2016 JavaScript, D3.js To analyze software structure and dependencies
[S13] vizSlice 2016 JavaScript, D3.js What parts of the software can be affected by a change?
[S14] Not identified 2016 JavaScript, D3.js Is the data transferred correctly from CPU to GPU?
[S15] CuboidMatrix 2016 Smalltalk, Pharo, Roassal How code critiques are distributed in the software?
[S16] A Roassal 3Dvisualization 2016 Smalltalk, Pharo, Roassal3D What are quality evolution anomalies and what caused them?
[S17] CSI 2016 Java, Processing How call trees behave for critical sections in a Java program?
[S18] Not identified 2016 Smalltalk, Pharo, Roassal How developers navigate and interact with code during development?
[S19] MetaVis 2016 Smalltalk, Pharo, Roassal What visualizations are suitable to answer development questions?
[S20] Kayrebt 2015 C, C++, GraphViz, Qt What is actually compiled by the compiler?
[S21] XVIZIT 2015 Java FX, Control FX,GraphStream What would be affected if I were to change a cell?
[S22] Vestige 2015 C++ OpenGL How the computation reached that result?
[S23] ExploreViz 2015 JavaScript, tree.js What are the consequences of a failure in a certain application?
[S24] ConceptCloud 2015 Play web framework How often and by whom certain files have changed together?
[S25] Blended City 2015 Smalltalk, Pharo, Roassal What happened to a software system in a given time frame?
[S26] Vampir 2015 Not identified How different are work queues on different threads?
[S27] SMNLV 2015 Java 8, Graphisto Toolkit,abego TreeLayout,
NetBeans Visual Library To check guidelines and re-engineering of existing software,
[S28] GUITracer 2015 Java 6 using AWT, Swing What source code runs once a GUI event is fired?
[S29] RaceView 2015 C, Eclipse Visualization Zest How a specific code location can be reached via function calls?
[S30] SolidSDD 2014 C, C++ , OpenGL How are clones distributed across system structure?
[S31] Polyptychon 2014 JavaScript, D3.js Are there any patterns in the dependency structure?
[S32] ChronoTwigger 2014 OpenGL, GLUT, VR Juggler How source and test files develop together over time?
[S33] Not identified 2014 R, GGPlot2 When should I update my library dependencies
[S34] Code Bubbles 2013 Not identified How are Java programs based on working sets developed?
[S35] VERSO 2013 Not identified How programmers behave during the evolution of a program?
[S36] DEVis 2013 Java, G4P When and what kind of changes have been made?
[S37] SourceVis 2013 Java, MT4j, OpenCloud,JFreeChart What is the structure and properties of software?
[S38] SYNCTRACE 2013 Not identified Where and when a thread waits or releases?
[S39] Not identified 2013 Not identified Which locks interact with one another and how complex is it?
[S40] Chronos 2013 Java When, how, by whom, and why was this code changed or inserted?
[S41] PortAssist 2011 C++, Qt, OpenGL Which rewrite activities conflict with each other?
[S42] Atropos 2011 Java, Apache Commons BCEL,Matrix software visualisation
framework How do operations executed in a Java program relate to each other?
[S43] SolidSX 2011 OpenGL, GLUT, FTGL,wxWidgets How metrics correlate with the dependencies in the system?
[S44] MosaiCode 2011 C++, Qt How metrics have changed? Where are run time bottlenecks?
[S45] Stench Blossom 2010 Java, Eclipse What code smells are present in the code I am working with?
[S46] Jigsaw 2010 Not identified What entities are likely to depend on this package?
[S47] ProfVis 2010 Java, HProf, Processing What parts of the program could be modified to improve performance?
[S48] Heapviz 2010 Prefuse toolkit What is the shape of the data structures, and how are they connected?
[S49] Trevis 2010 Trevis, GraphViz To study the calling contexts where the program spent most time
[S50] Decluvi 2010 Java What is the dependence structures/clusters in your program?
4
DISCUSSION
In this section we discuss our findings, and we provide recommendations to practitioners and researchers, respectively, for adopting visualizations, and for identifying domains that require more attention.
A majority of studies do not follow a specific structure for describing their proposed techniques. We believe that following a specific structure encourages researchers to reflect on important dimensions that should drive the design of a visualization tool7,9. Moreover, we believe that provid-ing a clear description of a research problem, and formulatprovid-ing explicit research questions ease tool adoption by practitioners. For instance, instead of a fuzzy description like “provides an analysis of Java programs”[84]which does not reflect an exact goal, we suggest a reformulation to “analyze class dependency for validation of experimental software visualization techniques.”
In section 3.1 we classified the papers into six high-level software development tasks (shown in Table 4 ). We note that a different visualization is proposed to tackle developer needs that are classified in the same task. Hence, we argued that such a classification does not provide an appropriate support for practitioners to find and adopt a suitable visualization for their specific needs. We observe that practitioners require a more fine-grained classification that links existing visualization techniques to their concrete needs.
We observe that researchers who focused on the questions that developers ask during software development have classified the type of ques-tions using diverse criteria. We rely on that research to (1) identify the used categories to classify the design study papers and (2) evaluate how important are those categories based on the number of different type of questions and their frequency.
We classify the studies into (1)subject-oriented19, (2)process-oriented17, and (3)problem-oriented31. We believe mapping such classifications of developer needs to the visualization techniques proposed by studies provides a better support for practitioners to adopt a visualization in their daily tasks and allows us to analyze how well a proposed visualization supports developers to answer questions that actually arise during development.
TABLE 9 Visualization tools and needs extracted from papers [S51-S86].
Ref. Tool Year Framework Questions and Goals that Motivate Visualization
[S51] CodeMap 2010 Not identified What is the purpose of the application? Who are the collaborators?
[S52] lviz 2010 OpenJDK 1.6.0 How the operating system works?
[S53] Zinsight 2010 Not identified How did we get to these events?
[S54] CrocoCosmos 2010 jMonkeyEngine How the component content changes over time?
[S55] Not identified 2009 Not identified How metrics evolve in time over the entire software system?
[S56] SeeTest 2008 Stencil visualizationenvironment How did the changes from yesterday affect project’s stability?
[S57] NosePrints 2008 Not identified How widespread and how difficult a problem may be to fix?
[S58] Streamsight 2008 dot How the system and applications evolve?
[S59] Lumiere 2008 OpenGL, C++ How are concurrent tasks scheduled by the algorithm?
[S60] Bug Watch 2007 Not identified How the bugs are distributed in the system over time?
[S61] MemoView 2007 C++, OpenGL, FLTK How does fragmentation depend on time and pool?
[S62] Palantír 2007 Java When was the artifact changed?
[S63] jGrasp 2006 Not identified To understand concepts of dynamic programming implementation
[S64] IBM Web ServicesNavigator tool 2006 Not identified How different IT resources interact sequentially with one another?
[S65] TraceCrawler 2006 CCJun How the system behaved during the execution of a feature?
[S66] Call Graph Analyzer 2006 GraphViz Which the important functions for feature understanding are?
[S67] CVSgrab 2006 Python, wxWidgets,OpenGL, C How metrics correlate during evolution of a given set of items?
[S68] CVSscan 2005 Python, wxWidgets,OpenGL, C What code lines were added, removed, or altered, when and by whom?
[S69] Jove 2005 Not identified What the software is doing when performance issues arise?
[S70] Jive 2005 Not identified What is the runtime object structure of a Java program?
[S71] MetricView 2005 C++, OpenGL, FreeType,wxWindows Where are components having certain properties?
[S72] EPOSee 2005 Not identified What items have been changed at the same time?
[S73] War Room CommandConsole 2005 Java, C++ Who is currently working on what?
[S74] DOT 2005 Java, yFiles library What are optimal parameters to distribute the work on the processors?
[S75] Mobile ObjectVisualization 2005 Java, Java3D, GraphViz How does the architecture supports object mobility behavior over time?
[S76] FAN 2005 Not identified Which method in the source code implements certain behavior?
[S77] PlanAni 2003 Tcl/Tk How the successive values of the variable relate to each other and toother variables?
[S78] Jive 2003 Not identified What threads are in the program?
[S79] EVolve 2003 Not identified When and for how long particular events occur?
[S80] Gamma/Gammatella 2003 Java, Swing,TreeMap Java Library How often the statement is executed?
[S81] GEVOL 2003 Not identified How and by whom the parts of the program were created?
[S82] Not identified 2003 Not identified How much of the data is dominantly accessed by the local nodes?
[S83] Flatland 2003 OpenGL To analyze massively parallel supercomputer architectures
[S84] Kscope 2003 Java3D To provide an analysis of Java programs
[S85] GENISOM 2003 Java3D To aid programmers in the process of reverse engineering
[S86] Revision Towers 2002 Not identified How often, and how, changes are made?
TABLE 10 Classification of papers based on the medium.
Medium Reference # Not Identified S1-S3, S5, S7-S8, S12-S13, S15, S17-S18, S21-S22, S25-S26, S28-S29, S31, S34-S36, S38-S40, S46, S48-S49, S51-S56, S58, S60, S63-S64, S66, S69, S72, S74, S76, S78-S80, S82, S85-S86 48 Standard screen S4, S6, S9-S11, S14, S16, S19-S20, S23-S24, S27, S30 ,S41-S43, S45, S47, S50, S57, S59, S61-S62, S65, S67-S68, S70-S71, S75, S77, S81, S83-S84 33 Wall-display S27, S33, S57, S62, S73 5 3D glasses S71 1 Immersive 3D Environment S32 1 Multi-Touch Table S37 1 Multi-Monitor S44 1 Tablet S4 1
According to our investigation, these classifications offer an appropriate granularity to accommodate the questions from other studies too. Hence, we classified the 86 included papers by identifying categories in each classification that contain similar types of questions to the needs extracted from the papers (shown in Tables 8 and 9 ). In studies for which we extracted a goal instead of a question, we inferred the category from other types of questions that would help users to achieve that goal. In the following we present the classification of studies based on the classifications: subject, process and problem-oriented.
Subject-oriented.Fritzet al.19proposed a classification in which questions can belong to one of the following categories:people(e.g., who is working on what),code(e.g., changes to the code),progress(e.g., work item progress),build(e.g., broken builds),test(e.g., test case analysis),web(e.g., web related concerns), andotherquestions. The result of the classification of the studies is shown in Table 11 . We found that visualizations that we
classified as dealing withi)codeparticularly focused on subjects such as architecture, commits, critiques, features, memory management, threads, and working sets,ii)otherspanned subjects such as databases, event traces, failure reports, and visualization examples,iii)peoplesubjects addressed ownership,iv)testsubjects focused on GUI and compiler, andv)buildsubjects were related to compiler optimizations and build configurations.
TABLE 11Subject-oriented classification of studies.
Category References # Code S2, S5-S7, S11-S13, S21, S23-S25, S27-S37, S40-S41, S43-S46, S50-S51, S54-S57, S60, S62, S67-S68, S71-S72, S76, S81, S84-S86 45 Other S1, S3-S4, S8-S10, S14-S20, S22, S26, S38-S39, S42, S47-S49, S52-S53, S58-S59, S61, S63-S66, S69-S70, S73-S75, S77-S80, S82-S83 41 People S2, S6, S24, S34-S35, S40, S51, S54-S55, S68, S81, S86 12 Test S28, S32, S56, S57 4 Build S25 1 Progress - 0 Web - 0
Process-oriented.Introduced by Sillitoet al.17. This classification focuses on understanding the cognitive process of moving from questions to answers. Their classification of type of questions includes the following categories: i)findinginitial software entities that might lead developers to formulate a concrete question,ii)buildingon those points by identifying relationships between entities,iii)understandinga group of entities and relationships, andiv)questioninghow various groups relate each other. In Table 12 we present the results of the classification of studies. We observe that as the cognitive process increases in complexity (finding→building→understanding→questioning) the number of proposed visualization decreases.
TABLE 12Process-oriented classification of studies.
Category References # Finding S1-S86 86 Building S1-S2, S4-S18, S20-S26, S28-S61, S63-S66, S68-S71, S74-S81, S83-S86 78 Understanding S2, S4-S9, S12-S18, S20-S23, S25-S26, S28-S33, S38-S39, S42, S44-S47, S49-S53, S55-S57, S59, S63-S65, S68-S71, S76-S78, S81, S85-S86 55 Questioning S2, S8, S13-S17, S20-S21, S23, S28-S29, S32-S33, S39, S51, S53, S55-S56, S59, S65, S69, S76-S77, S86 25
Problem-orientedclassification proposed by LaTozaet al.31comprises 21 problem domains which they used to categorize 94 types of questions. Table 13 presents the obtained results of the classification of the 86 studies.
In summary, we observe that in the subject-oriented classification the majority of questions supported by visualizations relate to the code cate-gory. There is also a moderate number of visualizations that support questions that focus on people. Certainly, both represent the main subjects of software visualization. Indeed, Figure 8 shows that both code and people are balanced. The chart also shows that there are a few subjects such as Builds, Progress, and Web that even though they represent developer needs have less attention from the proposed visualizations.
In the process-oriented classification, we notice that visualization provides a good fit to the mental process of developers (i.e., the more com-plex the mental process, the more visualizations are available). Typically, visualizations provide developers with an overview that help them tofind
interesting patterns. Developers can reflect on those patterns andbuildhypotheses. Developers can test hypotheses by getting details on demand of elements that lead to a deeperunderstandingof the system artifact. Finally, developers are able to answer complexquestionsby combining their understanding on multiple findings.
We observe that in the problem-oriented classification there is a more fine-grained granularity that facilitates the analysis to understand the relationships between the needs of developers and the proposed visualization.
TABLE 13Problem-oriented classification of the 86 design studies.
Problem domain Reference #
Changes Building and branching - 0 Debugging S3, S14, S22, S34, S42, S48, S51, S53, S58, S59, S66, S69, S70, S78, S80 15 History S1, S2, S16, S24, S25, S35, S36, S40, S44, S54, S56, S60, S62, S67, S68, S72, S86 17 Implementing S6, S7, S11, S18, S19, S22, S30, S44, S58, S59, S63, S68 12 Implications S4, S6, S33, S41, S44, S47, S51, S71, S73, S76, S79 11 Policies - 0 Rationale S11, S81 2 Refactoring S6, S11, S45 3 Teammates S2, S24, S35, S37 4 Testing S22, S44, S51, S57, S60, S84 6 Element relationship Architecture S5, S8, S11, S12, S16, S23, S30, S32, S45, S51, S55, S83, S85 13 Contracts S27 1 Control flow S10, S11, S20, S42, S59, S65 6 Data flow S8, S20, S42, S59 4 Dependencies S5, S8, S13, S15, S21, S27, S31, S42, S43, S46, S50, S75, S76 13 Type relationships S27 1 Elements Concurrency S9, S17, S26, S29, S38, S39, S42, S59 8 Intent and implication S4, S51, S73, S76 4 Location S5, S28, S44, S51, S65, S77 6 Method properties S16, S44 2 Performance S49, S52, S53, S58, S61, S64, S74, S82 8
4.1
RQ1. What are the characteristics of visualization techniques that support developer needs?
While few problem domains in the classification (like debugging and testing) seem to be a task by themselves, they also occur very often in the context of addressing different tasks. That is, a visualization proposed to support questions regarding performance during a reverse engineering task (e.g., “where is most of the time being spent?”[S10]) may differ from the one proposed for performance questions that arise during a debugging session (e.g., “how did we get to these events?”[S53]). Figure 7 shows the mapping between the problem domains and the types of visualization techniques. In it, problem domains are labeled. The ones in the same category are vertically aligned (left-to-right changes, element relationships, and elements). The colors of the tiles encode the type of visualization technique used by studies tackling that domain. Problem domains that did not match any studies are shown in black. The size of a tile is proportional to the number of studies classified in that domain. Looking at the distribution of visualization techniques across the types of problem domains (i.e., changes, element relationships and elements) we do not perceive a preferred one. Instead, we observe that dense pixel and geometrically-transformed are the most frequent techniques used in the main problem domains such as history, debugging, performance. In contrast, iconic techniques are present in only a few domains, but when present they predominate over other techniques such as history, implications and testing. Iconic techniques enforce comparison of multivariate data by mapping their properties to the various dimensions of a glyph (including its position). Questions regarding the history domain frequently involve the time, which is commonly mapped to the position. We think that this is the reason why most visualizations proposed to tackle needs in the history domain include iconic techniques.
FIGURE 7 Mapping type of visualization used by studies to problem domains.
4.2
RQ2. How well are developer needs supported by visualization?
Since there is a large number of questions that developers need to answer during development, we analyze them at a higher-level by using classifi-cations proposed by research in the field. For each classification, we estimate the importance of categories for practitioners based on the number of type of questions (and frequencies) that they contain. The more questions a category contains, the more important that category is for developers. The metric is then normalized to enabling comparison.
Figures 8 , 9 and 10 compare the importance of developer needs (red bar) versus the number of visualization techniques proposed to address those needs (blue bar). They show that (1) when analyzing thesubjectsassociated with a need19(see Figure 8 ) questions related tocodeandpeople are of high relevance for developers. Although researchers invest an adequate attention to thecodecategory, many proposed visualization are classified in theotherscategory. The inspection of those questions shows that they relate to runtime analysis. That (2) the analysis of the importance of questions by theprocess17(see Figure 9 ) in which they are involved shows that developer needs and the proposed visualization are almost in sync. Most questions that developers pose, involvebuildingon initial findings. However, visualizations have focused slightly more on understanding than purely building. Finally, (3) we analyze the needs of developers by grouping questions at problem domain31(see Figure 10 ). We observe that practitioners are more concerned aboutchanges, while existing visualizations distribute their attentions among all three categories. Some problem domains (e.g., rationale, intent, implementation, and refactoring) are very important for developers but have little visualization support. In contrast, several less important problem domains (e.g., architecture, concurrency and dependencies) received a good degree of attention. We wonderwhy some are not supported?We conjecture that less well-supported domains tackle problems that require hidden semantics to be inferred from software artifacts, so proposing a visualization is difficult.
FIGURE 8 Subject-oriented analysis of importance of developer needs vs. their visualization support. The large number of visualizations in the
otherscategory exposes limitations of this classification.
FIGURE 9 Process-oriented analysis of importance of developer needs vs. their visualization support. The focus on each mental process seems well balanced.
4.3
Threats to Validity
The main threat to the validity of our study is bias in paper selection. We did not include papers from other venues. We mitigated this threat by selecting peer-reviewed papers from the most cited venues dedicated to software visualization. Moreover, we included design studies and excluded other types of papers. However, since most of papers do not specify their types, we may have missed some. We mitigated this threat by defining
FIGURE 10 Problem-oriented analysis of importance of developer needs vs. their visualization support. Ideally, both charts would be symmetrical.
However, we observe several unbalanced domains.
a cross-checking procedure and criteria for paper type classification. Finally, the data extraction process could be biased. We mitigated this by establishing a protocol to extract the data of each paper equally; and by maintaining a spreadsheet to keep records, normalize terms, and identify anomalies.
5
CONCLUSION
In this paper we studied 86 publications in academia that describe how visualization techniques can help developers to carry out their tasks, and we investigated how well practitioner needs are supported by existing visualization techniques. On the one hand, we analyze research that describes complex questions that practitioners often ask during software development. On the other hand, we reviewed the literature looking for the needs that benefit from particular visualizations. We compared the degree of importance of needs grouped by subject, process and problem domains for practitioners to the visualization support available for them. Although the developer needs grouped by subject and process seem well supported by visualization, we found a disconnect between the problem domains on which visualizations have focused and the domains that get the most attention from practitioners. The results of our literature study suggest that some problem domains such as rationale, refactoring, contracts and policies require more attention from the visualization community, while a considerable amount of work is devoted to dependencies, architecture and concurrency. This paper makes the following contributions:
• A study of the characteristics of existing research in the field of software visualization. • An analysis of the relation between practitioner needs and current visualization techniques.
In the future we plan to explore how software visualization is used in industry by characterizing open source software visualization tools.
ACKNOWLEDGMENTS
We thank all the authors of papers that kindly reviewed our classification and gave insightful comments, and in special to Alexandru Telea. We gratefully acknowledge the financial support of the Swiss National Science Foundation for the project “Agile Software Analysis” (SNSF project No. 200020-162352, Jan 1, 2016 - Dec. 30, 2018). Merino has been partially funded by CONICYT BCH/Doctorado Extranjero 72140330.
References
1. Theron Roberto, Gonzalez Antonio, Garcia Francisco J. Supporting the understanding of the evolution of software items. In: :189–192ACM; 2008.
2. De Pauw Wim, Krasikov Sophia, Morar John. Execution Patterns for Visualizing Web Services. In: ACM Press; 2006; New York NY.
3. Merino Leonel, Lungu Mircea, Nierstrasz Oscar. Explora: A Visualisation Tool for Metric Analysis of Software Corpora. In: :195–199IEEE; 2015. 4. Park Yunrim, Jensen Carlos. Beyond pretty pictures: Examining the benefits of code visualization for open source newcomers. In: :3–10IEEE;
2009.
5. Faltin Nils. Structure and constraints in interactive exploratory algorithm learning. In: Springer 2002 (pp. 213–226). 6. Reiss Steven P.. JOVE: Java as it happens. In: :115–124; 2005.
7. Maletic Jonathan I., Marcus Andrian, Collard Michael. A Task Oriented View of Software Visualization. In: :32–40IEEE; 2002. 8. Schots Marcelo, Werner Claudia. Using a Task-Oriented Framework to Characterize Visualization Approaches. In: :70–74IEEE; 2014. 9. Storey Margaret-Anne D., ˇCubranić Davor, German Daniel M.. On the use of visualization to support awareness of human activities in software
development: a survey and a framework. In: :193–202ACM Press; 2005.
10. Kienle Holger M., Muller Hausi A.. Requirements of Software Visualization Tools: A Literature Survey.VISSOFT 2007. 4th IEEE International Workshop on Visualizing Software for Understanding and Analysis.2007;:2–9.
11. Padda Harkirat, Seffah Ahmed, Mudur Sudhir. Visualization Patterns: A Context-Sensitive Tool to Evaluate Visualization Techniques. In: :88– 91IEEE; 2007.
12. Sensalire Mariam, Ogao Patrick, Telea Alexandru. Classifying desirable features of software visualization tools for corrective maintenance. In: :87–90ACM; 2008.
13. Merino Leonel, Ghafari Mohammad, Nierstrasz Oscar, Bergel Alexandre, Kubelka Juraj. MetaVis: Exploring Actionable Visualization. In: IEEE; 2016.
14. Gallagher Keith, Hatch Andrew, Munro Malcolm. A Framework for Software Architecture Visualization Assessment. In: :76–81IEEE CS; 2005. 15. Paredes Julia, Anslow Craig, Maurer Frank. Information visualization for agile software development. In: :157–166IEEE; 2014.
16. Shahin Mojtaba, Liang Peng, Babar Muhammad Ali. A systematic review of software architecture visualization techniques.Journal of Systems and Software.2014;94:161–185.
17. Sillito Jonathan, Murphy Gail C., De Volder Kris. Questions programmers ask during software evolution tasks. In: SIGSOFT ’06/FSE-14:23– 34ACM; 2006; New York, NY, USA.
18. Ko Andrew J., DeLine Robert, Venolia Gina. Information Needs in Collocated Software Development Teams. In: ICSE ’07:344–353IEEE Computer Society; 2007; Washington, DC, USA.
19. Fritz Thomas, Murphy Gail C.. Using information fragments to answer the questions developers ask. In: ICSE ’10:175–184ACM; 2010; New York, NY, USA.
20. Merino Leonel, Ghafari Mohammad, Nierstrasz Oscar. Towards Actionable Visualisation in Software Development. In: IEEE; 2016.
21. Keele Staffs.Guidelines for performing systematic literature reviews in software engineering.: Technical report, EBSE Technical Report EBSE-2007-01; 2007.
22. SoftVis.2016. 23. VISSOFT.2016. 24. CORE.2016.
25. Munzner Tamara. Process and pitfalls in writing information visualization research papers. In: Springer 2008 (pp. 134–153).
26. Merino Leonel, Seliner Dominik, Ghafari Mohammad, Nierstrasz Oscar. CommunityExplorer: A Framework for Visualizing Collaboration Networks. In: :2:1–2:9; 2016.
27. Schulz Rodrigo, Beck Fabian, Felipez Jhonny Wilder Cerezo, Bergel Alexandre. Visually Exploring Object Mutation. ;.
28. Keim Daniel A. Information visualization and visual data mining.Visualization and Computer Graphics, IEEE Transactions on.2002;8(1):1–8. 29. Merino Leonel, Ghafari Mohammad, Anslow Craig, Nierstrasz Oscar. CityVR: Gameful Software Visualization. In: :633–637IEEE; 2017. 30. Merino Leonel, Fuchs Johannes, Blumenschein Michael, et al. On the Impact of the Medium in the Effectiveness of 3D Software Visualization.
In: :11–21IEEE; 2017.
31. LaToza Thomas D., Myers Brad A.. Hard-to-answer Questions About Code. In: PLATEAU ’10:8:1–8:6ACM; 2010; New York, NY, USA.
How to cite this article:Merino L., Ghafari M., and Nierstrasz O. (2016), Towards Actionable Visualization for Software Developers,J Softw Evol
![TABLE 2 The included papers in the study [S1-S50] (the ones reviewed by their authors have a check mark).](https://thumb-us.123doks.com/thumbv2/123dok_us/810860.2602536/7.892.218.686.118.586/table-included-papers-study-ones-reviewed-authors-check.webp)