ISSN: 2443-1168
Load Identification Using Harmonic Based on Probabilistic
Neural Network
Dimas Okky Anggriawan, Aidin Amsyar, Eka Prasetyono, Endro Wahjono, Indhana Sudiharto, Anang Tjahjono
Politeknik Elektronika Negeri Surabaya
Email : [email protected], [email protected], [email protected], [email protected], [email protected]
Abstract
Due to increase power quality which are caused by harmonic distortion it could be affected malfunction electrical equipment. Therefore, identification of harmonic loads become importantattention in the power system. According to those problems, this paper proposes a Load Identification using harmonic based on probabilistic neural network (PNN). Harmonic is obtained by experimentusing prototype, which it consists of microcontroller and current sensor. Fast Fourier Transform (FFT) method to analyzeof current waveform on loads become harmonic load data. PNN is used to identify the type of load. To load identification, PNN is trained to get the new weight. Testing is conducted To evaluate of the accuracy of the PNN from combination of four loads. The results demonstratethat this method has high accuracy to determine type of loads based on harmonic load.
Keywords: Harmonic, FFT, Probabilistic Neural Network, Load
1. INTRODUCTION
The need for electronic equipment at this time is quite important.It used both for industrial needs or used for daily needs, especially non-linear loadssuch as Variable speed drives, UPS, Computers, LHE lamps and other electronic devices. But, harmonic distortion is caused by the use of non-linear loads. Harmonic distortion can produce power quality problem such us Voltage distortion, increase of temperature in equipment, equipment malfunction and poor quality of power factor.
The non linier loads have different characteristics, then the identification of the load can be observe based on the difference of harmonic characteristics is injected by the loads to the system. Identification of load profiles using harmonic values is known as non-intrusive identification, which means no termination of the current to the load so as not to interfere with the system.
Load identification in the future can be useful for load monitoring as well as the development of smartmeter tools. As we know so far that monitoring the harmonic load is very important because of the enormous harmonic impact on the system. Therefore, good monitoring system is needed to decide a strategy to reduce harmonic distortion level with filter placement.
To take necessary action to keep the harmonic distortion at level defined by IEEE Standard 519-1992 (IEEE Recommended Practice and Requirements for harmonic control in electrical power system) sets limits for acceptable levels in the harmonic current in the power system.Thus the user can know the importance of keeping the maximum limit value of harmonics in accordance with applicable standards.
For that, in this research is to identification harmonics at non-linier loads by using analysis of fast faurier transform, then do classification of load type having certain harmonics by using probabilistic neural network. This method has the speed of learning to know the type of load can be done quickly and the accuracy of the data obtained also has a good percentage.
2. RELATED WORKS
Many techniques to load identification, Heydt et al [2], presented state estimation technique with least square estimation to load identification. H. Ma et al [3], presented kalman filter technique to identification of harmonic source. Load identification using the current waveform presented [4] and [5], these literature proposed load identification using appliance signature. Robertson et al [6], proposed wavelet transform to load identification with unknown transient behaviors. However, this technique is expensive because to detect the transien behavior is required powerful device.
Cole at al [7], [8], load identification using non intrusive algorithm. But, this algorithm cannot be recognized if any appliance does not change. Therefore, load identification using harmonic is proposed in this paper to overcome the disadvantages of the previous literatures.
Lots of learning about power quality and identification types of loads using artificial neural network [9]-[14]. This model is trained using harmonic component data which gathered from a low cost microcontroller with fast Fourier Transform (FFT) asa analysis of the input current wave from in the presence of multiple devices. This model can identify the loads from the current harmonics. RBF is trained using harmonic data with 14 combinations of four different types of load.
3. ORIGINALITY
This study produce learning to recognize non-linier loads with harmonic distortion. Application from this study is to knowed the type of loads to be actived. This tool will work by using FFT analysis to get the harmonic values obtained from the current value in a system, then PNN training will be conducted to identify the type of load that is active, then the type of load detected can be displayed on the monitor screen. Thus the use of
this tool in the future will be able to be applied to smart meters which allows users to know the type of load that is active on all connected systems. So that users will be able to save power on a system.
4. SYSTEM DESIGN
System design of this research is shown in figure 1 There are two main processes in this system that is: Determine value harmonic with FFT and procces Probabilistik Neural Network
The harmonic distortion analysis prototype Air Conditioner Personal
Computer Laptop Lamp
LMBP Load
Identification
Figure 1. The measurement system 4.1 Data Capture
To start in doing this research is with collecting harmonic current and THD data. There are four types of non-linear loads to be taken as data, the data obtained from the measurement using microcontroller with FFT analysis which is a research laboratory B204 in the range 0-5 A, to ensure that the data is correct will be used fluke43B. These data will be divided as training data and testing data.
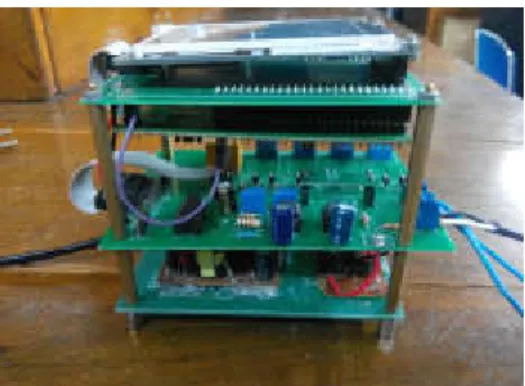
Figure 2. Harmonic distortion analysis prototype
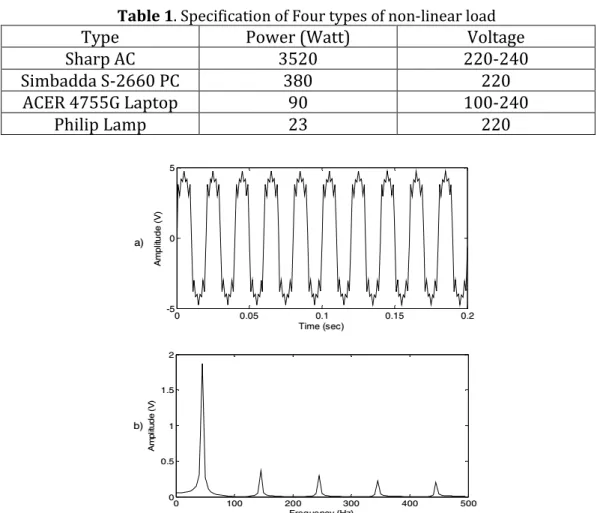
Four types of non-linear loads to be measured consist of SHARP AC, Simbadda S-2660 PC, ACER 4755G portable computer, and two Philips energy saving lamps 23 Watt. Load features in detail can be seen in the table 1. These four non-linear loads will be used 14 combinations and each of the data combinations will represent from the harmonic signal. The spesified data is a combination of two or three non-linear loads and a non-linear load, then the measurements were taken using a low cost microcontroller with FFT analysis. Harmonic signal can be seen in figure3.
Table 1. Specification of Four types of non-linear load
Type Power (Watt) Voltage
Sharp AC 3520 220-240
Simbadda S-2660 PC 380 220
ACER 4755G Laptop 90 100-240
Philip Lamp 23 220
Figure 3. (a) Harmonic signal. (b) Amplitude frequency analysis using FFT
The measurement carried out on the load will produce the current value, which will then take the odd harmonic value from the fundamental to
the 15th harmonic. Thus each of the data combinations will have 8 attributes.
Each combination teken 100 samples of data so there are 1400 samples data that will be used in the experiment. From a 100 samples data, the data used to experiment can be clasified of two data, first data for training and second data for testing.
4.2 Input of Probabilistik Function
The harmonic data consist of harmonic order of 1, 3, 5, 7, 9, 11, 13, and 15, which it measured by low cost microcontroller. Clasification on probabilistik function can be done using the pattern of the four combinations of non-linear loads, thereby obtaining 14 different combinations.
Each combination has a value of different harmonic data between combinations with each other. From the difference of data can be known combination that it used, thus can be known the type of no-linier loads that is active. The process used to determine the type of non-linear load is a probabilistic neural network. Probabilistik neural network is one of the
artificial neural networks that has a fairly high level of classification accuracy and training time is quite short.
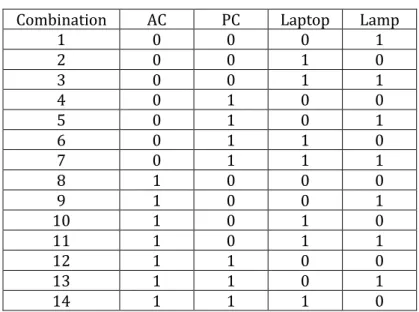
Table 2. Non-Linier load combination
Combination AC PC Laptop Lamp
1 0 0 0 1 2 0 0 1 0 3 0 0 1 1 4 0 1 0 0 5 0 1 0 1 6 0 1 1 0 7 0 1 1 1 8 1 0 0 0 9 1 0 0 1 10 1 0 1 0 11 1 0 1 1 12 1 1 0 0 13 1 1 0 1 14 1 1 1 0
There are two phases in the probabilistic neural network to determine a non-linier loads that is the training phase and the testing phase, in which each phase uses a combination of the four types of non-linear loads are ranged in 14 combination. The combination of the four types of non-linear loads which it is shown in table 2.
For each combination will have a harmonic value, so the identification of the type of load can be done with differences for each harmonic. The following is the data obtained by measurement using a prototype identification of the type of load which will then be used as training data, can be seen in the Table 3.
Table 3. Average values of 14 training data
Attribute Combination 1 2 3 4 5 6 7 8 9 10 11 12 13 14 1 8.55 10.57 15.22 168.21 92.93 167.44 88.98 9.59 9.20 10.51 9.39 10.35 10.35 10.71 3 169.61 78.24 91.11 15.34 27.79 18.59 33.67 397.88 406.58 392.47 400.01 363.59 363.59 367.61 5 9.01 1.66 8.38 16.69 16.64 19.72 19.79 25.38 20.89 28.27 21.14 32.00 32.00 34.00 7 5.69 1.71 5.00 13.57 9.60 16.29 12.79 25.32 28.78 26.75 28.46 12.68 12.68 12.27 9 3.64 1.12 3.37 9.28 10.55 11.97 11.76 8.90 5.89 8.71 4.84 11.82 11.82 11.68 11 2.3 1.52 2.27 5.49 9.19 8.01 9.88 3.57 2.15 2.57 1.65 3.73 3.73 4.10 13 1.75 1.38 2.01 2.55 3.56 4.47 2.14 2.64 2.78 1.54 1.88 2.17 2.17 2.60 15 2.23 1.24 2.44 1.62 2.53 3.29 3.29 2.46 2.73 1.96 3.40 1.83 1.83 2.05 THD 2.27 1.56 2.27 1.81 1.39 1.90 2.68 1.58 2.62 1.93 2.88 1.69 1.69 1.91 4.3 FFT Algorithm
To shorten the calculation process using the DFT (Discrete Fourier transform) method, the FFT (fast fourier transform) method is used by using basic equations DFT [15]-[16] .
In the FFT process begins with decomposition, it is done to simplify multiplication, so that the process can be done faster. Decomposition works by breaking a signal point so that it can be divided into two samples, namely even samples and odd samples. So that the equation can be written as in equation as follow:
As the equation obtained to long, so it is used as a simplification, so equation can be written:
Because , then , so the equation become:
dan are periodic with period N/2. Therefore, FFT can be expressed as
4.4 Probabilistic function
The structure of PNN is more detailed consisting of 3 parts, namely input layer, radialbasis layer and competitive layer. The function of the radialbasis layer is to evaluates the vector distance between the input vector and the weight line in the form of weight matrix. The distance is scaled by a non linear radialbasis function.
The competitive layer is to search for the shortest distance and find training pattern from the patern input based on its distance. The structure of PNN itself can be seen in Figure 4. By using the PNN model, training speed can be done very quickly so that it is suitable for use in a system that requires real time data as a fault diagnosis and signal classification problem.
H3
H4
Hh H1
H2
Input layer Hidden Layer Output Layer
Radial Basis Layer Competitive Layer X1 X2 Xi Y1 Y2 Yj Figure 4. Architecture of a PNN
In the signal-classification application, the training examples are classified according to their distribution values of probabilistic density function (pdf), which is the basic principle of the PNN. A simple pdf is as follows: With : I = 1, 2, ..., K. T = Transpose i = Number of Classes j = Number of Patterns
xij = Training vector to j from class i
x = Test Vector
Mi = Number of training vectors from class i
= Vector dimensions x
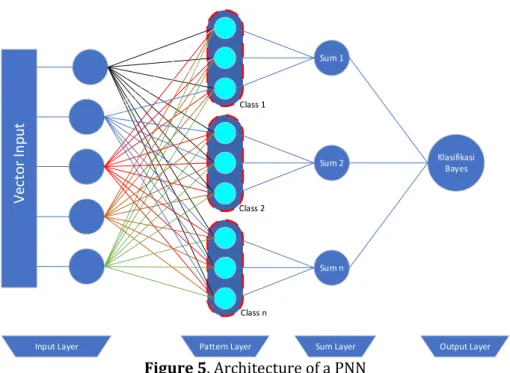
Sum 1 Sum 2 Sum n Klasifikasi Bayes Class 1 Class 2 Class n
Input Layer Pattern Layer Sum Layer Output Layer
V ec to r Inp u t Figure 5. Architecture of a PNN
The position of the nodes allocated in the PNN after the input layer as shown in Figure 5, is:
1. Pattern layer, 1 pattern node is used for each training data used. Each
pattern node is a dot product of the input vector x which will be clarified, with a weight vector xij, that is Zi = x . xij, then non-linear operations are
carried out Zibefore becoming an output that will activate the addition
layer, the non-linear operation used is exp [(Zi - 1) / 2 ], when x and
xijnormalized to vector length, the equation used in the pattern layer is:
2. Summation layer, accepting input from the pattern layer nodes associated
with the existing class, the equation used by this layer is:
3. Output layer, produces binary output (0.1), and only has a single weight
variable Ck. Ck is calculated using the equation:
Where:
mik = number of pattern training from class ik
mjk = number of pattern training from class jk
5. EXPERIMENT AND ANALYSIS
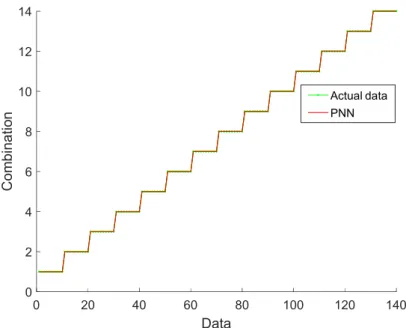
This experiment is conducted to evaluate the performance of PNN for load identification by giving different spread values ranging from 0.1 to 0.9 when the training is conducted. Then data testing will be provided so that it
will be compared with the results of the training data. The result of the data obtained is an error value on each harmonic value of 1, 3, 5, 7, 9, 11, 13, and 15. For more details can be seen on Figure 6 and Figure 7.
0 20 40 60 80 100 120 140 Data 0 2 4 6 8 10 12 14 C o m b in a ti o n Actual data PNN
Figure 6. Results of training data using PNN for identification load with spread 0.5
1 1.5 2 2.5 3 3.5 4 4.5 5 Data 3 3.5 4 4.5 5 Actual Data Identification Result
Figure 7. Results of testing data using PNN for identification load in combination 4
The error values that occur in the same spreads with different harmonic frequencies have different values. So to draw conclusions about the
best spread used is to find the average value of each error on the spread, then obtained the required error value.
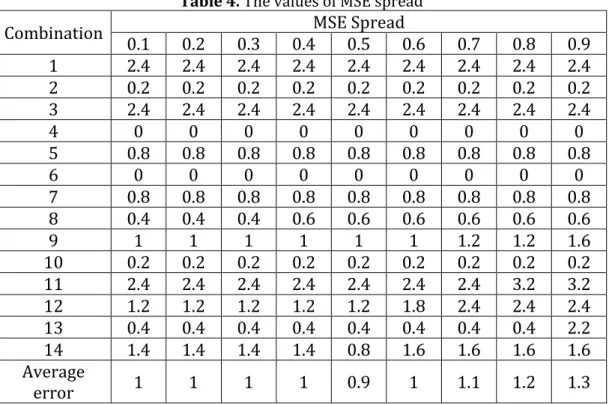
Table 4. The values of MSE spread
Combination MSE Spread
0.1 0.2 0.3 0.4 0.5 0.6 0.7 0.8 0.9 1 2.4 2.4 2.4 2.4 2.4 2.4 2.4 2.4 2.4 2 0.2 0.2 0.2 0.2 0.2 0.2 0.2 0.2 0.2 3 2.4 2.4 2.4 2.4 2.4 2.4 2.4 2.4 2.4 4 0 0 0 0 0 0 0 0 0 5 0.8 0.8 0.8 0.8 0.8 0.8 0.8 0.8 0.8 6 0 0 0 0 0 0 0 0 0 7 0.8 0.8 0.8 0.8 0.8 0.8 0.8 0.8 0.8 8 0.4 0.4 0.4 0.6 0.6 0.6 0.6 0.6 0.6 9 1 1 1 1 1 1 1.2 1.2 1.6 10 0.2 0.2 0.2 0.2 0.2 0.2 0.2 0.2 0.2 11 2.4 2.4 2.4 2.4 2.4 2.4 2.4 3.2 3.2 12 1.2 1.2 1.2 1.2 1.2 1.8 2.4 2.4 2.4 13 0.4 0.4 0.4 0.4 0.4 0.4 0.4 0.4 2.2 14 1.4 1.4 1.4 1.4 0.8 1.6 1.6 1.6 1.6 Average error 1 1 1 1 0.9 1 1.1 1.2 1.3
From the simulation that be done, using different spread and the value of testing given the same value. In the table 4, the minimum error of PNN for identification is combination of 4 and 6 with the values are 0, respectively. Whereas, combinations with the maximum error are 1, 3 and 11 with the values are 2.4, respectively.
The results of PNN for identification show that spreads with a value of 0.1 has an average value of all combinations load types is 1%. For a trial using a spread value of 0.2 to 0.4, the result of error value is still of 1%. When the value of spread used is 0.5 the result of the error is 0.9%, the result is better than the previous result with the difference of 0.1%. For spreads of 0.6 to 0.9 the resulting error value keeps growing by 0.1%.
It can be concluded that the best of PNN for identification using spread of 0.5 which has an error value of 0.9% then spread of 0.5 has the minimum average error value.
6. CONCLUSION
This paper proposes a probalilistic neural network for load identification using harmonic. To evaluation the performance of proposed algorithm, simulation is conducted by vary of spread values. From the simulation which is conducted, can be concluded that using a probabilistic neural network can do training quickly and get good result with a small error value. With using spread 0.5 when training, the error value is better than the
other spread values. Thus, the identification of the load can be done better by using this method.
REFERENCES
[1] IEEE std. 519-1992 IEEE Recommended Practices and Requirement
for Harmonic Control in Electrical Power Systems.
[2] G.T. Heydt, Identification of Hharmonic sources by a state
estimation technieque, IEEE Trans. Power Del. Vol. 4 no. 1, pp. 569-576, jan. 1989.
[3] H. Ma and A. A. Girgis, Identification and tracking of harmonic
sources in a power system using a Kalman FIlter, IEEE Trans. Power Del., vol. 11, no. 3, pp. 1659-1665, jul. 1996.
[4] F. Sultanem, Using appliance signatures for monitoring residential
loads at meter panel level, IEEE Trans. Power Del., vol. 6, no. 4, pp. 1380–1385, Oct. 1991.
[5] G.W. Hart, Nonintrusive appliance load monitoring, Proc. IEEE, vol.
80, no. 12, pp. 1870–1891, Dec. 1992.
[6] D. C. Robertson, O. I. Camps, J. S. Mayer, and W. B. Gish, Sr., Wavelets
and electromagnetic power system transients, IEEE Trans. Power Del., vol. 11, no. 2, pp. 1050–1056, Apr. 1996.
A. I. Cole and A. Albicki, Data extraction for effective non-intrusive
identification of residential power loads, in Proc. IEEE Instrum. Meas.Technol. Conf., 1998, pp. 812–815.
[7] I. Cole and A. Albicki, Algorithm for non-intrusive identification of
residential appliances, in Proc. IEEE Int. Symp. Circuits Syst., 1998, pp. 338–341.
[8] Anggriawan, D.O., Satriawan, A.L., Sudiharto, I., Wahjono, E., Prasetyono,
E., Tjahjono, A., “Levenberg Marquardt Backpropagation Neural Network for Harmonic Detection”, International Electronics Symposium on Engineering Technology and Application (IES-ETA), 2018
[9] Sudiharto, I., Anggriawan, D.O., Tjahjono, A., Harmonic Load
Identification Based on Fast Fourier Transform and Levenberg Marquardt Backpropagation, Journal of Theoretical and Applied Information Technology, vol. 95, Iss. 5, pp. 1080, 2017
[10] Mubarok, A.F., Octavira, T., Sudiharto, I., Wahjono, E., Anggriawan, D.O.,
“Identification of Harmonic Loads Using Fast Fourier Transform and Radial Basis Function Neural Network”, International Electronics Symposium on Engineering Technology and Application (IES-ETA), 2017
[11] M. T. Musav1, W. Ahmed, K. H. Chan, K. B. Faris, T And D. M. Hummels,
On the Training of Radial Basis Function Classifiers, Pergamon Press Ltd. Neural Networks vol. 5, pp. 595-603. 1992.
[12] Young-Sup Hwang and Sung-Yang Bang, An Efficient Method to
Construct a Radial Basis Function Neural Network Classifier, Elsevier Science Ltd, Neural Networks. vol. 10, no. 8, 1997.
[13] J.A Leonard, M.A Kramer, Radial basis function networks for classifying process faults, IEEE Control Systems, Vol. 11, No. 3, April. 1991.
[14] Wu, Sthephen Gang. 2007. A leaf recognition algorithm for plant
clasification using probabilistic neural network. IEEE ISSPIT 2007 on computer science and electrical engineering involve artificial intelligence and Neurology.
[15] F. Zhang, Z. Geng, W. Yuan, The Algorithm of interpolating
Windowed FFT for harmonic Analysis of electric Power System, IEEE Trans. Power Del., Vol. 16, No. 2, Apr. 2001.
[16] H.Qian, R. Zhao, T. Chen, Interhamonics Analysis Based on
Interpolating Windowed FFT Algorithm IEEE Trans. Power Del, Vol. 22, no. 2, Apr. 2007.