University of Kentucky
University of Kentucky
UKnowledge
UKnowledge
Radiation Medicine Faculty Publications
Radiation Medicine
6-20-2019
A Transfer Learning Approach for Malignant Prostate Lesion
A Transfer Learning Approach for Malignant Prostate Lesion
Detection on Multiparametric MRI
Detection on Multiparametric MRI
Quan Chen
University of Kentucky, [email protected]
Shiliang Hu
iLuvatar Corex, China
Peiran Long
iLuvatar Corex, China
Fang Lu
iLuvatar Corex, China
Yujie Shi
iLuvatar Corex, China
See next page for additional authors
Follow this and additional works at: https://uknowledge.uky.edu/radmed_facpub
Part of the Health Information Technology Commons, Oncology Commons, and the Radiology Commons
Right click to open a feedback form in a new tab to let us know how this document benefits you.
Right click to open a feedback form in a new tab to let us know how this document benefits you.
Repository Citation
Repository Citation
Chen, Quan; Hu, Shiliang; Long, Peiran; Lu, Fang; Shi, Yujie; and Li, Yunpeng, "A Transfer Learning Approach for Malignant Prostate Lesion Detection on Multiparametric MRI" (2019). Radiation Medicine Faculty Publications. 23.
https://uknowledge.uky.edu/radmed_facpub/23
This Article is brought to you for free and open access by the Radiation Medicine at UKnowledge. It has been accepted for inclusion in Radiation Medicine Faculty Publications by an authorized administrator of UKnowledge. For more information, please contact [email protected].
A Transfer Learning Approach for Malignant Prostate Lesion Detection on
A Transfer Learning Approach for Malignant Prostate Lesion Detection on
Multiparametric MRI
Multiparametric MRI
Abstract
Abstract
Purpose:Purpose: In prostate focal therapy, it is important to accurately localize malignant lesions in order to increase biological effect of the tumor region while achieving a reduction in dose to noncancerous tissue. In this work, we proposed a transfer learning–based deep learning approach, for classification of prostate lesions in multiparametric magnetic resonance imaging images. Methods:Methods: Magnetic resonance imaging images were preprocessed to remove bias artifact and normalize the data. Two state-of-the-art deep convolutional neural network models, InceptionV3 and VGG-16, were pretrained on ImageNet data set and retuned on the multiparametric magnetic resonance imaging data set. As lesion appearances differ by the prostate zone that it resides in, separate models were trained. Ensembling was performed on each prostate zone to improve area under the curve. In addition, the predictions from lesions on each prostate zone were scaled separately to increase the area under the curve for all lesions combined. Results:Results: The models were tuned to produce the highest area under the curve on validation data set. When it was applied to the unseen test data set, the transferred InceptionV3 model achieved an area under the curve of 0.81 and the transferred VGG-16 model achieved an area under the curve of 0.83. This was the third best score among the 72 methods from 33 participating groups in ProstateX competition. Conclusion: Conclusion: The transfer learning approach is a promising method for prostate cancer detection on multiparametric magnetic resonance imaging images. Features learned from ImageNet data set can be useful for medical images.
Keywords
Keywords
mpMRI, prostate lesion, transfer learning, AI, convolutional neural network, focal therapy
Disciplines
Disciplines
Health Information Technology | Oncology | Radiology
Notes/Citation Information
Notes/Citation Information
Published in Technology in Cancer Research & Treatment, v. 18, p. 1-9. © The Author(s) 2019
This article is distributed under the terms of the Creative Commons Attribution-NonCommercial 4.0 License (http://www.creativecommons.org/licenses/by-nc/4.0/) which permits non-commercial use, reproduction and distribution of the work without further permission provided the original work is attributed as specified on the SAGE and Open Access pages ( https://us.sagepub.com/en-us/nam/open-access-at-sage).
Authors
Authors
Quan Chen, Shiliang Hu, Peiran Long, Fang Lu, Yujie Shi, and Yunpeng Li
Artificial Intelligence Based Treatment Planning for Radiotherapy-Original Article
A Transfer Learning Approach for Malignant
Prostate Lesion Detection on
Multiparametric MRI
Quan Chen, PhD, DABR
1, Shiliang Hu, PhD
2, Peiran Long, BS
2,3,
Fang Lu, BS
2,4, Yujie Shi, PhD
2, and Yunpeng Li, MS
2Abstract
Purpose:In prostate focal therapy, it is important to accurately localize malignant lesions in order to increase biological effect of the tumor region while achieving a reduction in dose to noncancerous tissue. In this work, we proposed a transfer learning–based deep learning approach, for classification of prostate lesions in multiparametric magnetic resonance imaging images.Methods:
Magnetic resonance imaging images were preprocessed to remove bias artifact and normalize the data. Two state-of-the-art deep convolutional neural network models, InceptionV3 and VGG-16, were pretrained on ImageNet data set and retuned on the multiparametric magnetic resonance imaging data set. As lesion appearances differ by the prostate zone that it resides in, separate models were trained. Ensembling was performed on each prostate zone to improve area under the curve. In addition, the predictions from lesions on each prostate zone were scaled separately to increase the area under the curve for all lesions combined.Results:The models were tuned to produce the highest area under the curve on validation data set. When it was applied to the unseen test data set, the transferred InceptionV3 model achieved an area under the curve of 0.81 and the transferred VGG-16 model achieved an area under the curve of 0.83. This was the third best score among the 72 methods from 33 participating groups in ProstateX competition. Conclusion: The transfer learning approach is a promising method for prostate cancer detection on multiparametric magnetic resonance imaging images. Features learned from ImageNet data set can be useful for medical images.
Keywords
mpMRI, prostate lesion, transfer learning, AI, convolutional neural network, focal therapy
Abbreviations
ADC, apparent diffusion coefficient; AS, anterior fibromuscular stroma; AUC, area under the curve; CAD, computer-aided detection; DCE-MRI, dynamic contrast-enhanced MRI; DCNN, deep convolutional neural networks; DWI, diffusion-weighted imaging; FPR, false-positive ratio; mpMRI, multiparametric magnetic resonance imaging; PI-RADS, Prostate Imaging Reporting and Data System; POI, points of interest; PSA, prostate-specific antigen; PZ, peripheral zone; ROC, receiver operating characteristics; SV, seminal vesicle; T2W, T2-weighted imaging; TPR, true-positive ratio; TZ, transitional zone.
Received: December 18, 2018; Revised: April 01, 2019; Accepted: May 20, 2019.
Introduction
Prostate cancer is common and a frequent cause of cancer death. In 2017, there are estimated to be 161 000 new prostate cancer diagnoses and approximately 26 700 prostate cancer deaths1 in the United States. It is also the most commonly diagnosed cancer in men and the seventh leading cause of male cancer death worldwide.2The current practice for prostate can-cer detection involves using prostate-specific antigen (PSA) testing for screening,3followed by transrectal needle biopsy
1
Department of Radiation Medicine, University of Kentucky, Lexington, KY, USA
2iLuvatar Corex, Nanjing, Jiangsu, China
3Computer Science, Brown University, Providence, RI, USA 4Computer Science, Syracuse University, Syracuse, NY, USA
Corresponding Author:
Quan Chen, PhD, DABR, Department of Radiation Medicine, University of Kentucky, Markey Cancer Center, Rm CC063, 800 Rose St, Lexington, KY 40536, USA.
Email: [email protected]
Creative Commons Non Commercial CC BY-NC: This article is distributed under the terms of the Creative Commons Attribution-NonCommercial 4.0 License (http://www.creativecommons.org/licenses/by-nc/4.0/) which permits non-commercial use, reproduction and distribution of the work without further permission provided the original work is attributed as specified on the SAGE and Open Access pages (https://us.sagepub.com/en-us/nam/open-access-at-sage).
Technology in Cancer Research & Treatment
Volume 18: 1-9
ªThe Author(s) 2019 Article reuse guidelines: sagepub.com/journals-permissions DOI: 10.1177/1533033819858363 journals.sagepub.com/home/tct
for PSA positive patients. However, this practice has been questioned recently because of the poor efficacy.4-6One prob-lem is that PSA can elevate in a number of benign conditions such as benign prostatic hyperplasia and prostatitis. Studies have found that less than 1 in 3 men with an elevated PSA would have prostate cancer detected in biopsy.7-9Another issue is that due to the lack of image guidance, the needle biopsy could miss the malignant lesion, causing understaging or even false negatives.10
Recently, multiparametric magnetic resonance imaging (mpMRI) has been found to be a valuable diagnostic tool for the detection, localization, and staging of prostate cancer.11 The mpMRI includes T2-weighted imaging (T2W) sequence, diffusion-weighted imaging (DWI), and dynamic contrast-enhanced MRI (DCE-MRI). The combination of morphologi-cal and functional information provided by mpMRI allows for precise identification of prostatic lesions while avoiding the sampling error of biopsies. Studies have shown that the mpMRI is able to detect intermediate/high-grade prostate cancer as reliable as systematic biopsies,12-14thus reducing the number of biopsy samples and improving the accuracy of the diagnosis. The challenge with adopting mpMRI for prostate cancer diagnosis and staging is how to interpret the data in a reliable and replicable fashion. Radiological societies from Europe and North America have established Prostate Imaging Reporting and Data System (RADS) guideline and subsequently PI-RADSv2 to address this problem.15,16It has been shown that the PI-RADSv2 can achieve good performance.17-19 Unfortu-nately, studies also show that there exist significant interobser-ver variabilities from radiologists based on experience and training.17-19In addition, as radiologists have to review multi-ple three-dimensional image sets, visual and mental fatigue could be a factor that can affect the accuracy of the interpretation.20
Computer-aided detection (CAD) system holds great poten-tial in assisting radiologists. It can provide more reproducible results while consuming less time. More importantly, it is not restricted by the limitation of human’s visual system. Using data characterization algorithms, large amount of quantitative features, termed as radiomic features, can be extracted from images. Relationships can be established between those radio-mic features and diagnosis through machine-learning algo-rithms. Several studies have reported the encouraging result for prostate lesion classification.21-23
Since the success of AlexNet in ImageNet competition24in 2012, deep convolutional neural networks (DCNN) has drama-tically improved the performance of computer algorithms in many tasks.25 In medical imaging domain alone, there are already many examples of DCNN based algorithms exceeded human experts’ performance, including diabetic retinopathy diagnosis,26skin cancer diagnosis,27and breast cancer metas-tases from pathology images.28
From November 2016 to January 2017, Society of Photo-Optical Instrumentation Engineers, along with the support of American Association of Physicists in Medicine and National Cancer Institute held the prostateX grand challenge to identify
top-performing quantitative image analysis methods for the diagnostic classification of clinically significant prostate lesions from mpMRI images.29 In this article, we present our DCNN approaches to this problem. We experimented with transfer learning from 2 state-of-art DCNN models trained on ImageNet data set. Proper data preprocessing as well as ensem-bling were applied. An innovative rescaling scheme was cre-ated for mixing scores predicted for lesions at different prostate zone. One of our models achieved the third best score among 72 methods from 33 participating groups in this open competition.
Materials and Methods
Deep Convolutional Neural Network
Artificial neural network is made up with network of neurons that has learnable weights and biases. It has been proved math-ematically that a feed-forward network with as few as one single hidden layer of finite neurons can approximate (learn) any continuous function.30 As more layers are stacked, the network can have better learning capacities. Deep convolu-tional neural network, which uses many convoluconvolu-tional and pooling layers, has demonstrated excellence performance in image classification. Different neural network architectures have been proposed to improve the classification performance in ImageNet. VGG-Net31adopts a simple design with only 3 3 convolution and 22 pooling layers, but the deep network constructed produced better accuracy (92.7%) than previous models in 2014 ImageNet competition.32 The same year, InceptionNet,33,34a deeper network design with the innovative inception modules, achieved the top accuracy of 93.4%.32For this study, we adopted both designs that were proved to be successful. In the subsequent text, model 1 refers to VGG and model 2 refers to InceptionNet.
Data Set
The data set provided by prostateX organizer was collected from a single institution with one of the 2 Siemens (Munich, Germany) 3T MR scanners, the MAGNETOM Trio and Skyra.23For each patient, T2W, DWI, and DCE imaging were performed. The T2W was performed in Transverse (T2W_T), Coronal (T2W_C), and Sagittal (T2W_S) planes. For the DWI scans, the scan at b ¼800 s/mm2 (Bval800) as well as the apparent diffusion coefficient (ADC) map were provided. For DCE scans, the volume transfer constant (K-trans) images were computed.
Each study was read by expert radiologists. The suspected areas were marked and biopsy was performed to provide ground truth. Additional negative samples were provided by randomly sampling the patient that was confirmed to be disease-free. Based on human experience, the particular fea-tures of prostate lesion differ based on prostate zone.15,18 Coor-dinates of these points of interest (POI) and the prostate zonal information were provided.
During the training phase of the competition, data set con-taining 330 POIs from 204 patients was released. The ground truth for those training data was also provided. During the test phase of the competition, data set containing 208 POIs was provided. The POIs distribute unevenly into 4 different prostate zones: peripheral zone (PZ), transitional zone (TZ), anterior fibromuscular stroma (AS), and seminal vesicle (SV) as shown in Table 1. Since there are no malignant SV lesions in training data, the model cannot learn image features that define a malig-nant SV lesion. Therefore, our model will classify all SV lesions as benign.
When evaluating machine-learning models, the validation step helps to identify the best parameters for the model while also prevent it from becoming over-fitted. Two of the most popular strategies to perform the validation step are the holdout strategy and the K-fold strategy.35,36 The holdout validation sets aside a chunk of training data to evaluate the model per-formance. The K-fold strategy divides the training set into K folds (or chunks) and then trains the model K times, each time leaves a different fold out of the training data as a validation set. We tried with both validation strategies. For model 1, we used holdout validation. Approximately one-third (patient id 00-64) of the data were set aside as validation data. The distri-bution of lesion across zones resembles the distridistri-bution in train-ing data set as shown in Table 1. For model 2, we use 3-fold cross-validation technique. Training data set was randomly grouped into 3-folds for each prostate zone. The ratio of malig-nant versus benign was kept the same across the folds.
As shown in Table 1, training data set consists of mostly negative findings. Especially in transition zone, 89% of the lesions provided are negative. Such highly unbalanced data set can easily bias DCNN to predict negative for almost all cases. To combat this issue, we oversample the positive cases by increasing the data augmentation while undersample the neg-ative cases by reducing the data augmentation during the model training process.
Preprocessing
One of the major drawbacks of MRI has been the lack of quantifiable interpretation of image intensities. Within the same image, the intensities for the same material vary as they are affected by bias field distortions. In addition, not only do MR images taken on different scanner vary in image intensi-ties, but the images for the same patient on the same scanner at
different times may appear differently from each other due to a variety of scanner-dependent variations.37,38Therefore, it is important to normalize the MR intensity first. For the T2W MRI, Bias correction with ITK39 function N4ITKBiasField-Correction40and histogram matching with ITK39function His-togramMatchingImageFilter38 were performed to normalize the data. The N4ITKBiasFieldCorrection removes the intensity variation of homogeneous tissue region for each image indivi-dually. The HistogramMatchingImageFilter ensures that the intensity distribution is consistent across the patients.
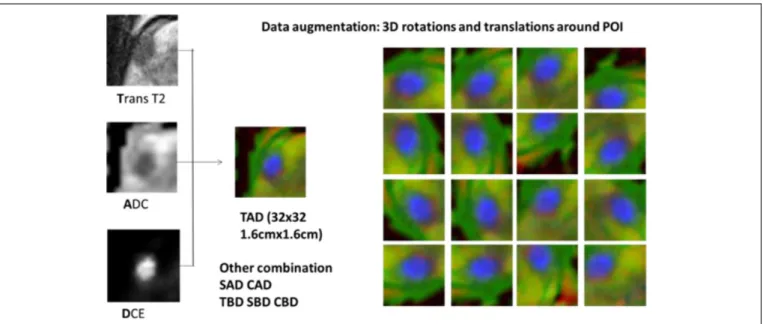
Lesions were located with the provided world coordinate in each mpMRI. A 1.6 cm1.6 cm Region-Of-Interest box with grid size of 0.5 mm was used to crop the lesion from the T2 MRI slice. The same grid was used to sample the ADC, B-value and K-trans volume using the world coordinates, resulting in corresponding 32 32 matrixes as well. This process is repeated for T2 Transversal, Coronal and Sagittal scans, obtaining 3 orthogonal slices centered at POI. Images from different MRI scans are combined into RGB channels for the deep learning algorithm to process. Figure 1 illustrates an example of combining T2W_T scan, ADC map, and DCE K-trans image into an image (labeled as TAD). Other combina-tions including T2W_S-ADC-DCE (SAD), T2W_C-ADC-DCE (CAD), T2W_T-Bval-T2W_C-ADC-DCE (TBD), T2W_S-Bval-T2W_C-ADC-DCE (SBD), and T2W_C-Bval-DCE (CBD) were similarly created. Data augmentation was performed with random rotation and translation. Since the clinical classification of prostate lesion depends on the size and contrast of the lesion, other augmenta-tion techniques popular in natural scene classificaaugmenta-tion, such as intensity shift, scaling, color jittering, was not used.
Transfer Learning
As networks get deeper for better learning capacity, the number of parameters in the model (model size) also grows. This not only increases the computation complexity but also requires more training data. ImageNet contains 14 million pictures, with at least 500 unique images for each object. For diabetic retino-pathy diagnosis,26128 000 images are available. However, for this study, only 330 lesions are provided as training data. We were concerned that this amount of data is not enough to train a full-fledged DCNN from scratch. Fortunately, a technique called transfer learning where a DCNN trained on one problem is applied to a different but related problem can alleviate the demand for big training data set. Many studies have demon-strated the effectiveness of this approach.41-43 Therefore, we adopted the transfer learning approach. We started from the ImageNet pretrained InceptionV3 model (model 1) and VGG-16 model (model 2), and modified the last fully connected layer to produce 2 classes (benign and malignant). For model training, only the weights on the last layer were allowed to change.
The model’s hyper parameters were tuned based on the per-formance on validation data set to avoid overfitting. Default learning rates for training a modern DCNN from scratch are typically higher than necessary for our transfer learning models which only train the final classification stage. Based on Table 1.Distribution of POI by Zone (# of Malignant/Total).a
Data Set PZ TZ AS SV Training 36/191 9/82 31/55 0/2 Validation 10/58 1/19 7/12 0/0 Test ?/113 ?/59 ?/34 ?/2
Abbreviations: AS, anterior fibromuscular stroma; POI, points of interest; PZ, peripheral zone; SV, seminal vesicle; TZ, transitional zone.
aThe ground truth for test data set was not disclosed (labeled by question mark).
validation data performance, we determined an initial learning rate of 1e-5 with 10-fold reduction for every 100 epochs training. Dropout was applied to fully connected layers with probability of .5. Cross-entropy loss was used and was minimized using stochastic gradient descent with Nesterov momentum of 0.9.
Postprocessing
A popular postprocessing technique in machine learning to increase the accuracy of the prediction is ensembling. The ensembling refers to the technique of combining predictions of different models. It reduces both bias and variance of the final results, thus reduces the risk of overfitting and increas-ing the final score. There are many ensemblincreas-ing techniques, such as bagging, boosting, blending, and stacking. Due to the time constraint of the competition, we implemented a very simple ensembling approach. For each model, we aver-aged the scores of 50 augmented images (fixed translation and rotation) of the same lesion as the model output. For each prostate zone, we picked the 2 best performing models based on the validation data set. Then for each lesion in the test data set, we averaged the prediction from the 2 best performing models.
The ProstateX challenge uses the area under the receiver operating characteristics (ROC) curve (AUC) as the metric for final ranking. The ROC curve is defined as a plot of true-positive ratio (TPR) against false-true-positive ratio (FPR) when the threshold c moves on a real number line. Our DCNN mod-els will analyze each lesion image and produce a confidence score of being malignant between 0 and 1. Varying the thresh-old c will produce different TPR and FPR and form an ROC curve:
ROCðx;yÞ:x¼FPRðcÞ; y¼TPRðcÞ jc2 ½0;1 ð1Þ
In our study, lesions from different prostate zones were trained and evaluated separately. It had been observed that the scores from different prostate zone carry different confidence, likely that due to the different appearance of the lesion and the different amount of training images available at each prostate zone. In that case, simply combining the scores from different prostate zone may not be the optimal solution. Figure 2 is a simple illustration of the problem. Scores predicted for zone 1 and zone 2 are plotted. Predictions for zone 1 lesions achieved a perfect AUC of 1.0, where the threshold of 0.4 can separate the positive and negative cases. On the other hand, the predictions for zone 2 lesions also achieved a perfect AUC of 1.0 but with optimal threshold at 0.6. When the scores for all lesion zones were combined, there is no threshold value that can perfectly separate the positive and negative cases and the AUC will be less than 1.0. However, if we rescale the scores for zone 2 by 0.67 before combining the scores, the AUC of 1.0 can be achieved for all lesions.
Figure 1.Combing multiparametric magnetic resonance imaging (mpMRI) images into RGB channels and augmentation with random rotation and translation.
Figure 2.Illustration of maximizing the area under the curve (AUC) when lesions from 2 different zones are combined. Red circles illus-trate positive cases and blue cross illusillus-trate negative cases. The AUC will be less than 1.0 if we simply combine cases from 2 zones. However, if we rescale the scores for zone 2 by 0.67 before mixing the cases, the AUC of 1.0 can be achieved.
Based on validation ROC curves at each prostate zone, we designed simple heuristic strategy to remap the raw scores to improve the combined AUC. We first identify the threshold valuecoifor zone i that satisfiesFPRiðcoiÞ ¼1TPRiðcoiÞ.
Then for predicted score (si) at zonei, we create this mapping
to create a new score (Si0):
Si}¼ si coi 0:5ðsicoiÞ 1 1si 1coi 0:5ðsi>coiÞ : 8 > > < > > : ð2Þ
Note that this transformation only uses one control point. It is possible to design a piecewise mapping of the predicted score that can achieve a higher combined AUC than this simple formula. However, due to the limited validation data, the shape of the validation AUC for each prostate zone can be different from the test data. A complex score mapping may over-fit the validation data. Therefore, for this competition, we did not attempt to craft other complex score mappings.
Experiment and Results
Figure 3 demonstrates the correction of image intensity varia-tion by bias field distorvaria-tion by the N4ITKBiasFieldCorrecvaria-tion
function. The most obvious change is in the subcutaneous fat. It exhibits a much brighter appearance at the edges in the original image (Figure 3A). This nonuniformailty has been corrected in Figure 3B. In addition, the apparent contrast between the left and right prostate PZ in the original image seems to be the result of the bias field distortion, as the contrast reduced sig-nificantly in Figure 3B.
Figure 4 demonstrated the improvement of AUC from ensembling. A single model achieved an AUC of 0.80 for AS lesions in the validation data set. After averaging predicted scores from 50 augmented images of each lesion, and over predictions from different models, we achieved a dramatic improvement to an AUC of 0.88.
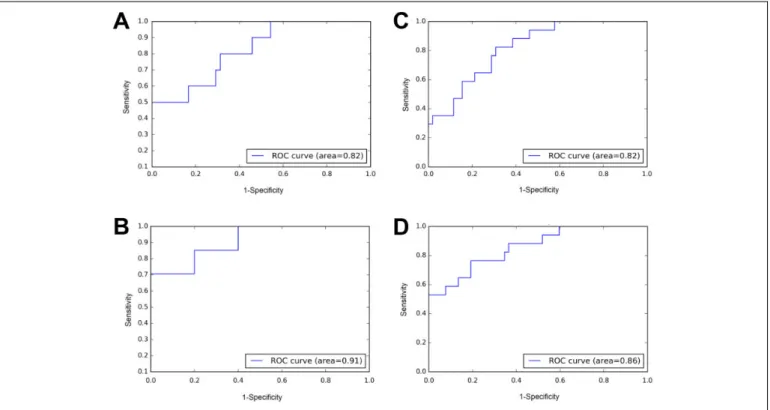
Figure 5 demonstrated the improvement of AUC by con-sidering the difference in score scale across the zones. Only 2 zones were shown for simplicity. For lesions in PZ zone and AS zone, the model achieves AUC of 0.82 and 0.91, respectively (Figure 5A-B). If we simply combine the scores from 2 zones, we got ROC curve shown in Figure 5C with AUC of 0.82. However, if we transform the scores follow-ing equation 2 before combinfollow-ing, an AUC of 0.86 can be obtained (Figure 5D).
With the model tuning and postprocessing, we were able to achieve an AUC of 0.90 on the validation data set for all lesions combined for model 1 and an AUC of 0.86 for model 2. Figure 3.Effect of bias field correction of MRI image. (A) Original image (B) bias-field corrected. The intensity variation in (A) is greatly reduced in (B).
Figure 4.Example of improvement of area under the curve (AUC) from ensembling. A, Receiver operating characteristics (ROC) for anterior fibromuscular stroma (AS) lesions in validation data set without ensembling. B, ROC for same lesions with ensembling. The AUC increased from 0.80 to 0.88.
After the hyperparameter for the DCNN model, as well as the postprocessing step was finalized with the validation data set, the model was retrained with the validation data set included as training data. The trained model was applied to the test data set, with the same ensembling and score transforma-tion. The final prediction scores on the test data set were sub-mitted to organizers. Figure 6 shows the ROC curve achieved
by our models on the test set. Model 2 (solid line) produces slightly better AUC value (0.83) than model 1 (0.81). The AUC of 0.83 is the third best score of the competition, behind 0.87 and 0.84 achieved by top 2 teams.
Discussion
The mpMRI images are quite different in appearance from the photos of various natural objects in the ImageNet data set. Therefore, it came as a pleasant surprise that our transfer learn-ing from ImageNet models performed very well for the medical mpMRI images. Based on the information provided by organi-zer, it also outperforms all those submissions that used radio-mics.44 Our understanding is that the bottom layers of the DCNN act as a feature extractor while the top layers of the DCNN act as a classifier. The reason that DCNN-based approach generally outperforms radiomics approach is that the radiomics uses hand-crafted features which is limited, whereas DCNN can generate features that are most appropriate to the problem. The only drawback of the DCNN approach is that when the training data set is very limited, the features learned from training data may not be better than handcrafted features selected by human after seen a lot more training cases from many years of practice. As the ImageNet pretrained models outperformed human in the classification task, we believe that these models had extracted a greater variety of image features than human vision. By freezing the bottom layers, we avoided the problem of feature construction with very limited data and Figure 5.Rescale score from different zone to maximize area under the curve (AUC). A, Receiver operating characteristics (ROC) for peripheral zone (PZ) lesions in validation dataset. B, ROC for anterior fibromuscular stroma (AS) lesions in validation dataset. C, ROC of a simple combine. The AUC is 0.82. D, ROC of scaling AS score before combining with PZ. The AUC is 0.86.
Figure 6.Receiver operating characteristics (ROC) curve for the test data set achieved by our models.
focus directly on the classifier. The good performance on our approach seems to indicate that although the medical images have different visual appearance as everyday objects in Ima-geNet, the image features (eg, contrast, size) that radiologists rely on to read medical images are also used in the everyday objects recognition. Note that while we believed that the pro-vided data are not enough to train a CNN from scratch, the top 2 scorers all trained their network from scratch without employ-ing the transfer-learnemploy-ing approach.29,45,46It is possible that by transfer learning from ImageNet, we did not pick some subtle details that only exist in MRI images. However, the small difference in score indicated that it does not cause a major issue. There are many other studies that do demonstrate advan-tage of transfer learning over training from scratch approaches.41,42,47,48 Therefore, it may also be that the small differences with the top performers were due to our training and were not fully tuned rather than the use of transfer-learning approach. We believe that the transfer-learning technique can be applied to other classification problems related to medical images.
It has been reported that radiologist following PI-RADS can achieve an AUC of 0.81 to 0.84 on detecting malignant prostate cancer.19,49,50It seems that our DCNN model achieves similar performance despite seeing only 330 cases with only 76 malig-nant cases. While the radiologist-like performance is already satisfactory, we believe that there is more room to improve. Although we were provided 330 cases for training, there were only 76 malignant examples. Due to the malignant lesion hav-ing different appearance in different prostate zones, we have to group the lesions by prostate zones and train them separately. Therefore, the training data for individual prostate zones were further reduced. For TZ lesions, only 9 malignant lesions were provided for training. As a result, only 1 to 3 malignant lesions were in the validation data set. It is very likely that this limited training data set did not adequately represent the variety of lesion in the test data set, resulting decreased model perfor-mance. In addition, since the model was tuned on the validation data set performance, the final model may over-fit the valida-tion data set. Using K-fold validavalida-tion strategy can mitigate this issue partially. This could be one of the factors why our model 2 produced better result. We believe that with more training data, the performance of the DCNN models can be further improved. However, it remains to be seen what kind of perfor-mance is achievable if we have enough training data that covers the variety of lesion appearance seen in clinical practice.
Machine learning and especially deep learning is highly susceptible to the problem of overfitting. For improperly designed studies, a common pitfall is to select the methods that demonstrated the best performance on the test data set. This process would actually over-fit the test data set. For our study, the challenge organizer did not release the ground truth for the test data set. While this arrangement prevented us from per-forming further analysis of the results as well as in-depth com-parison between models, it also ensured that the AUC score achieved was trustworthy. However, as the data came from a single institution in the current study, it is expected that the
trained model may produce worse results on data from other institutions. While we implemented preprocessing steps to nor-malize data, these steps may not be sufficient to fully account for the variety of MRI images in different clinical settings. Further works are needed to study the performance degradation on the data from a different institution and strategies to mitigate this issue.
Conclusion
In this study, we implemented a DCNN method for prostate lesion classification on mpMRI images. Specifically, we used a transfer-learning approach where ImageNet pretrained DCNN models were retuned on the mpMRI lesion image patches. Our approach achieved the third best score in the prostateX com-petition. This result suggests that the transfer-learning from ImageNet pretrained DCNN model has strong potential in working with mpMRI images and likely other medical image modalities as well.
Acknowledgments
Authors would like to thank ProstateX challenge organizers for orga-nize the challenge and provide data, in particular Dr Karen Drukker from University of Chicago for providing the ROC curves generated from our submission. Authors also would like to thank Drs Xiao Li and Qing Zou from Affiliated Cancer Hospital of Nanjing Medical University for valuable discussion.
Authors’ Note
This study involves no animals or human participants. Part of this work has been presented on 2017 SPIE and 2017 AAPM annual conference.
Declaration of Conflicting Interests
The author(s) declared no potential conflicts of interest with respect to the research, authorship, and/or publication of this article.
Funding
The author(s) received no financial support for the research, author-ship, and/or publication of this article.
ORCID iD
Quan Chen, PhD, DABR, https://orcid.org/0000-0001-5570-2462
References
1. Siegel RL, Miller KD, Jemal A. Cancer Statistics, 2017.CA Can-cer J Clin. 2017;67(1):7-30.
2. Global Burden of Disease Cancer C; Fitzmaurice C, Allen C, et al. Global, regional, and national cancer incidence, mortality, years of life lost, years lived with disability, and disability-adjusted life-years for 32 cancer groups, 1990 to 2015: a systematic analysis for the Global Burden of Disease Study.JAMA Oncol. 2017;3(4): 524-548.
3. Mettlin C, Jones G, Averette H, Gusberg SB, Murphy GP. Defin-ing and updatDefin-ing the American Cancer Society guidelines for the cancer-related checkup: prostate and endometrial cancers.CA Cancer J Clin. 1993;43(1):42-46.
4. Schroder FH, Hugosson J, Roobol MJ, et al. Screening and prostate-cancer mortality in a randomized European study.N Engl J Med. 2009;360(13):1320-1328.
5. Wilt TJ, MacDonald R, Rutks I, Shamliyan TA, Taylor BC, Kane RL. Systematic review: comparative effectiveness and harms of treatments for clinically localized prostate cancer. Ann Intern Med. 2008;148(6):435-448.
6. Pinsky PF, Prorok PC, Yu K, et al. Extended mortality results for prostate cancer screening in the PLCO trial with median follow-up of 15 years.Cancer. 2017;123(4):592-599.
7. Catalona WJ, Richie JP, Ahmann FR, et al. Comparison of digital rectal examination and serum prostate specific antigen in the early detection of prostate cancer: results of a multicenter clinical trial of 6,630 men.J Urol. 1994;151(5):1283-1290.
8. Schroder FH, van der Cruijsen-Koeter I, de Koning HJ, Vis AN, Hoedemaeker RF, Kranse R. Prostate cancer detection at low prostate specific antigen.J Urol. 2000;163(3):806-812.
9. Brawer MK, Chetner MP, Beatie J, Buchner DM, Vessella RL, Lange PH. Screening for prostatic carcinoma with prostate spe-cific antigen.J Urol. 1992;147(3 Pt 2):841-845.
10. Stroumbakis N, Cookson MS, Reuter VE, Fair WR. Clinical sig-nificance of repeat sextant biopsies in prostate cancer patients.
Urology. 1997;49(3A Suppl):113-118.
11. Hoeks CM, Barentsz JO, Hambrock T, et al. Prostate cancer: multiparametric MR imaging for detection, localization, and sta-ging.Radiology. 2011;261(1):46-66.
12. Siddiqui MM, Rais-Bahrami S, Turkbey B, et al. Comparison of MR/ultrasound fusion-guided biopsy with ultrasound-guided biopsy for the diagnosis of prostate cancer.JAMA. 2015;313(4):390-397. 13. Schoots IG, Petrides N, Giganti F, et al. Magnetic resonance
imaging in active surveillance of prostate cancer: a systematic review.Eur Urol. 2015;67(4):627-636.
14. Schoots IG, Roobol MJ, Nieboer D, Bangma CH, Steyerberg EW, Hunink MG. Magnetic resonance imaging-targeted biopsy may enhance the diagnostic accuracy of significant prostate cancer detection compared to standard transrectal ultrasound-guided biopsy: a systematic review and meta-analysis.Eur Urol. 2015; 68(3):438-450.
15. Weinreb JC, Barentsz JO, Choyke PL, et al. PI-RADS prostate imaging – reporting and data system: 2015, version 2.Eur Urol. 2016;69(1):16-40.
16. Barentsz JO, Richenberg J, Clements R, et al. ESUR prostate MR guidelines 2012.Eur Radiol. 2012;22(4):746-757.
17. Lin WC, Westphalen AC, Silva GE, Chodraui Filho S, Reis RB, Muglia VF. Comparison of PI-RADS 2, ADC histogram-derived parameters, and their combination for the diagnosis of peripheral zone prostate cancer.Abdom Radiol (NY). 2016;41(11):2209-2217. 18. Seo JW, Shin SJ, Taik Oh Y, et al. PI-RADS version 2: detection of clinically significant cancer in patients with biopsy Gleason score 6 prostate cancer.AJR Am J Roentgenol. 2017;209(1):W1-W9. 19. Kasel-Seibert M, Lehmann T, Aschenbach R, et al. Assessment of
PI-RADS v2 for the detection of prostate cancer.Eur J Radiol. 2016;85(4):726-731.
20. Lee CS, Nagy PG, Weaver SJ, Newman-Toker DE. Cognitive and system factors contributing to diagnostic errors in radiology.AJR Am J Roentgenol. 2013;201(3):611-617.
21. Fehr D, Veeraraghavan H, Wibmer A, et al. Automatic classifi-cation of prostate cancer Gleason scores from multiparametric magnetic resonance images.Proc Natl Acad Sci U S A. 2015; 112(46): E6265-E6273.
22. Stoyanova R, Pollack A, Takhar M, et al. Association of multi-parametric MRI quantitative imaging features with prostate can-cer gene expression in MRI-targeted prostate biopsies.
Oncotarget. 2016;7(33):53362-53376.
23. Litjens G, Debats O, Barentsz J, Karssemeijer N, Huisman H. Computer-aided detection of prostate cancer in MRI.IEEE Trans Med Imaging. 2014;33(5):1083-1092.
24. Krizhevsky A, Sutskever I, Hinton GE. Imagenet classification with deep convolutional neural networks. Paper presented at: advances in neural information processing systems, 2012. 25. LeCun Y, Bengio Y, Hinton G. Deep learning. Nature. 2015;
521(7553):436-444.
26. Gulshan V, Peng L, Coram M, et al. Development and validation of a deep learning algorithm for detection of diabetic retinopathy in retinal fundus photographs.JAMA. 2016;316(22):2402-2410. 27. Esteva A, Kuprel B, Novoa RA, et al. Dermatologist-level
clas-sification of skin cancer with deep neural networks.Nature. 2017; 542(7639):115-118.
28. Liu Y, Gadepalli K, Norouzi M, et al. Detecting cancer metastases on Gigapixel pathology images.ArXiv e-prints. 2017;1703. http:// adsabs.harvard.edu/abs/2017arXiv170302442 L Accessed March 1, 2017.
29. Armato SG, Huisman H, Drukker K, et al. PROSTATEx Chal-lenges for computerized classification of prostate lesions from multiparametric magnetic resonance images.J Med Imaging (Bel-lingham). 2018;5(4):044501.
30. Hornik K, Stinchcombe M, White H. Multilayer feedforward net-works are universal approximators.Neural Networks. 1989;2(5): 359-366.
31. Simonyan K, Zisserman A. Very deep convolutional networks for large-scale image recognition.ArXiv e-prints. 2014;1409. http:// adsabs.harvard.edu/abs/2014arXiv1409.1556 S Accessed Sep-tember 1, 2014.
32. Russakovsky O, Deng J, Su H, et al. ImageNet large scale visual recognition challenge.Int J Comput Vision. 2015;115(3):211-252. 33. Szegedy C, Liu W, Jia Y, et al.Going deeper with convolutions. Paper presented at: proceedings of the IEEE conference on com-puter vision and pattern recognition, 2015.
34. Szegedy C, Vanhoucke V, Ioffe S, Shlens J, Wojna Z. Rethinking the inception architecture for computer vision. ArXiv e-prints. 2015;1512. http://adsabs.harvard.edu/abs/2015arXiv151200567 S Accessed December 1, 2015.
35. Kohavi R. A study of cross-validation and bootstrap for accuracy estimation and model selection. Paper presented at: Ijcai1995. 36. Krogh A, Vedelsby J. Neural network ensembles, cross
valida-tion, and active learning. Paper presented at: Advances in neural information processing systems, 1995.
37. Nyu´l LG, Udupa JK. On standardizing the MR image intensity scale.image. 1999;42(6):1072-1081.
38. Nyu´l LG, Udupa JK, Zhang X. New variants of a method of MRI scale standardization.IEEE T Med Imaging. 2000;19(2):143-150.
39. Yoo TS, Ackerman MJ, Lorensen WE, et al. Engineering and algorithm design for an image processing API: a technical report on ITK-the insight toolkit.St Heal T. 2002;85:586-592. 40. Tustison NJ, Avants BB, Cook PA, et al. N4ITK: improved N3
bias correction.IEEE T Med Imaging. 2010;29(6):1310-1320. 41. Shin HC, Roth HR, Gao M, et al. Deep convolutional neural
net-works for computer-aided detection: CNN architectures, dataset characteristics and transfer learning. IEEE Trans Med Imaging. 2016;35(5):1285-1298.
42. Huynh BQ, Li H, Giger ML. Digital mammographic tumor clas-sification using transfer learning from deep convolutional neural networks.J Med Imaging. 2016;3(3):034501-034501.
43. Carneiro G, Nascimento J, Bradley AP.Unregistered multiview mammogram analysis with pre-trained deep learning models. Paper presented at: International Conference on Medical Image Computing and Computer-Assisted Intervention, 2015.
44. Kwon D, Reis IM, Breto AL, et al. Classification of suspicious lesions on prostate multiparametric MRI using machine learning.
J Med Imaging. 2018;5(3):034502.
45. Liu S, Zheng H, Feng Y, Li W.Prostate cancer diagnosis using deep learning with 3D multiparametric MRI. Paper presented at: Medical Imaging 2017: Computer-Aided Diagnosis, 2017. 46. Seah JC, Tang JS, Kitchen A.Detection of prostate cancer on
multiparametric MRI. Paper presented at: Medical Imaging 2017: Computer-Aided Diagnosis, 2017.
47. Kermany DS, Goldbaum M, Cai W, et al. Identifying medical diagnoses and treatable diseases by image-based deep learning.
Cell. 2018;172(5):1122-1131. e1129.
48. Litjens G, Kooi T, Bejnordi BE, et al. A survey on deep learning in medical image analysis. Med Image Anal. 2017; 42:60-88.
49. Junker D, Schafer G, Edlinger M, et al. Evaluation of the PI-RADS scoring system for classifying mpMRI findings in men with suspicion of prostate cancer.Biomed Res Int. 2013;2013: 252939.
50. Polanec S, Helbich TH, Bickel H, et al. Head-to-head comparison of PI-RADS v2 and PI-RADS v1. Eur J Radiol. 2016;85(6): 1125-1131.