and
Menon, Varun G
and
Bashir, Ali Kashif
(2020)A Parallel Military Dog
based Algorithm for Clustering Big data in Cognitive Industrial Internet of
Things. IEEE Transactions on Industrial Informatics. p. 1. ISSN 1551-3203
Downloaded from:
http://e-space.mmu.ac.uk/625896/
Version:
Accepted Version
Publisher:
Institute of Electrical and Electronics Engineers (IEEE)
DOI:
https://doi.org/10.1109/tii.2020.2995680
Please cite the published version
A Parallel Military Dog based Algorithm for
Clustering Big data in Cognitive Industrial Internet
of Things
Ashish Kumar Tripathi, Kapil Sharma,
Member, IEEE, Manju Bala, Akshi Kumar,
Member, IEEE,
Varun G Menon,
Senior Member, IEEE, Ali Kashif Bashir,
Senior Member, IEEE
Abstract—With the advancement of wireless communication, internet of things, and big data, high performance data analytic tools and algorithms are required. Data clustering, a promising analytic technique is widely used to solve the IoT and big data based problems, since it does not require labeled datasets. Recently, meta-heuristic algorithms have been efficiently used to solve various clustering problems. However, to handle big data sets produced from IoT devices, these algorithm fail to respond within desired time due to high computation cost. This paper presents a new meta-heuristic based clustering method to solve the big data problems by leveraging the strength of MapReduce. The proposed methods leverages the searching potential of military dog squad to find the optimal centroids and MapReduce architecture to handle the big data sets. The optimization efficacy the proposed method is validated against 17 benchmark functions and the results are compared with 5 other recent algorithms namely, bat, particle swarm optimization, artificial bee colony, multiverse optimization, and whale optimization algorithm. Fur-ther, a parallel version of the proposed method is introduced using MapReduce (MR-MDBO) for clustering the big datasets produced from industrial IoT. Moreover, the performance of MR-MDBO is studied on 2 benchmark UCI datasets and 3 real IoT based datasets produced from industry. The F-measure and computation time of the MR-MDBO is compared with the 6 other state-of-the-art methods. The experimental results witness that the proposed MR-MDBO based clustering outperforms the other considered algorithms in terms of clustering accuracy and computation times.
Index Terms—Optimization, benchmark, clustering, big data, industrial IoT.
I. INTRODUCTION
The rapid advances in the Internet of Things (IoT) to provide smart services to the people is the trending research area in the last few years. On the same footprints, industrial IoT system is also working to make smart factories by enabling structural health monitoring, remote diagnosis, condition mon-itoring, and automation of various services [1] [2]. Meanwhile,
Ashish Kumar Tripathi is with the Department of CSE, Malviya National Institute of Technology, Jaipur, India. (e-mail:[email protected])
Kapil Sharma is with Department of IT, Delhi Technological University, India. (e-mail: [email protected]).
Manju Bala is with Department of CSE, IP College Of Women, India. (e-mail: [email protected]).
Akshi Kumar is with Department of CSE, Delhi Technological University, India. (e-mail: [email protected])
Varun G Menon is with Department of CSE, SCMS School of Engineering and Technology, Ernakulam, India. (e-mail: [email protected])
Ali Kashif Bashir is with Department of Computing and Mathe-matics, Manchester Metropolitan University, United Kingdom. (e-mail: [email protected])
industrial IoT comes with a number of challenges for making smart, reliable, and optimized system [3] [4]. Large number of sensors are deployed in the industries to collect the streaming and high volume data [5]. Generally, the data produced from these sensors is huge, streaming and unstructured. To analyze such high volume and streaming data is a challenging issue. Moreover, the streaming data arriving from the sensors is also time depended, which may loose the patterns over the time [6]. The efficient analysis of such data is a prominent part for the smart industries, as it may improve the services and reduce the risks involved in the different processes. The timely and efficient analysis of the information such as humidity, temperature, pressure and gas composition collected from large number of sensors can mitigate the chances of abnor-malities. However, the traditional data analysis techniques can not handle such data sets due to limited memory and processing unites [7]. Therefore, for the efficient analysis of big industrial data sets, advanced tools and algorithms are required. Data clustering is an efficient unsupervised method of data analysis. Generally, the data generated from the sensors is not labeled, therefore clustering is a promising tool for such systems [8]. In the recent years, meta-heuristic based clustering methods have been efficiently used for solving the clustering problem due to their ability to avoid local optima [9]. Generally, meta-heuristics are used for optimization of real world problems, where traditional methods are not able to respond in the polynomial time. These algorithms starts with random set of solution in search space to find the optima in defined time interval. However, No Free Lunch theorem proves that there exists no algorithm, which can be efficiently applied for all kind of problems [10]. Therefore, a number of meta-heuristic based methods have been developed in the literature for unfolding various real world problems. Moreover, the existing sequential algorithms are not suitable to cope with high computation cost of big data sets. To remedy this challenge, in this paper, a novel meta-heuristic algorithm is introduced which mimics the searching process of suspicious objects by the trained military dog squad. Military dogs have the high smell senses, by which they can search any object like bomb, body, blood or currency. They may sense the object in the range of 200 meters by their smell power in the absence of wind. However, with the wind factor, the same can go up to 1000 meters depending the direction and speed of the wind. Moreover, some other factors such as vegetation may deviate the direction of sound or smell. In this paper, the ability of the
trained military dogs is leveraged to find the optimal centroids in clustering big data produced by industrial IoT. The major contribution of this paper is summarized as follows.
1) A novel meta-heuristic based clustering method is in-troduced, which can handle the complexities of big industrial IoT based datasets. The mathematical model of the proposed meta-heuristic is presented. Further, the optimization efficacy of the proposed algorithm is vali-dated against 17 benchmark functions and performance is evaluated in term of 2 parameters namely, mean fitness value and standard deviation.
2) The benchmark function results are compared with 5 existing state-of-the-art meta-heuristics namely, particle swarm optimization (PSO) [11], bat algorithm (BA) [12], artificial bee colony optimization (ABC) [13], multiverse optimization (MVO) [14], and whale opti-mization algorithm (WOA) [15].
3) For efficient clustering of big datasets generated from industrial IoT, a parallel version of the proposed algo-rithm is introduced and named MR-MDBO.
4) The performance of MR-MDBO is validated on 2 bench-mark UCI datsets and 3 real datasets produced from industrial IoT. The results are compared against six MapReduce based state-of-the-art clustering algorithms namely, MR-KPSO [11], improved PSO [16], DFBP-KBA [17], MR-ABC [18], and MR-EGWO [19]. Rest of the paper is presented as follows. Section II dis-cusses the related work. Section III introduces the mathemat-ical model of the proposed algorithm. Section IV presents parallel MDBO model using MapReduce. Section V provides the experimental results. Finally, the conclusion and future work is elucidated in section VI.
II. RELATEDWORK
A. Big data in cognitive IoT: Opportunities and challenges
In the first decade of IoT from 2009 to 2018, several mature products have been introduced to develop the IoT based systems, containing sensors, cloud platform, and big data analytic systems [20] [21]. Now a days, we are in the second decade of IoT, where the novel techniques for the data analysis produced from the IoT based systems are essential research topics [22] [23]. Meanwhile, the industrial IoT comes with a number of challenges, for smart control and management of high volume and unstructured data, produced from IoT based devises and sensors [23] [24]. For the same, researchers are working to develop efficient methods for analyzing data produced from IoT. Recently, some techniques and frameworks for the big data analysis have been introduced for the industrial applications [21]. Cao et al. [25] presented an outlier detection framework for the big streaming data. Rosa et al. [26] introduced a non parametric approach for the classification of industrial data. Fong et al. [6] introduced a lightweight particle swarm based feature selection method for the streaming big data analysis. Zhang et al. [1] introduced incremental CFS algorithm for clustering the big data in industrial IoT. Subsequently, Yuan et al. [16] introduced spark based improved particle swarm optimizer for the anomaly data
mining in mass sensor networks. However, in the last few years, the data mining challenges of IoT based problems have been research trend [3]. Some meta-heuristic based algorithms are introduced in the literature for solving the computationally complex problems using MapReduce. However, for the IoT based framework, no study have been perform in the literature. To bridge this gap, a novel MDBO based algorithm have been introduced in this work for clustering big data in industrial IoT.
B. Challenges of Meta-heuristic based clustering
Producing acceptable solutions in a reasonable time is one of the key challenge for the meta-heuristic algorithms. Resources like memory have always been a concern, an algorithm is efficient if it uses the resources in an optimized way and always maintains a trade-off between time and space complexity.
At present, due to the tremendous growth in industrial data, the complexity of real-world problems related to optimization tasks in the smart industries has been also increased. The conventional meta-heuristic computation is facing new chal-lenges due to computation intensive objective functions. To mitigate these concerns, nowadays, researchers are working with parallel and distributed meta-heuristic computation [27]. A number of platforms are available for solving the computation-intensive problems using distributed meta-heuristic computation, such as CUDA, GPU, and MapReduce based programming. MapReduce is an open source parallel computation framework, that has been successfully utilized for the parallel computations of meta-heuristics algorithms for managing large-scale and streaming datasets [28], [29]. In the last one decade, Hadoop and MapReduce based model for parallel processing have been used by a number of researchers for solving complex real-world problems. Thus, in this paper Hadoop and MapReduce programming framework is leveraged for the parallel processing of the complex dataset produced from industrial internet of things.
III. MILITARYDOGSQUAD BASEDOPTIMIZATION
This section details the behavior and mathematical model of the trained military dogs for finding the optimal solution in the predefined search space. Military dogs undergo hard training through special training coaches, where they learn to search any suspicious object using their strong smell sense. A rigorous training is performed to train them for working in team. Military dogs uses barking to pass message to each other. They cooperate each other by passing the message, by different ways of barking and loudness. The way of barking and loudness represents some specific message and loudness helps them to identify the distance from the suspicious object. When a trained military dog squad is left for finding the suspicious object in a tertiary, it start searching the area randomly. Military dogs make a move in the area, using their smell sensation and barking sound from other dogs of the squad. Each military dog defines its fitness value in terms of loudness. The loudest barking represents the best fitness value, as it is assumed to be closest from the target object. Further,
each military dog uses scent smell to reach close to the target object which represents the exploitation phase of the MDBO. However, they also take moves based on the loudness of any randomly chosen dog, which helps to explore the search space and avoid the local optima.
A. MDBO Definitions and Algorithm
To design an efficient algorithm, the searching behavior of trained military dog squad is mathematically modeled. This section presents the definitions and mathematical model of trained military dog squad. First, the formal definitions of MDBO are presented. Thereafter, the complete MDBO algorithm is explained. In the following definitions, the set of empty numbers and real numbers is represented withϕand
R respectively, whereas, the set of integers is represented by
Z.
Definition 1:M DSN :; is defined as military dog squad of
N trained military dog. The value ofN in the squad remains constant with time. In future, the value of N can be variable for the further improvements.
Definition 2: M DSI : M D → R :; represents the military dog smell index. It is defined as the closeness of a M Dwith the target object. In other meta-heuristic based algorithms, this factor is commonly known as fitness of individual.
Definition 3:F SVd; is a feasibility solution vector, which
de-notes the position of a trained military dog in the military dog squad. Further,F SV ∈Rdis a set of all real numbers which represents the position of a military dog in dthdimension.
Def inition4 : Sniffing movement δ(p, Pm,) : M D →
M D; represents an operator, which modifies the F SVd of military dogs randomly, based on theM DSIof fittest military dog. Pm is the movement probability, which controls the
movement of a military dog. The mathematical model of sniffing movement is defined by the following equation.
F SVij(i+ 1) = { F SVloudestj , p≤Pm F SVij+R(0,1)×mstep(i), p > Pm (1) where, mstep(i) =W C×R(0,1)×(F SVij−F SVloudestj ) R(0,1)is any randomly chosen number between 0 and 1.W C
is a wind constant and pis any randomly generated number in the range (0,1).
Definition 5: ω(Pm, X, α) :M Dn → MD; is an operator
which defines the barking movement of the military dog. The barking movement of a trained military dog is controlled by
F SVd of fittest dog and it is also induced by any randomly
chosen military dog.X∈(1,2,3..., d)is the randomly chosen index and Pm is the movement probability which remains
constant. Further, α is the vegetation or smog factor which may effect the intensity of the sound in the air. The barking movement modifies the feasible solution vector (F SVd) of a military dog, which is defined as follows:
F SVij(i+ 1) =
{
F SVij(i), p≤α
F SVij(i) +Bm×R(0,1), p > α
(2)
whereBm= (F SVloudest−F SVq)andR(0,1)represents
a random number in the range (0,1).
Definition 6: The transition functionϕ= (m, d, δ, ω, Pm) :
M Dm→M Dm; represents a 5-tupleM DS transition
func-tion, which updates theM DS in each iteration. It starts with the computation ofF SVd andM DSI. Further, modification
operator is applied on each M D of M DS and the M DSI
value is redefined.
Definition 7: Finally, MDBO algorithm is defined as three tuple, M DBO = (H, ϕ, T), which obtains the solution for any optimization function. The initial population is generated using function H :→ {M Dn, M DSIn}, and corresponding
M DSIis calculated.ϕis aM DStransition function defined earlier. H generates the F SV of each military dog in the specified search space.T :M Dn→ {true, f alse}represents
the termination criterion of the algorithm.
The complete procedure of the MDBO is described with the following steps.
1) In the first step, all the parameters ofM DBOalgorithm are initialized. A method is derived to map the problem to F SVd and M DS as defined in definition 1 and 2.
This process is dependent on the nature of problem. Further, the maximum population size (military dogs), movement probability Pm, vegetation constant α, and
wind factor W are fixed as per the nature of the optimization function.
2) In the second step, the position (F SV) of eachM D in the search space is initialized according to the search boundaries defined in the optimization problem. This process is performed by the H operator explained in definition 7.
3) Sniffing movement (exploitation step): Further, each
M Dredefines itsF SV which is influenced by the fittest (loudest barking) military dog in the squad. During the search, eachM Dmakes a random walk and look around the location.M Dapproaches the target object using the smell sensation.M Dmay take move towards the loudest barking dog with probability Pm. In the other case, it
may take random move influenced by loudest baking dog.
The complete pseudocode of the sniffing movement is defined as follows: for(i= 1to N)do W =rand(0,1) IF(W < Pm) F SVij(i+ 1) =F SVloudestj step(i) =W C×R(0,1)×(F SVij−F SVloudestj ); F SVij(i+ 1) =F SVij+R(0,1)×step(i) end for
4) After the sniffing movement, barking movement is per-formed to explore the search space. Generally, it is observed that military dogs bark loud, where they sense any suspicious object. This barking sound makes a global movement, as other military dogs follow the loudest barking dog. Each military dog makes a move-ment, according to the fittest (loudest) one, and any other randomly chosen barking dog from the squad. The
TABLE I: Ranking of the considered algorithms using Fried-man Test
Parameter Name PSO Bat ABC MVO WOA MDBO
Rank 6 5 4 3 2 1
Mean Rank 5.52 4.50 4.20 3.46 2.82 1.32
F SV of each military dog is redefined by the barking movement, which is explained as follows.
The complete pseudocode for barking movement is presented as follows: for(i= 1to N)do K=rand(0,1) S=IF(K < α) F SVi(i+1)=F SVi(t) +Bm×S Bm=rand∗(F SVloudest−F SVq); end for
5) Start the next iteration from step 3. This loop is con-tinued until the maximum number of iterations are not reached, or the required solution is achieved. This step implements the T operator as explained in definition 6.
B. MDBO based clustering
In the MDBO based clustering, the F SV of each military dog denotes a set of centroids,C={C1, C2,· · ·, CM}forM
number of clusters. The M DSI value represents the fitness (squired Euclidean distance) ofM D as shown in Eq. (3).
SED(N, M) = N ∑ i=1 M ∑ j=1 Wij |Zi−Cj| (3)
Where, M represents the umber of cluster, N denotes the number of data items, | Ni −Cj | presents the Ecludian
distance between Ith data point Jth center. Subsequently,
Wij is an association weight corresponding to ith vector in
jth cluster. The value ofW
ij is 1, if ith data point belongs
to jth cluster, else it is set as 0. In the clustering process,
each solution is represented by aF SV, which represents the position of M D in the search space. The algorithm starts by randomly generating N random F SV s, where N is the size ofM DS. TheF SV of eachM D is updated in each iteration to improve the M DSI value. Finally, after the termination criteria is reached, theF SV corresponding to the fittestM Dis returned which represents the position of final cluster centers.
Algorithm 1 :Map Function
Input:Key−RecordID, V alue−Record. Output:Key-MD-ID, Value-Minimum distance Map (Key : dataId, Value : data)
MD-ID = read ( file ); foreach MD in MDSdo
MD-ID = read(MD-ID);
Centroid =read(centroids) // FSV represents the location of centroids
Min-D= getMinD(record, Centroid ); //getMinD returns centroid nearest to the record
centroid-ID = i //index of the centroid with minimum distance new-key = MD-ID+centroid-ID;
end for
write (new-key, Min-D);
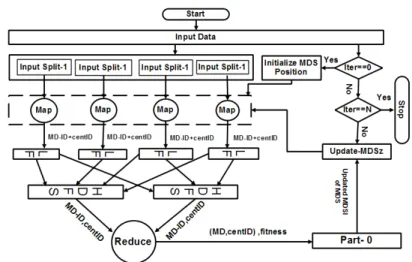
Fig. 1: Model of parallel MDBO for data clustering
Algorithm 2 :Reduce Function
Input:Key−(M D−Id, centroid−ID), V alue−(M in−Distance) Output:MD-ID, Value-MD-fitness // sum of intra-cluster distance
Reduce (Key:MD-Id, centroid-ID, Value-list: Min-Distance) // value contains list of distances of data point from their nearest centroids
Initialization MD-fitness=0
foreach distance in Min-Distance listdo MD-fitness=sum-Dist+distance end for
Update the positions of MD write(key, MD-fitness)
IV. PARALLELMDBOFORIOTBASEDINDUSTRIALBIG
DATACLUSTERING
In this section, parallel model of MDBO algorithm us-ing Hadoop MapReduce is explained. In MapReduce based MDBO (MR-MDBO), two main operations are performed namely, updating of the cluster centroid and the MDSI compu-tation, which represents the fitness of the clustering solution. In the proposed algorithm for data clustering, the centroid of the clusters are updated according to MR-MDBO with the purpose of minimizing sum of the squared Euclidean distance. The complete MapReduce architecture of the MDBO for the clustering of large datasets is shown in Fig. 1. As shown in Fig., first the dataset is divided into smaller data blocks called input split. In the first iteration of the algorithm, population of the MR-MDBO is initialized and supplied to each mapper running on the different nodes. In the clustering process using MR-MDBO, the main computation intensive task is to compute the sum of the squared Euclidean distance. The MapReduce model is thus employed to compute the fitness value. Each iteration of MR-MDBO runs in two phases called MR-MDBO-Map and MR-MDBO-Reduce. In the proposed MDBO, the task of fitness computation is done in the MR-MDBO-Map phase, in which parallelism is achieved, since each machine have only some fraction of the whole dataset. As shown in in Algo 1, the MR-MDBO-Map function starts with extracting the centroids of each cluster from the population which is stored in the HDFS (hadoop distributed file system). The MR-MDBO-Map function then retrieves F SV vector of a military dog that represents location of the centroids.
Further, the distance of centroid is calculated with each data object and minimum distance along with itscentroid−IDis returned. The MR-MDBO-Map function writes (M D−ID,
centroid−ID) as the new key and the data point is written as the new value. After the completion of the MR-MDBO-Map phase, output of all the mappers are merged and grouped by keys.
In the MR-MDBO-reduce phase, the reduce function is called on each key, value pair generated by the MR-MDBO-Map phase. The reducer function aggregates all the values with the identical key’s to compute the fitness value that we aim to minimize. The main function of the MR-MDBO-map is to decompose the task and that is merged by the MR-MDBO-reduce phase. Finally, as shown in the Algo. 2 the MR-MDBO-reduce function computes the sum of the squared Euclidean distance between each data object and the respective cluster centroids. The newly computed fitness value is used to update theF SV
of the military dog squad in the next iteration. The whole MapReduce cycle is repeated and this process continue until the stopping criterion or maximum iterations are not reached. Algo. 2 presents the Pseudo-code of the MR-MDBO-reduce function.
The time complexity of MR-MDBO based clustering is proportional to the number of data points, number clusters, and number of dimensions in the dataset. In the MR-MDBO based clustering, the optimal cluster centroids are generated with O(N×K×D×I)operations, whereN,K,D, andIrepresents the number of data points, number of clusters and number of dimensions, and number of iterations respectively. For M
number of agents, the time complexity of the MR-MDBO based clustering can be represented as O(M×N×K×D×I).
V. PERFORMANCEANALYSIS ANDRESULTS
The performance analysis of MDBO is presented in two folds. First, the optimization ability of MDBO is vindicated against 17 standard benchmarks. The results are are detailed in section V-A. Second, the clustering ability of MDBO is validated against big data sets produced from industries, and the results are presented in section V-A3.
A. Benchmark Function Results
This section presents the optimization efficacy and unique-ness of MDBO. For the fair compression, seventeen bench-mark functions are used, and the results are presented in terms of mean and standard deviation of the fitness value. Further-more, Wilcoxon rank sum and FriedMan’s test of MDBO is performed with the other algorithms, which validates the dissimilarity of MDBO and other considered algorithms. Each algorithms is run on system with 3.0 Ghz frequency, Intel (R) core(TM) i7 processor and 16 GB RAM with Matlab 2015a.
1) Comparison with existing algorithms: The proposed MDBO is first tested on benchmark functions to validate the optimization efficacy. Table II presents the detail of each benchmark function, including name, and category (Uni-model or Multi-model). Among seventeen benchmark functions, nine are the uni-model, whereas rest eight function belong to multi-model class. Generally, uni-model functions are used to
validate the convergence rate whereas, multi-model functions are used to test the ability of local optima avoidance. The optimal value for each benchmark function is defined as 0. The parameter values of each algorithm as taken from the respective literature. Furthermore, each algorithm is run thirty times to obtain the mean and standard deviation of the fitness value. Table III presents the results on each benchmark function in terms of mean and the standard deviation. It is observed from the Table III that MDBO outperformed five other state-of-the-art existing algorithms on 17 considered benchmark functions in terms of mean of the fitness value. However, on one function i.e F6, WOA has shown competitive results. Moreover, in terms of standard deviation, MDBO has outperformed all the algorithms on 16 benchmark functions, while for one function i.e., F1, again WOA has produced minimum value. Further, it can be analyzed that MDBO has shown superior results on all 9 uni-model function, which validates its stronger ability for the local search. However, on the multi-model functions MDBO outperformed in seven among eight, which shows stronger exploration property. Thus, it is concluded that MDBO can be successfully utilized for solving real world optimizations problems.
2) Wilcoxon and Friedman’s test: The Wilcoxon rank sum and FriedMans’s tests are performed to validate the dissim-ilarity and efficacy of MDBO with other compared algo-rithms. The test is performed over fiver percent significance level (ninety five percent confidence) using NULL hypothesis. Further, p value of the MDBO and other algorithms has been computed using the best fitness of each iteration. Null hypothesis is reject, if p<0.05 and presented with ‘+’ or ‘-’ symbol. However, if the value ofp>0.05, NULL hypothesis is accepted and represented with symbol ‘=’. The ‘+’ symbol shows superior result of the MDBO whereas ‘-’ indicate inferior results of MDBO as compared to other algorithm. The results of Wilcoxon rank sum test of MDBO with the other considered algorithms over 17 benchmark functions are presented in Table II. The performance of MDBO is analyzed with 5 other state-of-the-art algorithms namely, PSO, Bat, ABC, MVO, and WOA in terms of p value. The p value on each benchmark function is calculated by running thirty iterations of each algorithm. The significant value (SG) is calculated on the basis of p value and mean of the fitness value. As shown in the table, the value of SG is positive if p < 0.05 and mean fitness value of MDBO is better than the compared algorithm. However, if the mean fitness value of MDBO is less than the compared algorithm, the SG is represented with ‘-’ symbol. The p > 0.05 indicate that MDBO has failed the test of dissimilarity. It can be concluded from the Table II, that proposed algorithm has surpassed WOA on all seventeen benchmark functions except F6. Moreover, MDBO has outperformed Bat algorithm on all the seventeen benchmark functions. Also, MDBO produced better results than MVO on sixteen benchmark functions among seventeen. However, for F6, PSO has given competitive results. Also, MDBO has shown positive SG value on all the functions against PSO and ABC except one function i.e, F6. Further, the Friedman’s test was also performed to find the mean rank of each algorithm. Table I presents the ranking of each algorithm
TABLE II:pandSGvalues of the Wilcoxon rank-sum test atα= 0.05 on standard benchmark functions
Fun Name Type PSO Bat ABC MVO WOA
p-value SG p-value SG p-value SG p-value SG p-value SG
F1 Ackley Multi-Model 4.24E-06 + 4.44E-08 + 4.28E-06 + 4.28E-06 + 5.28E-06 +
F2 Alpine Multi-Model 9.07E-06 + 6.44E-08 + 6.32E-08 + 8.07E-06 + 8.07E-06 +
F3 Dixon and Price Uni-modal 4.48E-06 + 4.32E-06 + 6.44E-08 + 4.39E-06 + 4.59E-06 +
F4 Griewank Multi-model 6.21E-06 + 4.31E-06 + 4.48E-08 + 3.31E-06 + 5.21E-06 +
F5 Levy Multi-Model 2.29E-06 + 6.44E-06 + 6.48E-07 + 4.39E-06 + 4.39E-06 +
F6 Pathological Multi-model 6.16E-09 = 5.22E-06 + 0.167962 = 0.167962 = 0.212258 =
F7 Perm Multi-Model 6.87E-07 + 6.32E-09 + 6.87E-07 + 6.87E-07 + 8.22E-08 +
F8 Powell Uni-model 4.39E-06 + 4.30E-07 + 3.44E-07 + 3.44E-07 + 4.48E-04 +
F9 PowellSum Uni-Model 6.87E-07 + 7.78E-04 + 6.87E-07 + 8.87E-07 + 6.87E-07 +
F10 Rastrigin Uni-Model 4.39E-06 + 2.40E-08 + 4.44E-06 + 4.51E-06 + 4.20E-06 +
F11 Rosenbrock’s Multi-Model 4.39E-06 + 3.39E-08 + 3.48E-06 + 4.48E-06 + 4.46E-06 +
F12 Rotated Hyper-Ellipsoid Uni-Model 4.42E-08 + 3.42E-07 + 3.39E-06 + 4.290E-06 + 6.32E-06 +
F13 Schumer Steiglitz Uni-model 4.48E-07 + 3.39E-08 + 3.39E-06 + 3.39E-06 + 2.32E-08 +
F14 Schwefel Multi-Model 4.48E-08 + 3.38E-08 + 3.38E-06 + 3.38E-06 + 4.44E-08 +
F15 Sphere Uni-Model 4.48E-08 + 3.39E-08 + 3.39E-06 + 3.39E-06 + 4.22E-04 +
F16 Step Uni-model 2.34E-08 + 1.26E-08 + 1.26E-06 + 1.26E-06 + 2.22E-07 +
F17 Trigonometric Uni-Model 2.80E-06 + 1.90E-08 + 1.90E-06 + 1.90E-06 + 2.28E-07 +
TABLE III: Mean of fitness value & standard deviation for 30 runs on seventeen benchmark functions
Fun PSO Bat ABC MVO WOA MDBO
Mean STD Mean STD Mean STD Mean STD Mean STD Mean STD
F1 4.51E+00 0.19E+00 4.44E+00 0.30E+00 2.18E+00 4.32E-01 1.63E+00 4.50E-01 6.31E+00 1.88E-01 6.24E-04 6.22E-01
F2 4.89E+02 3.54E+01 2.22E+00 5.01E+00 5.29E+01 1.15E+01 1.27E+02 3.42E+01 4.91E+02 3.67E+01 1.11E+00 0.22E+00
F3 8.56E+09 1.84E+09 4.11E+10 3.03E+08 1.05E+06 1.06E+06 5.71E+03 5.32E+03 8.26E+09 2.54E+09 1.20E+02 4.22E+02
F4 1.46E+00 0.06E+00 2.22E+00 0.04E+00 1.07E+00 2.57E-02 1.50E-02 1.25E-02 1.54E+00 4.98E-02 2.32E-04 2.40E-03
F5 3.69E+03 5.89E+02 6.31E+04 2.13E+02 5.32E+01 1.86E+01 4.83E+02 3.14E+02 3.70E+03 3.60E+02 1.30E+01 1.10E+01
F6 9.37E+00 0.66E+00 6.44E+00 0.52E+00 5.65E+00 4.94E-01 9.93E+00 3.62E-01 4.48E+00 3.19E-01 4.68E+00 8.03E-01
F7 2.00E+117 3.60E+117 4.10E+99 1.20E+99 5.59E+58 2.15E+59 1.05E+17 4.05E+17 4.50E+117 6.50E+117 2.00E+08 0.00E+00
F8 4.62E+04 93.54E+02 2.18E+03 7.40E+03 1.86E+02 1.22E+02 7.78E+00 5.49E+00 1.24E+05 2.91E+04 6.32E-034 4.20E-04
F9 4.46E+41 4.99E+41 2.12E+22 4.80E+54 3.33E+16 1.20E+17 2.96E+11 4.10E+11 8.41E+43 1.70E+44 1.00E+08 0.00E+00
F10 1.54E+02 1.17E+01 2.12E+00 3.94E+01 1.40E+01 6.49E+00 1.23E+02 3.56E+01 4.14E+02 1.96E+01 1.04E+01 4.22E+00
F11 1.39E+08 3.50E+07 4.12E+07 3.10E+06 9.47E+03 1.03E+04 4.58E+02 5.30E+02 1.50E+08 2.87E+07 1.10E+01 3.00E+01
F12 2.46E+01 1.99E+04 9.56E+04 7.77E+04 4.88E+03 2.50E+03 1.83E+01 1.31E+01 2.79E+05 2.70E+04 8.89E-12 5.32E-12
F13 1.87E+08 3.56E+08 7.40E+06 6.77E+06 4.25E+04 3.49E+04 1.01E-01 5.52E-02 1.55E+08 4.13E+07 3.55E-16 5.74E-16
F14 8.65E+00 3.32E+02 4.12E+03 1.07E+03 3.22E+03 6.44E+02 4.53E+03 7.70E+02 8.41E+03 3.79E+02 5.48E+02 2.20E+02
F15 4.52E+00 4.14E+03 1.02E+04 2.70E+03 1.05E+03 4.98E+02 6.76E-01 1.91E-01 4.62E+04 4.21E+03 2.07E-12 1.58E-12
F16 9.32E+02 6.70E+00 4.82E+02 7.82E+01 1.82E+02 5.65E+01 5.60E+00 4.73E+00 9.12E+02 5.87E+01 2.67E-01 7.04E-01
F17 0.89E+00 2.36E+00 7.67E+03 6.86E+00 5.05E+00 1.96E+01 1.85E+00 9.18E-01 7.68E+03 2.36E+03 2.74E-01 5.10E-01
obtained by Friedmans test. As shown in the table, again MDBO algorithm is ranked first as it has achieved minimum mean rank. Thus, it is concluded from the experimental results that MDBO algorithm is significantly different and superior as compared to five state-of-the art algorithms namely, PSO, Bat, ABC, MVO, and WOA for all the considered methods.
3) Clustering Analysis: In section V-A1, MDBO has shown superior results on the seventeen benchmark functions. In this section, the clustering efficacy of the MapReduce based MDBO, (MR-MDBO) is analyzed on 2 UCI and 3 big industrial IoT based data sets. Table V presents the details of datasets, including number of data-points, number of clusters, and number of dimensions. Poker-hand and SUSY are the large size benchmark data-sets widely used for testing the clustering performance, whereas DLemp, sIoT, and IoT_bonet are the three real industrial IoT based big datsets. For the experiments, a Hadoop cluster of 10 computers having Intel Core-i7 processor with 3.20GHz, 16GB of memory and 2TB hard disk is designed. All the methods were run with Hadoop version 3.6.2, jdk 1.8.0, and Ubuntu version 14.04. The results of the MR-MDBO are presented in terms of computation time
and F-measure. Table IV shows the mean of F-measure and computation time of five state-of-the-art MapReduce based methods, obtained by running each method on a cluster of 10 nodes. It is clearly observed from the table, that MR-MDBO has surpassed all the considered methods on four datasets in terms of F-measure, whereas for Pokerhand, MR-ABC has given competitive results. Moreover, the computation time of MR-MDBO is minimum among all the MapReduce based methods on all the datasets, where as I-PSO has performed well on two datasets namely, pokerhand and IoT_bonet. Thus, it can be inferred from the experimental results, that MR-MDBO can be used for efficient analysis of IoT based big datasets.
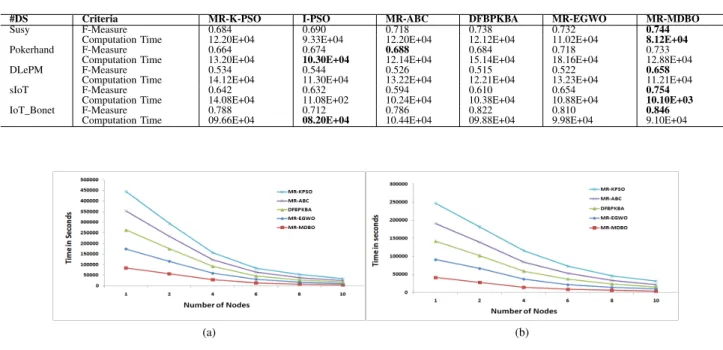
4) Speedup Analysis: Furthermore, the speedup perfor-mance of all the considered methods is also studied on a cluster with ten nodes. For analyzing the speedup efficacy, two big industrial IoT datasets namely, sIot and IoT_Bonetdata sets have been used as described in Table V. The computation time of each MapReduce based method has bee recorded by adding 2 nodes in the cluster in each run. It is pertinent from the Fig. 2 that the running time of the MDBO reduces gradually
TABLE IV: Computation time and F-measure of proposed and considered method over 30 runs
#DS Criteria MR-K-PSO I-PSO MR-ABC DFBPKBA MR-EGWO MR-MDBO
Susy F-Measure 0.684 0.690 0.718 0.738 0.732 0.744
Computation Time 12.20E+04 9.33E+04 12.20E+04 12.12E+04 11.02E+04 8.12E+04
Pokerhand F-Measure 0.664 0.674 0.688 0.684 0.718 0.733
Computation Time 13.20E+04 10.30E+04 12.14E+04 15.14E+04 18.16E+04 12.88E+04
DLePM F-Measure 0.534 0.544 0.526 0.515 0.522 0.658
Computation Time 14.12E+04 11.30E+04 13.22E+04 12.21E+04 13.23E+04 11.21E+04
sIoT F-Measure 0.642 0.632 0.594 0.610 0.654 0.754
Computation Time 14.08E+04 11.08E+02 10.24E+04 10.38E+04 10.88E+04 10.10E+03
IoT_Bonet F-Measure 0.788 0.712 0.786 0.822 0.810 0.846
Computation Time 09.66E+04 08.20E+04 10.44E+04 09.88E+04 9.98E+04 9.10E+04
(a) (b)
Fig. 2:The speedup analysis of (a) Slot (b) sIoT_Bonet
TABLE V: Datasets description
SN Name Number of Cluster Dimension Number of datapoints 1 Susy [30] 2 9 10,000,050 2 Pokerhand [30] 10 10 1025010 3 DLePM [31] 3 52 50,300 4 sIoT [32] 3 255 60,000,0 5 IoT_Bonet [30] 10 115 7062606
with the increasing the number of nodes. It is also concluded from the Fig, that the performance of MR-MDBO is close to ideal for the datasets large in size and having more number of features and clusters. Moreover, it is clearly vindicated from the Fig, that the computation time of MR-MDBO is minimal among all the MapReduce based considered method on both the datasets. Hence, it can be concluded that, as the size and number of clusters, features of the dataset grew, the advantage of the proposed parallel MDBO are increased.
VI. CONCLUSION
This paper presents a novel method for clustering big IoT based data sets, produced from industry. The proposed method finds the optimal centroids by using the ability of trained military dogs to sense the suspicious object by their strong smell sense and communication. The contribution of the paper has three folds, (i) a novel meta-heuristic algorithm, inspired from trained military dogs has been introduced (ii) the optimization ability of the proposed algorithm has been tested on seventeen standard benchmark functions and the results are compared with 5 other state-of-the-art meta-heuristics. The proposed MDBO outperformed the all the considered algorithms in terms of standard deviations and fitness value on all the benchmark functions. The uniqueness and superiority of the MDBO is also validated using the Wilcoxon rank-sum and Friedman’s test. Finally, a parallel model of the proposed
algorithm (MR-MDBO) is introduced for clustering the IoT based big datasets from industry. The clustering efficacy of the MR-MDBO is validated against F-measure and compu-tation time. The clustering performance of the MR-MDBO is compared with 6 other state-of-the-art MapReduce based parallel methods. Five standard benchmark datasets, 2 UCI and 3 real IoT based data-sets from industry are used to perform the test. The experimental results validated that proposed MR-MDBO has surpassed all the considered methods in terms of F-measure and computation time. Also, the speedup analysis of the parallel algorithm has been analyzed on a cluster with 10 nodes to test the scalability. The results witnesses that the MR-MDBO has outperformed all the compared algorithms in clustering big data sets. Thus, it can be concluded that MR-MDBO can serve as an alternative tool for handling real world big data and IoT based problems. The future work will include the applications of the proposed method in other real world applications pertaining to IoT and big data. Also, some other tools such as spark can be tested to accelerate the computation efficiency of the algorithm.
REFERENCES
[1] Q. Zhang, C. Zhu, L. T. Yang, Z. Chen, L. Zhao, and P. Li, “An incremental cfs algorithm for clustering large data in industrial internet of things,”IEEE Transactions on Industrial Informatics, vol. 13, no. 3, pp. 1193–1201, 2017.
[2] H. Cai, B. Xu, L. Jiang, and A. V. Vasilakos, “Iot-based big data storage systems in cloud computing: perspectives and challenges,”IEEE Internet of Things Journal, vol. 4, no. 1, pp. 75–87, 2016.
[3] C.-W. Tsai, S.-J. Liu, and Y.-C. Wang, “A parallel metaheuristic data clustering framework for cloud,” Journal of Parallel and Distributed Computing, vol. 116, pp. 39–49, 2018.
[4] R. C. Luo and T.-J. Hsiao, “Indoor localization system based on hybrid wi-fi/ble and hierarchical topological fingerprinting approach,” IEEE Transactions on Vehicular Technology, vol. 68, no. 11, pp. 10 791– 10 806, 2019.
[5] C. Zhu, L. Shu, T. Hara, L. Wang, S. Nishio, and L. T. Yang, “A survey on communication and data management issues in mobile sensor networks,”Wireless Communications and Mobile Computing, vol. 14, no. 1, pp. 19–36, 2014.
[6] S. Fong, R. Wong, and A. V. Vasilakos, “Accelerated pso swarm search feature selection for data stream mining big data,”IEEE transactions on services computing, vol. 9, no. 1, pp. 33–45, 2015.
[7] L. Gu, D. Zeng, S. Guo, Y. Xiang, and J. Hu, “A general communication cost optimization framework for big data stream processing in geo-distributed data centers,” IEEE Transactions on Computers, vol. 65, no. 1, pp. 19–29, 2015.
[8] A.-R. Al-Ali, I. A. Zualkernan, M. Rashid, R. Gupta, and M. Alikarar, “A smart home energy management system using iot and big data analytics approach,”IEEE Transactions on Consumer Electronics, vol. 63, no. 4, pp. 426–434, 2017.
[9] T. Ashish, S. Kapil, and B. Manju, “Parallel bat algorithm-based clustering using mapreduce,” inNetworking Communication and Data Knowledge Engineering. Springer, 2018, pp. 73–82.
[10] D. H. Wolpert and W. G. Macready, “No free lunch theorems for optimization,”IEEE transactions on evolutionary computation, vol. 1, pp. 67–82, 1997.
[11] R. Eberhart and J. Kennedy, “Particle swarm optimization,” in Proceed-ings of the IEEE international conference on neural networks, vol. 4. Citeseer, 1995, pp. 1942–1948.
[12] X.-S. Yang, “A new metaheuristic bat-inspired algorithm,” inNature in-spired cooperative strategies for optimization (NICSO 2010). Springer, 2010.
[13] D. Karaboga, “Artificial bee colony algorithm,” scholarpedia, vol. 5, no. 3, p. 6915, 2010.
[14] S. Mirjalili, S. M. Mirjalili, and A. Hatamlou, “Multi-verse optimizer: a nature-inspired algorithm for global optimization,”Neural Computing and Applications, vol. 27, no. 2, pp. 495–513, 2016.
[15] S. Mirjalili and A. Lewis, “The whale optimization algorithm,”Advances in engineering software, vol. 95, pp. 51–67, 2016.
[16] J. Yuan, “An anomaly data mining method for mass sensor networks using improved pso algorithm based on spark parallel framework,” Journal of Grid Computing, pp. 1–11, 2020.
[17] A. K. Tripathi, K. Sharma, and M. Bala, “Dynamic frequency based parallel k-bat algorithm for massive data clustering (dfbpkba),” Inter-national Journal of System Assurance Engineering and Management, vol. 9, no. 4, pp. 866–874, 2018.
[18] A. Banharnsakun, “A mapreduce-based artificial bee colony for large-scale data clustering,”Pattern Recognition Letters, vol. 93, pp. 78–84, 2017.
[19] A. K. Tripathi, K. Sharma, and M. Bala, “A novel clustering method using enhanced grey wolf optimizer and mapreduce,”Big data research, vol. 14, pp. 93–100, 2018.
[20] D. V. Medhane and A. K. Sangaiah, “Pcca: position confidentiality conserving algorithm for content-protection in e-governance services and applications,”IEEE Transactions on Emerging Topics in Computational Intelligence, vol. 2, no. 3, pp. 194–203, 2018.
[21] A. K. Sangaiah, D. V. Medhane, T. Han, M. S. Hossain, and G. Muham-mad, “Enforcing position-based confidentiality with machine learning paradigm through mobile edge computing in real-time industrial infor-matics,”IEEE Transactions on Industrial Informatics, vol. 15, no. 7, pp. 4189–4196, 2019.
[22] S. Rajesh, V. Paul, V. G. Menon, and M. R. Khosravi, “A secure and efficient lightweight symmetric encryption scheme for transfer of text files between embedded iot devices,”Symmetry, vol. 11, no. 2, p. 293, 2019.
[23] A. K. Sangaiah, M. Sadeghilalimi, A. A. R. Hosseinabadi, and W. Zhang, “Energy consumption in point-coverage wireless sensor networks via bat algorithm,”IEEE Access, vol. 7, pp. 180 258–180 269, 2019.
[24] V. Anavangot, V. G. Menon, and A. Nayyar, “Distributed big data analytics in the internet of signals,” in2018 International Conference on System Modeling & Advancement in Research Trends (SMART). IEEE, 2018, pp. 73–77.
[25] L. Cao, D. Yang, Q. Wang, Y. Yu, J. Wang, and E. A. Runden-steiner, “Scalable distance-based outlier detection over high-volume data streams,” in2014 IEEE 30th International Conference on Data Engineering. IEEE, 2014, pp. 76–87.
[26] R. De Rosa, F. Orabona, and N. Cesa-Bianchi, “The abacoc algorithm: a novel approach for nonparametric classification of data streams,” in 2015 IEEE International Conference on Data Mining. IEEE, 2015, pp. 733–738.
[27] C. Perera, A. Zaslavsky, P. Christen, and D. Georgakopoulos, “Sensing as a service model for smart cities supported by internet of things,”
Transactions on emerging telecommunications technologies, vol. 25, no. 1, pp. 81–93, 2014.
[28] A. Kumar Tripathi, K. Sharma, and M. Bala, “Fake review detection in big data using parallel bbo,” International Journal of Information Systems & Management Science, vol. 2, no. 2, 2019.
[29] A. K. Tripathi, K. Sharma, and M. Bala, “Parallel hybrid bbo search method for twitter sentiment analysis of large scale datasets using mapreduce,”International Journal of Information Security and Privacy (IJISP), vol. 13, no. 3, pp. 106–122, 2019.
[30] D. Dua and C. Graff, “UCI machine learning repository,” 2017. [Online]. Available: http://archive.ics.uci.edu/ml
[31] Q. Zhang and Z. Chen, “A weighted kernel possibilistic c-means algo-rithm based on cloud computing for clustering big data,”International Journal of Communication Systems, vol. 27, no. 9, pp. 1378–1391, 2014. [32] Q. Zhang, L. T. Yang, and Z. Chen, “Privacy preserving deep computa-tion model on cloud for big data feature learning,”IEEE Transactions on Computers, vol. 65, no. 5, pp. 1351–1362, 2015.
Ashish Kumar Tripathi has received his M.Tech and PhD from he department of Computer Science & Engineering, Delhi Technological University. He is currently working as an Assistant Professor in the department of Computer Science & Engineering at Malviya National Institute of Technology (MNIT), Jaipur, India. He is active reviewer of several jour-nals of repute. His research interests are Big data analytics, Social Media Analytics, Soft Computing and Natural Language Processing.
Prof. Kapil sharma received his Ph.D in Computer Engineering in the area of software reliability. He is currently working as Head in the Department of Information Technology at Delhi Technological University. He is active reviewer of many reputed journals of IEEE, IET, ACM, Springer and Elsevier. He is also a senior member of IEEE. His research interests are in the area of Software Reliability, Soft Computing, and Big data analytics.
Manju Bala completed her PhD in Computer Science from Jawaharlal Nehru University, New Delhi, India in 2011. She is currently an Assistant Professor with the department of Computer Sci-ence, Indraprastha College for Women, University of Delhi. Her research interests include computer graphics, pattern classification and machine learning. She has authored research papers in many national and international journals.
Akshi Kumar received her Ph.D in Computer En-gineering from University of Delhi, India. She is currently an Assistant Professor in the Department of CSE at Delhi Technological University. She is active reviewer of many top journals of IEEE, IET, ACM, Springer and Elsevier. Her research interests are in the area of Affective Computing, Sentiment Analysis, Social Media Analytics, Soft Computing and Natural Language Understanding.
Varun G. Menon completed his Ph.D in Computer Science and Engineering from Sathyabama Univer-sity, India in 2017. He is currently an Associate Professor with the Department of Computer Science and Engineering, SCMS School of Engineering and Technology, India. His research interests include IoT, data analytics, brain signal analysis, fog computing, and underwater acoustic sensor networks.
Ali Kashif Bashir is a Senior Lecturer at the Department of Computing and Mathematics, Manch-ester Metropolitan University, United Kingdom. He received his Ph.D. in computer science and engi-neering from Korea University South Korea. His research interests include internet of things, wireless networks, distributed systems, machine learning, etc. He is serving as the Editor-in-chief of the IEEE FU-TURE DIRECTIONS NEWSLETTER. He is also editor of several reputed journals.