
arXiv:0904.4307v1 [astro-ph.GA] 28 Apr 2009
September 7, 2018
Chemical Composition of Extremely Metal-Poor Stars in the
Sextans Dwarf Spheroidal Galaxy.
⋆
W. Aoki
1,2, N. Arimoto
1,2, K. Sadakane
3, E. Tolstoy
4, G. Battaglia
5, P. Jablonka
6, M. Shetrone
7, B. Letarte
8, M. Irwin
9,
V. Hill
10, P. Francois
11, K. Venn
12, F. Primas
5, A. Helmi
4, A. Kaufer
13, M. Tafelmeyer
6, T. Szeifert
13, and C.
Babusiaux
101 National Astronomical Observatory of Japan, Mitaka, Tokyo 181-8588, Japan e-mail: [email protected],
2 Department of Astronomical Science, Graduate University of Advanced Studies, Mitaka, Tokyo 181-8588, Japan
3 Astronomical Institute, Osaka Kyoiku University, Asahigaoka, Kashiwara, Osaka 582-8582, Japan e-mail:
4 Kapteyn Astronomical Institute, University of Groningen, P.O. Box 800, 9700 AV Groningen, Netherlands e-mail:
[email protected], [email protected]
5 European Southern Observatory, Karl-Schwarzschild-Strasse 2, 85748 Garching bei M¨unchen, Germany e-mail:
[email protected], [email protected]
6 Observatoire de Gen´eve, Laboratoire d’Astrophysique de l’Ecole Polytechnique F´ed´erale de Lausanne (EPFL), CH-1290 Sauverny, Switzerland e-mail:[email protected], [email protected]
7 University of Texas, McDonald Observatory, HC75 Box 1337-McD, Fort Davis, TX 79734, USA e-mail:
8 California Institute of Technology, Pasadena, CA 91125, USA e-mail:[email protected] 9 Institute of Astronomy, Madingley Road, Cambridge CB03 0HA, UK e-mail:[email protected]
10 GEPI, Observatoire de Paris, CNRS, Universit´e Paris Diderot, Place Jules Janssen 92190 Meudon, France e-mail:
[email protected], [email protected]
11 Observatoire de Paris-Meudon, GEPI, 61 avenue de l’Observatoire, 75014 Paris, France e-mail:[email protected] 12 Department of Physics and Astronomy, University of Victoria, Elliott Building, 3800 Finnerty Road, Victoria, BC V8P 5C2,
Canada e-mail:[email protected]
13 European Southern Observatory, Alonso de C´ordova 3107, Santiago, Chile e-mail:[email protected], [email protected] Received; accepted
ABSTRACT
Context.Individual stars in dwarf spheroidal galaxies around the Milky Way Galaxy have been studied both photometrically and
spectroscopically. Extremely metal-poor stars among them are very valuable because they should record the early enrichment in the Local Group. However, our understanding of these stars is very limited because detailed chemical abundance measurements are needed from high resolution spectroscopy.
Aims.To constrain the formation and chemical evolution of dwarf galaxies, metallicity and chemical composition of extremely
metal-poor stars are investigated.
Methods.Chemical abundances of six extremely metal-poor ([Fe/H]<−2.5) stars in the Sextans dwarf spheroidal galaxy are
deter-mined based on high resolution spectroscopy (R=40,000) with the Subaru Telescope High Dispersion Spectrograph.
Results.(1) The Fe abundances derived from the high resolution spectra are in good agreement with the metallicity estimated from
the Ca triplet lines in low resolution spectra. The lack of stars with [Fe/H].−3 in Sextans, found by previous estimates from the Ca triplet, is confirmed by our measurements, although we note that high resolution spectroscopy for a larger sample of stars will be necessary to estimate the true fraction of stars with such low metallicity. (2) While one object shows an overabundance of Mg (similar to Galactic halo stars), the Mg/Fe ratios of the remaining five stars are similar to the solar value. This is the first time that low Mg/Fe ratios at such low metallicities have been found in a dwarf spheroidal galaxy. No evidence for over-abundances of Ca and Ti are found in these five stars, though the measurements for these elements are less certain. Possible mechanisms to produce low Mg/Fe ratios, with respect to that of Galactic halo stars, are discussed. (3) Ba is under-abundant in four objects, while the remaining two stars exhibit large and moderate excesses of this element. The abundance distribution of Ba in this galaxy is similar to that in the Galactic halo, indicating that the enrichment of heavy elements, probably by the r-process, started at metallicities [Fe/H]≤ −2.5, as found in the Galactic halo.
Key words.nuclear reactions, nucleosynthesis, abundances – galaxies: abundances – galaxies: dwarf – galaxies: individual(Sextans) – stars: abundances
⋆ Based on data collected at Subaru Telescope, which is operated by
the National Astronomical Observatory of Japan.
1. Introduction
The Local Group includes a number of dwarf galaxies that have been evolving while interacting with the giant spiral galaxies, the Milky Way and M31. Among these dwarf galaxies, the
dwarf spheroidals contain little gas and dust, and are quiescent at present. They are located close to the giant spirals, compared to gas-rich dwarf irregulars, providing a unique opportunity to study these galaxies in detail, based on photometry and spec-troscopy of individual stars.
Previous high resolution spectroscopic studies of bright red giants in several dwarf spheroidals (Shetrone et al. 2001, 2003) revealed that the abundance ratios betweenα-elements and Fe-peak elements (e.g., Mg/Fe) decreases with increasing metallic-ity even in metal-poor stars (−2 <[Fe/H]< −1)1. This is quite different from the trend found in the Galactic halo, where metal poor stars show an almost constant enhancement in theα/Fe ra-tio, with only a few exceptions having significantly higher or lower values. Moreover, the trend in theα/Fe ratios, as a func-tion of metallicity, varies between the individual dwarf galax-ies as well. Differences of abundance ratios are also seen in neutron-capture elements (e.g. Ba/Fe, Ba/Y) between stars in dwarf spheroidal galaxies and those in field stars Venn et al. (e.g., 2004).
Another difference found between dwarf spheroidals and the Galactic halo is the metallicity distribution, in particular that of the low metallicity end. Helmi et al. (2006) showed the defi-ciency of stars with [Fe/H]<−3 in four dwarf spheroidals based on the measurements of the CaIItriplet in low resolution spec-tra obtained with the VLT/FLAMES. This difference, as well as the difference in the α/Fe ratios, suggests that these dwarf spheroidals are not the direct relics of the building blocks of the Galactic halo. However, the metallicity distribution in the ex-tremely low metallicity stars from Helmi et al. (2006) require confirmation from high resolution spectroscopy. This is because the metallicities determined from the Ca triplet method have only been calibrated for stars with [Fe/H]>−2.5, i.e., the metal-licities of globular cluster stars used in the calibration. Recently, Battaglia et al. (2008) confirmed that the metallicity from the Ca triplet is in good agreement with the Fe abundances based on high resolution spectra for the 129 stars in the Sculptor and Fornax dwarf spheroidal galaxies, however those metallicities were still [Fe/H]>−2.5, thus further studies of lower metallicity stars are required.
Observational studies of extremely metal-poor ([Fe/H]< −2.5) stars in dwarf spheroidal galaxies based on high res-olution spectroscopy are still very limited. Detailed chemi-cal abundance analyses have been published for only three red giants in three galaxies to date (Sextans, Draco and Ursa Minor) by Shetrone et al. (2001), Fulbright et al. (2004) and Sadakane et al. (2004). These three stars show quite interest-ing abundance patterns, e.g., a deficiency of Na and neutron-capture elements. However, since only one object has been stud-ied in each galaxy, then the early chemical enrichment of dwarf spheroidals is still far from conclusive.
Quite recently, extremely metal-poor stars have been found in ultra-faint dwarf galaxies, which have been discovered with SDSS (Kirby et al. 2008; Norris et al. 2008). High resolution spectroscopy has been also made for several stars in these galax-ies (Koch et al. 2008; Frebel et al. 2009). Comparisons of ex-tremely metal-poor stars in classical dwarf spheroidals and those in ultra-faint dwarf galaxies are useful for understanding of their formation and evolution.
To investigate the chemical nature of the lowest metallicity stars in dwarf galaxies, we have gathered high resolution spectra of individual stars in dwarf galaxies using the Subaru Telescope
1 [A/B]=log(N
A/NB)−log(NA/NB)⊙, and logǫA=log(NA/NH)+12 for elements A and B.
and VLT. In this paper, we report on the chemical composition of six extremely metal-poor stars in the Sextans dwarf spheroidal galaxy from observations taken with the Subaru High Dispersion Spectrograph. Helmi et al. (2006) suggest that this galaxy in-cludes a relatively large number of stars with [Fe/H]< −2.5. The analysis presented here provides Fe abundances to exam-ine the calibration of the metallicity from the Ca triplet in more metal-poor stars, as well as new abundance ratios ofα-elements, other Fe-peak elements, and neutron-capture elements.
2. Observation and Measurements 2.1. Sample Selection and Photometric Data
We selected stars whose metallicity ([Fe/H]) was estimated to be lower than −2.5 by Helmi et al. (2006) based on the VLT/FLAMES low resolution spectroscopy for the Ca triplet re-gion. The list of objects with their coordinates is given in Table 1. The table includes the two stars S 10–12 and S 11–36, which were not analyzed in the present work, because the former has only very broad absorption features with a systemic velocity close to 0 km s−1, and the latter is a carbon-rich star.2
The optical photometry for the central regions was taken with the WFC on the Isaac Newton Telescope on La Palma and for the outer regions with WFI on the ESO/2.2m telescope on La Silla, while the near-infrared JHK observations were all taken with WFCAM on UKIRT on Mauna Kea as part of the UKIDSS surveys (Lawrence et al. 2007). Optical data were processed and calibrated using variants of the data reduction pipeline developed for the INT Wide Field Survey3and the near-infrared JHK data
was processed using the VDFS pipeline developed for WFCAM and VISTA surveys (see Irwin & Lewis 2001; and Irwin et al. 2004 for general details of the pipeline products and procedures). The optical data in the instrumental V and i passbands was con-verted to V and I on the standard Johnson-Cousins system us-ing previously derived color equations for these camera systems. Near-infrared calibration of WFCAM data is based on 2MASS and is on the MKO system (Hodgkin et al. 2009). Photometric data for V,I and K are listed in Table 2 and have typical errors of 0.01-0.02 magnitudes for V and I, and 0.02-0.03 magnitudes for K. The foreground reddening of E(B−V) =0.038 is esti-mated from the dust maps of Schlegel et al. (1998). The value agrees with the estimate of reddening listed by Mateo (1998): E(B−V) = 0.03±0.01. The extinction in each photomet-ric band is derived using the reddening relations in Table 6 of Schlegel et al. (1998).
The extremely metal-poor, halo red giant, HD 88609 was observed as a comparison star. Its optical photometric data
2 Although the data quality is insufficient for the present purpose, our analysis of the spectrum of S 11–36 indicates that this star is extremely metal-poor ([Fe/H]=−2.9±0.3) and carbon-rich ([C/Fe]=+1.9±0.3). The effective temperature of 4500 K is estimated from the V−K color, while log g=1.0 and vmicro=2.3 km s−1have been assumed in the anal-ysis based on the typical values we found for the Sextans giants (see §3 for the details of our analysis technique). The carbon abundance is estimated from the C2 Swan band at 5165 Å. Ba shows some excess ([Ba/Fe]= +0.8). Such a moderate excess of Ba is found in carbon-enhanced extremely metal-poor stars in the Galactic halo (e.g. Aoki et al. 2007a), and suggests that the origin of the carbon-excess is in the nucleosynthesis of an AGB star. However, given the fact that the non-carbon-rich star S 15–19 in the Sextans dwarf galaxy also shows a mod-erate excess of Ba (§3), the origins of the carbon and Ba in S 11-36 are not definitively determined.
were taken from Carney (1983), and the K magnitude from the 2MASS catalogue (Skrutskie et al. 2006). The V −I color in Table 2 for HD 88609 is transformed from the Johnson I magni-tude from Carney (1983) to the Kron-Cousins system.
2.2. High Resolution Spectroscopy
High resolution spectra of extremely metal-poor star candi-dates in Sextans were obtained with the Subaru Telescope High Dispersion Spectrograph (HDS, Noguchi et al. 2002) in May 2005 and January 2007. The spectra cover 4400–7100 Å with a resolving power of 40,000. The exposure time and the signal-to-noise (S/N) ratios per 1.8 km−1pixel at 5180 Å are given in
Table 1. The seeing conditions varied from 0.6 to 1.4 arcsec dur-ing the January 2007 run, and 0.6 to 1.1 arcsec durdur-ing the May 2005 observations.
Standard data reduction procedures were carried out with the IRAF echelle package4. Cosmic ray strikes were removed using the procedures described by Aoki et al. (2005). The sky background is significant in some cases because those obser-vations were made close to the full moon. We attempted to estimate the sky background for each exposure, and excluded those exposures where the background dominates the object’s light, or when the estimate is uncertain due to the poor seeing conditions. The sky background was removed in the remaining frames. Individual spectra were combined after the wavelength calibration. The quality of the sky subtraction was examined around the MgIb lines (5160–5190 Å), where the broad triplet features of the solar spectrum can be seen if the sky subtraction is not sufficient. The exposure times and S/N ratios in Table 1 represent the final spectra, after the selection of exposures and the sky subtraction.
2.3. Measurements of Equivalent Widths and Radial Velocities
We adopted the line list compiled by Aoki et al. (2009, in prepa-ration) for studies of extremely metal-poor stars in the Galactic halo. Equivalent widths for isolated absorption lines are mea-sured by fitting Gaussian profiles. This technique could underes-timate the equivalent widths for Na I D lines and Mg I b lines, which are the strongest among the lines studied here. However, we applied the spectrum sysnthesis for these lines and found that the wing component of these lines is not evident in our stars at the resolution and S/N of our spectra.
The radial velocity of each object is measured from clean Fe lines through the above Gaussian fitting procedure. The he-liocentric radial velocity is given in Table 1. The random error of the measurement given in the table is estimated asσvN−1/2,
whereσvis the standard deviation of the values derived from
in-dividual spectral lines and N is the number of lines used. The results agree well with the Ca triplet measurements from the VLT/FLAMES data. The only exception is S 12–28, where our result is 14 km s−1 smaller than that from the Ca triplet lines.
This disagreement is within the 3σmeasurement error on the Ca triplet lines, therefore further measurements are required before concluding that this star belongs to a binary system.
4 IRAF is distributed by the National Optical Astronomy Observatories, which is operated by the Association of Universities for Research in Astronomy, Inc. under cooperative agreement with the National Science Foundation.
3. Chemical Abundance Analyses 3.1. Stellar parameters
The effective temperature (Teff) is estimated from the (V−K)0
and (V − I)0 color indicies using the temperature scale of
Alonso, Arribas, Mart´ınez-Roger (1999). We assumed [Fe/H]= −3.0 for the calculation. The Teff results for HD 88609 from the two colors agree very well, however Teff from V−I for the Sextans objects is systematically higher by 150 K, on average, than that from V −K. This discrepancy is not explained by a small increase in the reddening correction. Although the reason for this discrepancy is unclear, the values from the V −K are adopted in this analysis. Our estimated uncertainty in the eff ec-tive temperatures is±150 K.
Other stellar parameters are determined through the standard LTE analysis of the FeIand FeIIlines, using the model atmo-spheres from Kurucz (1993). We adopted the grid of models cal-culated with the new opacity distribution functions and assum-ing no convective overshoot (Castelli & Kurucz 2003). The mi-croturbulence (vmicro) and gravity (g in cgs unit) are determined
such that the Fe abundance is not dependent on the strengths of FeIlines, nor on the ionization state, respectively. The range in log g values is 0.6 to 1.4. Using the true distance modulus of (m-M)o=19.67 for the Sextans dwarf spheroidal (Mateo 1998), the
range in MVof our objects is−1.7 and−2.2, which corresponds
to 1.0 < log g < 1.3 if the Y2 isochrones for extremely
metal-poor stars are adopted (Kim et al. 2002). Thus, the spectroscopic gravity from the Fe lines agrees well with the gravity estimates from the color-magnitude diagram, and the remaining scatter is most likely due to errors in the Fe line analysis. The vmicrovalues
in our sample range from 2.2 to 2.7 km s−1, which are typical of
the values found for evolved red giants in the Galactic halo (e.g., McWilliam et al. 1995).
3.2. Na to Fe-peak elements
To compare the chemical abundance results with previous DART studies, in particular Shetrone et al. (2003), analyses using the same line lists would be ideal. However, the metallicity of our objects is significantly lower than the stars previously studied, therefore our analyses are limited to only a small number of lines in common and those have comparatively large oscillator strengths. The line list used in this work is given in Table 3 with equivalent widths for the Sextans stars and the comparison star. We found 26 FeIlines in common with Shetrone et al. (2003), among which the log g f values of 18 lines agree well; the other 8 lines show differences of 0.05–0.19 dex, but these are not sys-tematic.
Amongst the other species, the numbers of absorption lines commonly used here and by Shetrone et al. (2003) include four lines of Fe II, three of Mg I, two of Na I, CaI, Ti II and Ba
II, and one of TiI, Cr I, and Ni I. The log g f values of three of the four FeIIlines, which are originally from Moity (1983), differ by 0.10–0.25 dex from those of Shetrone et al. (2003), but again these differences are not systematic. Our log g f val-ues for the two Mg I lines at 5172 and 5183 Å, originally from Aldenius et al. (2007), are 0.06–0.07 dex lower than in Shetrone et al. (2003). For the Ba II 5853 Å line, our log g f value is 0.10 dex higher than in Shetrone et al. (2003). These atomic data differences will cause only small differences in the final abundances between the two studies, smaller than the mea-surement errors. The log g f values for two of the TiIIlines in this analysis are lower by about 0.25 dex compared to those
in Shetrone et al. (2003). The atomic data of most of the TiII
lines are from Ryabchikova et al. (1994) and/or Pickering et al. (2001), and when lines are in common between these two stud-ies, the atomic data values agree very well. We determined the Ti abundances using our line list with no modification.
The iron abundances are determined from 42–61 FeI and 2–7 FeIIlines. The number of lines used in the analysis is de-pendent on the strengths of lines and the S/N ratio of the spec-trum. For instance, the numbers of Fe II lines used are only two and three for S 15–19 (having the lowest metallicity) and S 14–98 (having the lowest S/N ratio), respectively. The de-rived iron abundances range from [Fe/H] = −3.10 to −2.66, confirming that these stars are extremely metal-poor. The iron abundance of the comparison star HD 88609 is [Fe/H]=−2.92, which is in good agreement with previously published values (Fulbright et al. 2004; Honda et al. 2007).
The Mg abundances are determined from 3–4 of the four Mg
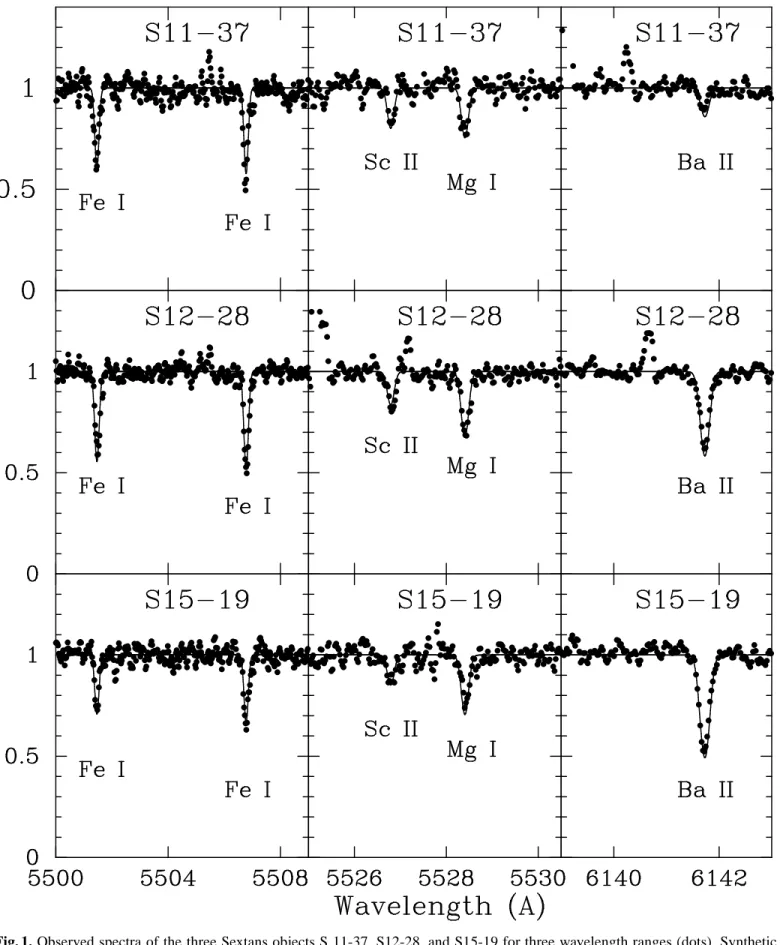
I lines (λ4571, 5172, 5183, and 5528). Examples of the MgI λ5528 absorption lines are shown in Figure 1, along with exam-ples of FeI, Sc II, and BaIIlines. The agreement in the abun-dances derived from the individual Mg I lines in fairly good agreement for each object: the standard deviation in the Mg abundances is less than 0.1 dex in most cases. We note that only two Mg I lines at 5172 and 5183 Å were used in the analysis of S 14–98 because of the low S/N ratio of the spectrum. The Mg/Fe ratios are shown in Figure 2. The Mg/Fe ratios for 5 out of 6 of our objects are, surprisingly, as low as the solar value, i.e., lower than the typical values found in the Galactic halo stars by 0.3–0.4 dex.5The exception is S 15–19, with [Mg/Fe]=0.4.
The [Mg/Fe] ratio of the comparison star HD 88609 is in good agreement with previous studies and with the typical metal-poor Galactic halo star (=0.4).
The difference in the Mg/Fe ratio between S 15–19 and other stars in Sextans is confirmed by comparing the spectral fea-tures in Figure 1. Comparisons are made for S 11–37, S 12– 28, and S 15–19, which have similar atmospheric parameters (Teff∼4600 K and log g∼1.3). Synthetic spectra calculated for the derived Mg, Sc, Fe and Ba abundances (Table 4) are also shown in the figure. The strength of the MgIabsorption lines at 5528 Å are similar between S 12-28 and S 15-19, while that of S 11–37 is slightly weaker. In contrast, the FeIlines at 5501 and 5507 Å of S 15–19 are weaker than those of the other stars. As a result, the Fe abundance of S 15–19 is the lowest, and its Mg/Fe ratio is the highest. The Mg/Fe ratios are discussed in detail in
§4.
The Ca abundances are derived from 2–5 Ca I lines, in-cluding theλ6122 and 6162 features that are detected in all of our Sextans stars. The [Ca/Fe] and [Mg/Ca] ratios are shown in Figure 3. Low Ca/Fe ratios are found for objects with low Mg/Fe values. The only exception is S14-98, which shows a high Ca/Fe ratio ([Ca/Fe]=+0.27), but from the lowest S/N ratio spectrum, thus it has the largest abundance uncertainty. The [Mg/Ca] val-ues of our sample are solar (∼0.0), again with S14-98 as the only exception probably due to its larger observational errors (Fig. 3).
5 The Mg/Fe ratios of extremely metal-poor red giants in the Galactic halo are shown in Figure 2. These values are adopted from Cayrel et al. (2004), Honda et al. (2004) and Aoki et al. (2005). As discussed by Aoki et al. (2005), there is a small systematic differences in the [Mg/Fe] values between Cayrel et al. (2004) and the other two papers: over the metallicity range of−3.2<[Fe/H]<−2.5, which is that stud-ied here, the average of the [Mg/Fe]= +0.30 in Cayrel et al. (2004), while it is+0.42 in Honda et al. (2004) and Aoki et al. (2005). We note that the remarkably Mg-enhanced ([Mg/Fe]=+1.25) star BS 16934–005 (Aoki et al. 2007b) is excluded from the sample of Aoki et al. (2005).
The Na abundances are determined from the NaI D lines. The strength of these lines are similar in most objects, and the derived Na/Fe ratios agree with the solar value within the mea-surement errors. The exception is S 10–14, which shows weaker absorption lines. A large non-LTE effect on the D line absorption is predicted for stars in this atmospheric parameter range. The non-LTE corrections to the Na abundance derived from the D lines with W =150 mÅ in red giants is∼ −0.5 dex (Takeda et al. 2003; Andrievsky et al. 2007). This correction is not included in our results. Since the effect is essentially systematic, this cannot be the source of the difference of the Na abundances in S 10–14 and that of the other stars in our Sextans sample.
Figure 4 shows the [Na/Fe] and [Na/Mg] ratios for the Sextans sample and Galactic stars. Most stars have had their Na abundances determined from an LTE analysis of their D lines. The Na abundances of the five objects in our sample have abun-dances similar to Galactic halo stars ([Na/Fe]∼ 0.0). The only exception is S 10–14, with an exceptionally low Na abundance. On the other hand, the plot of Na/Mg ratio shows a continuous distribution from [Na/Fe]=−0.6 to+0.1.
Cr is under-abundant in all objects, as found for Galactic halo red giants. The abundances are determined from the CrIlines at 5206 and 5208 Å. A dependence of the derived Cr abundance on the stellar type (giant or dwarf) and on the species used in the analysis (CrIorII) was recently discussed by Lai et al. (2008). Hence, we do not discuss the [Cr/Fe] values, other than to note that our Cr abundances are in good agreement with those of sim-ilar red giants in the Galactic halo.
3.3. The neutron-capture element Ba
The Ba abundance is determined from the three Ba IIlines at 4934, 5853, and 6141 Å. The resonance line at 4554 Å is not used because it is affected by a bad column on the CCD detec-tor. The effects of hyperfine splitting and isotope shifts are in-cluded in the calculation, assuming the Ba isotopic ratio of the r-process component of solar-system material. The Ba/Fe abun-dance ratios are shown in Figure 5.
Four of the Sextans stars are significantly under-abundant in barium ([Ba/Fe]∼ −1.3), with abundance ratios in very good agreement with each other. In contrast, S 15–19 shows a large excess ([Ba/Fe]= +0.5) and S 12-28 shows a moderate excess ([Ba/Fe]=−0.3), with respect to the other four stars. These large differences are clearly seen in the strength of the BaII λ6141 alone, as shown in Figure 1.
To constrain the origin of the Ba excess in S15-19, a mea-surement of Eu abundance would be helpful, however no Eu line is detected in our spectrum of this object. The upper limit esti-mated from the EuII6645 Å line is [Eu/Fe]<+1.6. This yields a lower limit of [Ba/Eu]>−1.1, which does not exclude the s-process nor the r-s-process as the origin of the Ba excess.
Another constraint might be the carbon abundance, because stars showing large excesses of s-process elements usually show a carbon excess. An upper limit to the carbon abundance in S 15– 19 can be estimated from the C2 Swan 0–0 band at 5165 Å, as
[C/Fe] < +1.6. Hence, this star is not extremely carbon-rich. However, taking into account the decrease in carbon expected during the evolution of a red giant, as is found in Galactic halo stars (e.g. Spite et al. 2005, Aoki et al. 2007a), then this upper limit does not exclude the possibility of contamination in the s-process abundances through mass transfer from an AGB star.
3.4. Uncertainties
Random errors in our abundance measurements from equivalent-widths are estimated to beσN−1/2, whereσis the standard
de-viation in the abundances derived for individual lines and N is the number of lines used in the analysis. When the number of lines is smaller than three, the standard deviation in the Fe I
lines (σFe) is adopted. The random errors are less than 0.1 dex
for the iron abundance from FeIlines, while typical values for other species are 0.1–0.2 dex. The random errors for S 14–98 are slightly larger due to the low S/N ratio of its spectrum.
To estimate the abundance errors due to the uncertainties in the atmospheric parameters, we examine the comparison star HD 88609, as shown in Table 5. The results show the abundance changes in logǫ(Fe) for FeIandII, and those in [X/Fe] for other species. Total uncertainties are obtained by adding these values, in quadrature, to the random errors, and are listed in Table 4. The dominant abundance errors are due to the uncertainty in the effective temperatures in the total error of [Fe/H], while random errors are important for [X/Fe], in particular when the number of lines used in the analysis is small.
4. Discussion and concluding remarks 4.1. Metallicity distribution
Our analysis of the high resolution spectra of six extremely metal-poor star candidates in the Sextans dwarf galaxy confirms that these stars are extremely metal-poor, with [Fe/H] between
−2.6 and−3.1. Previously, only three stars with such low metal-licities, as confirmed by high resolution spectral analyses, were known in dwarf spheroidal galaxies: Draco 119 (Shetrone et al. 2001; Fulbright et al. 2004), Ursa Minor COS 4 (Sadakane et al. 2004), and Sextans S49 (Shetrone et al. 2001). Therefore, this analysis provides the chemical composition for the largest sam-ple of extremely metal-poor stars in dwarf galaxies to date.
Our results have confirmed the low metallicities determined for these stars from the VLT/FLAMES Ca triplet measurements (Helmi et al. 2006). However, Table 6 shows that the Fe abun-dances that we derive are in fact slightly lower than those from the Ca triplet estimates (also see Fig. 6). The agreement is fairly good for S10-14, while the difference is significant for S15-19. The average difference is 0.22 dex. This discrepancy is within the uncertainties in our Teff scale, however it could also be an effect of the lack of calibrating clusters at these metallicities of the Ca triplet method.
The new calibration of metallicity from the Ca triplet lines by Battaglia et al. (2008) (see§1) results in a better agreement of the Fe abundance with that from our high resolution spectral analysis. Table 6 also gives the metallicity estimated from the calibration of Battaglia et al. (2008) for our sample. These Fe values are systematically lower than those of Helmi et al. (2006) by 0.15 dex, in excellent agreement with our results. The excep-tion is S 15-19 ([Fe/H]= −3.1 from the high resolution spec-trum), for which a large discrepancy still remains. The metal-licity range of [Fe/H]< −2.8 is not covered by the calibration of Battaglia et al. (2008) either. High resolution spectroscopy is still required to obtain reliable metallicities for individual stars in this metallicity range at present. However, our results indicate that stars having [Fe/H]<−3 are indeed deficient in the Sextans dwarf spheroidal as discussed by Helmi et al. (2006), though this should be confirmed by future studies for a larger sample.
Quite recently, Kirby et al. (2008) reported the metallic-ity distribution for eight ultra-faint dwarf spheroidals around
the Galaxy. The low metallicity tail derived in their analysis, based on medium resolution spectra of the Fe lines near the Ca triplet lines, is similar to that of the Galactic halo, rather than to the classical dwarf spheroidals studied by Helmi et al. (2006), including Sextans. The existence of stars with [Fe/H]
. −3 was confirmed from a high resolution spectral analy-ses by Frebel et al. (2009) for stars in the two ultra-faint dwarf galaxies, Ursa Major II and Coma Berenices. Kirby et al. (2008) have suggested that the difference in the low metallicity tail of the metallicity distribution functions between the two classes of dwarf galaxies is real, and that the ultra-faint dwarf spheroidals might be remnants of the building blocks of the Galactic halo. It is likely that the classical dwarf galaxies, like Sextans, al-ready are showing chemical enrichment due to its star forma-tion and chemical evoluforma-tion history. Therefore, differences in the metallicity distributions, as well as detailed chemical composi-tion, found for individual classical dwarf spheroidals could be the result of their own independent evolutionary histories. For example, the classical dwarf galaxies may have had gas infall to explain the shortage of extremely metal-poor stars, similar to one likely solution for the G-dwarf problem in the solar neigh-bourhood (Pagel& Patchett 1975).
We emphasize again that, although the metallicity distribu-tions of both ultra-faint and classical dwarf spheroidals have been explored by recent studies including the present work, fur-ther measurements of extremely metal-poor stars with high res-olution spectroscopy are required to accurately determine the fraction of lowest metallicity ([Fe/H].−3) stars.
4.2.α/Fe ratios
The most surprising result of our study is the low Mg/Fe ra-tios ([Mg/Fe]∼ 0.0) found in five stars with respect to stars in the Galactic halo. The Ca/Fe ratios are also low in these ob-jects, indicating that the abundance ratios between α-elements and iron in most of the extremely metal-poor stars in this dwarf galaxy are lower than those found in Galactic halo stars. The α/Fe ratios of extremely metal-poor stars in the ultra-faint dwarf spheroidals studied by Frebel et al. (2009) are as high as those found in the bulk of Galactic halo stars. Therefore, the dwarf spheroidal Sextans does appear to have had a different chemical evolution compared to the ultra-faint dwarfs, whether we exam-ine abundance ratios or the metallicity distribution.
Low Mg/Fe ratios are found in some globular cluster stars. Measurements of the Mg isotopic abundances from MgH ab-sorption features by Shetrone (1996b) revealed that several red giants in M13 have low 24Mg abundances, resulting in low
Mg/Fe ratios. However, globular cluster stars with low Mg also show overabundances of Al and Na (e.g. Shetrone 1996a; see also Kraft 1994 for more on the Na-O anti-correlation). Unfortunately, Al abundances are not available in our Sextans sample, and measurements of the Mg isotope ratios are almost impossible because of the weakness of MgH features. Future measurements of Al abundances from blue spectra will be use-ful to constrain the possible effect of the MgAl chain. However, since the Sextans stars are not overabundant in Na, we do not expect such abundance anomalies in this dwarf galaxy.
Lowα/Fe ratios are also found in dwarf galaxy stars at higher metallicity ([Fe/H]> −2). For instance, [α/Fe] ratios of stars in the Sculptor dwarf galaxy show a decreasing trend with in-creasing metallicity ([Fe/H]> −2) and reach [α/Fe]∼ −0.3 at [Fe/H]=−1 (e.g., ?). Several scenarios have been proposed to explain such low Mg/Fe ratios, or their decreasing trend with in-creasing metallicity, in dwarf galaxy stars. One idea is the
con-tribution of type Ia supernovae, which provide a large amount of iron, to metal-poor stars in dwarf galaxies. If a low star for-mation rate is assumed for dwarf galaxies, with respect to the Galactic halo and thick disk, the effects of Type Ia supernovae could appear at lower metallicity. A similar result is expected if one assumes that the material enriched by supernova ejecta is lost from dwarf galaxies by some mechanism (e.g. interaction with the Galaxy).
The low Mg/Fe ratios in extremely metal-poor stars found in the present study are not likely to be explained by contribu-tions from Type Ia supernovae. The chemical abundance pattern of stars with such very low metallicity is expected to represent one or only a few nucleosynthesis events. Given the long time-scale of the Type Ia supernovae estimated from chemical evo-lution models (>0.5 billion years: e.g., Yoshii et al. 1996) and the low Type Ia supernova rate at low metallicity predicted by model calculations (Kobayashi et al. 1998), then large contribu-tions of this type of supernovae to extremely metal-poor stars in Sextans are not expected (even though the progenitors and nature of Type Ia supernovae are still controversial). This is supported by the low Ba abundances in the low Mg/Fe stars, indicating no significant contributions from intermediate-mass AGB stars that yield neutron-capture elements via the s-process. The time-scale of enrichment from intermediate mass stars is similar to, or shorter than, that from Type Ia supernovae. Hence, our con-clusion is that the low Mg/Fe abundances of five out of the six stars studied here are not a result of contributions from Type Ia supernovae.
The low Mg/Fe ratios could be due to Type II supernovae instead, those that yield a smaller amount of α-elements in this galaxy. For example, model calculations of massive star evolution and supernova nucleosynthesis predict that less mas-sive stars (e.g. ∼10 M⊙) produce lower Mg/Fe ratios (e.g.,
Woosley & Weaver 1995). Either the upper IMF is truncated, or perhaps the Type II supernovae ejecta from the highest masses is lost from the galaxy at early times. It should be noted that the existence of stars with high Mg/Fe (S15-19 in our sample, and S49 in Shetrone et al. 2001) suggests some range in the masses of Type II supernovae progenitors in this galaxy.
Whatever processes are responsible for the low α/Fe tios in the majority of our Sextans stars, these abundance ra-tios are clearly different from the majority of Galactic halo stars of the same metallicity. This result implies that classical dwarf spheroidal galaxies like Sextans do not resemble the building blocks of the main part of the Galactic halo, supporting the conclusion derived from the metallicity distribution functions. It should be noted, however, that a small number of extremely metal-poor stars in the Galactic halo also show low α/Fe ra-tios (e.g. McWilliam et al. 1995). These stars might have their origins in classical dwarf spheroidals that merged during some later phase of the Galactic halo formation. Further searches for lowα/Fe stars in the Galactic halo and detailed studies of their kinematics would help to address this question.
4.3. Enrichment of neutron-capture elements
The Ba is under-abundant in five extremely metal-poor stars in Sextans, including S49 that was studied by Shetrone et al. (2001). The Ba/Fe ratios of these stars are similar to that of HD 88609, which represents stars in the Galactic halo that are not strongly enriched by the r-process. In contrast, the remain-ing two extremely metal-poor stars in our sample show large and moderate excesses of this element.
Measurements of heavy neutron-capture elements for Galactic halo stars have revealed a rapid increase around at [Fe/H]∼ −3 (McWilliam et al. 1995; Honda et al. 2004; Aoki et al. 2005; Franc¸ois et al. 2007). The reason for this in-crease, in a very narrow range of metallicity, is unclear, but it does provide a strong constraint on the astrophysical site(s) of the r-process (e.g. Truran et al. 2002). One interpretation for the Ba enrichment at this metallicity is that the progenitors of core-collapse supernovae in which the r-process takes place are less massive stars (∼10M⊙), thus they only start to contribute at
[Fe/H]=−3. It is interesting that a similar enrichment pattern of Ba is found in the Sextans sample. The origin of the Ba excesses in the two Ba-enhanced stars could then be due to the r-process. If so, then this could have an impact on our understanding of the r-process, in general, since the star formation histories are ex-pected to have been quite different between the Galactic halo and the classical dwarf galaxies. For example, perhaps the progeni-tor mass is not the critical condition for the r-process, but instead the metallicity is the key to the r-process events. To confirm this hypothesis, measurements of other neutron-capture elements for the Ba-enhanced star S15-19 would be extremely helpful.
The high Ba abundances in the three Sextans stars at [Fe/H]∼ −2 (Shetrone et al. 2001) might be explained by a large contri-bution of the r-process with respect to Fe enrichment by Type II and/or Type Ia supernovae. However, the Ba/Nd ratios mea-sured by Shetrone et al. (2001) ([Ba/Nd]=−0.13 to+0.01) are between the values expected from the r-process (∼ −0.35) and the s-process (∼ +0.15). Thus, it is necessary to estimate the s-process versus the r-process contributions, e.g., through mea-surements of Eu for these objects.
4.4. Summary and concluding remarks
Our measurements of chemical abundances for six extremely metal-poor red giants in the Sextans dwarf spheroidal galaxy have revealed that the metallicity distribution of the low metal-licity end and α/Fe abundance ratios are significantly different from those of the main part of the Galactic halo. These results provide a new constraint on the understanding of the formation and evolution of this galaxy as well as on the roles of dwarf galaxies in the early Galaxy formation. In contrast, the Ba abun-dance ratios in these stars show similar scatter to that found in field stars. To understand consistently these difference and sim-ilarity between this dwarf galaxy and the Galactic halo, further observational studies for Sextans and other dwarf galaxies are strongly desired.
Acknowledgements. This work has been supported in part by a Grant-in-Aid
for Scientific Research by the Japanese Ministry of Education, Culture, Sports, Science and Technology (No. 19540245). W. A. is supported by a Grant-in-Aid for Science Research from JSPS (grant 18104003). AH thanks the Netherlands Foundation of Scientific Research (NWO) for financial support. KAV acknowl-edges funding from the National Sciences and Engineering Research Council of Canada.
References
Alonso, A., Arribas, S., & Mart´ınez-Roger, C. 1999, A&AS, 140, 261 Aldenius, M., Tanner, J. D., Johansson, S., Lundberg, H.,& Ryan, S. G. 2007,
A&A 461, 767-773
Andrievsky, S. M., Spite, M., Korotin, S. A., Spite, F. , Bonifacio, P., Cayrel, R., Hill, V., & Franc¸ois, P. 2007, A&A, 464, 10 81
Aoki, W., et al. 2005, ApJ, 632, 611
Aoki, W., Beers, T. C., Christlieb, N., Norris, J. E., Ryan, S. G., & Tsangarides, S. 2007a, ApJ, 655, 492
Asplund, M., Grevesse, N., & Sauval, A. J. 2005, ASP Conf. Ser. 336: Cosmic Abundances as Records of Stellar Evolution and Nucleosynthesis, 336, 25 Battaglia, G., Irwin, M., Tolstoy, E., Hill, V., Helmi, A., Letarte, B., & Jablonka,
P. 2008, MNRAS, 383, 183
Beers, T. C., & Christlieb, N. 2005, ARA&A, 43, 531 Carney, B. W. 1983, AJ, 88, 610
Castelli, F., & Kurucz, R. L. 2003, Modelling of Stellar Atmospheres, 210, 20 Cayrel, R. et al. 2004, A&A, 416, 1117
Frebel, A., Simon, J. D., Geha, M., & Willman, B. 2009, arXiv:0902.2395 Fulbright, J. P., Rich, R. M., & Castro, S. 2004, ApJ, 612, 447
Fulbright, J. P. 2000, AJ, 120, 1841 Helmi, A., et al. 2006, ApJ, 651, L121
Hodgkin, S. T., Irwin, M. J., Hewett, P. C., & Warren, S. J. 2009, MNRAS, 394, 675
Honda, S., Aoki, W., Ishimaru, Y., & Wanajo, S. 2007, ApJ, 666, 1189 Honda, S., Aoki, W., Kajino, T., Ando, H., Beers, T. C., Izumiura, H., Sadakane,
K., & Takada-Hidai, M. 2004, ApJ, 607, 474
Irwin, M., & Lewis, J. 2001, New Astronomy Review, 45, 105 Irwin, M. J., et al. 2004, Proc. SPIE, 5493, 411
Kim, Y.-C., Demarque, P., Yi, S. K., & Alexander, D. R. 2002, ApJS, 143, 499 Kirby, E. N., Simon, J. D., Geha, M., Guhathakurta, P., & Frebel, A. 2008, ApJ,
685, L43
Kobayashi, C., Tsujimoto, T., Nomoto, K., Hachisu, I., & Kato, M. 1998, ApJ, 503, L155
Franc¸ois, P., et al. 2007, A&A, 476, 935
Koch, A., McWilliam, A., Grebel, E. K., Zucker, D. B., & Belokurov, V. 2008, ApJ, 688, L13
Kraft, R. P. 1994, PASP, 106, 553
Kurucz, R. 1993, ATLAS9 Stellar Atmosphere Programs and 2 km/s grid. Kurucz CD-ROM No. 13. Cambridge, Mass.: Smithsonian Astrophysical Observatory, 1993, 13
Lai, D. K., Bolte, M., Johnson, J. A., Lucatello, S., Heger, A., & Woosley, S. E. 2008, ApJ, 681, 1524
Lawrence, A., et al. 2007, MNRAS, 379, 1599 Mateo, M. L. 1998, ARA&A, 36, 435
McWilliam, A., Preston, G. W., Sneden, C., & Searle, L. 1995, AJ, 109, 2757 Moity, J. 1983, A&AS, 52, 37
Noguchi, K., et al. 2002, PASJ, 54, 855
Norris, J. E., Gilmore, G., Wyse, R. F. G., Wilkinson, M. I., Belokurov, V., Evans, N. W., & Zucker, D. B. 2008, ApJ, 689, L113
Pagel, B. E. J., & Patchett, B. E. 1975, MNRAS, 172, 13 Pickering, J. C., Thorne, A. P., & Perez, R. 2001, ApJS, 132, 403
Reddy, B. E., Lambert, D. L., & Allende Prieto, C. 2006, MNRAS, 367, 1329 Reddy, B. E., Tomkin, J., Lambert, D. L., & Allende Prieto, C. 2003, MNRAS,
340, 304
Ryabchikova, T. A., Hill, G. M., Landstreet, J. D., Piskunov, N., & Sigut, T. A. A. 1994, MNRAS, 267, 697
Sadakane, K., Arimoto, N., Ikuta, C., Aoki, W., Jablonka, P., & Tajitsu, A. 2004, PASJ, 56, 1041
Schlegel, D., Finkbeiner, D., & Davis, M. 1998, ApJ, 500, 525 Shetrone, M. D. 1996a, AJ, 112, 1517
Shetrone, M. D. 1996b, AJ, 112, 2639
Shetrone, M. D., Cote, P., Sargent, W. L. W. 2001, ApJ, 548, 592
Shetrone, M., Venn, K. A., Tolstoy, E., Primas, F., Hill, V., & Kaufer, A. 2003, AJ, 125, 684
Skrutskie, M. F., et al. 2006, AJ, 131, 1163 Spite, M., et al. 2005, A&A, 430, 655
Stephens, A., & Boesgaard, A. M. 2002, AJ, 123, 1647
Takeda, Y., Zhao, G., Takada-Hidai, M., Chen, Y.-Q., Saito, Y.-J., & Zhang, H.-W. 2003, Chinese Journal of Astronomy and Astrophysics, 3, 316
Truran, J. W., Cowan, J. J., Pilachowski, C. A., & Sneden, C. 2002, PASP, 114, 1293
Tsujimoto, T. & Shigeyama, T. 2002, ApJ, 571, L93
Venn, K. A., Irwin, M., Shetrone, M. D., Tout, C. A., Hill, V., & Tolstoy, E. 2004, AJ, 128, 1177
Woosley, S. E., & Weaver, T. A. 1995, ApJS, 101, 181 Yoshii, Y., Tsujimoto, T., & Nomoto, K. 1996, ApJ, 462, 266
Fig. 1. Observed spectra of the three Sextans objects S 11-37, S12-28, and S15-19 for three wavelength ranges (dots). Synthetic spectra calculated for the derived Mg, Sc, Fe and Ba abundances (Table 4) are also shown.
Fig. 2. Mg abundance ratio ([Mg/Fe]) as a function of iron abundance ([Fe/H]). Our Sextans stars are depicted by filled circles with error bars, while other Sextans stars studied by Shetrone et al. (2001) are shown by filled diamonds. Our re-sult for the comparison star HD 88609 is plotted by the large open circle. The abundances of Galactic halo stars are shown by open circles (Cayrel et al. 2004), asterisks (Honda et al. 2004; Aoki et al. 2005), crosses (Stephens & Boesgaard 2002), and small circles (Fulbright 2000), while thick and thin disk stars studied by Reddy et al. (2003, 2006) are shown by plus symbols.
Fig. 3. The same as Fig.2, but for [Ca/Fe] (top) and [Mg/Ca]
(bottom).
Fig. 4. The same as Fig.2, but for [Na/Fe] (top) and [Na/Mg]
(bottom).
Fig. 5. The same as Fig.2, but for [Ba/Fe]. The open circles mean
Table 1. Objects and observation details
Star RA(2000) Dec(2000) Observation exposurea S/Nb V
H( km s−1) HJD S 10–14 10 13 34.70 −02 07 57.9 Jan 2007 330 (11) 36 233.86±0.08 2454126 S 11–13 10 11 42.96 −02 03 50.4 Jan 2007 60 (2) 21 224.71±0.08 2454128 S 11–37 10 13 45.48 −01 56 16.3 Jan 2007 240 (8) 32 221.79±0.08 2454128 S 12–28 10 11 17.15 −02 00 24.0 Jan 2007 240 (8) 39 201.96±0.05 2454126 S 14–98 10 13 24.48 −02 12 03.5 Jan 2007 85 (3) 17 220.7±0.13 2454128 S 15–19 10 11 26.92 −02 05 41.7 May 2005 390 (13) 46 226.05±0.11 2453511 HD 88609 10 14 28.98 +53 33 39.4 Jan 2007 10.5 (4) 440 −37.58±0.02 2454126 S 10–12c 10 13 52.1 −02 02 55.1 Jan 2007 30 (1) 11 ... 2454126 S 11–36c 10 13 45.5 −01 56 16.3 Jan 2007 240 (8) 8 ... 2454126 a Total exposure time (minutes) and the number of exposures.
b S/N ratio per 1.8 km s−1pixel at 5180 Å.
c These stars were observed, but are not included in the present work (see text).
Table 2. Photometry data and stellar parameters
Star V V−I K E(B−V) Teff(V−K) Teff(V−I) Teff(adopted) log g [Fe/H] vmicro
(K) (K) (K) km s−1 S 10–14 17.64 1.08 15.08 0.038 4619 4700 4620 1.2 −2.7 2.2 S 11–13 17.53 1.15 14.71 0.038 4399 4559 4400 0.6 −2.8 2.4 S 11–37 17.96 1.06 15.34 0.038 4564 4742 4560 1.3 −2.9 2.2 S 12–28 17.52 1.08 14.91 0.038 4574 4700 4570 1.4 −2.8 2.7 S 14–98 18.06 1.00 15.61 0.038 4725 4877 4730 1.1 −2.7 2.8 S 15–19 17.54 1.01 14.98 0.038 4619 4854 4620 1.2 −3.1 2.6 HD 88609 8.58 1.12 6.01 0.000 4522 4517 4520 1.1 −3.0 2.5
Table 4. Elemental abundances
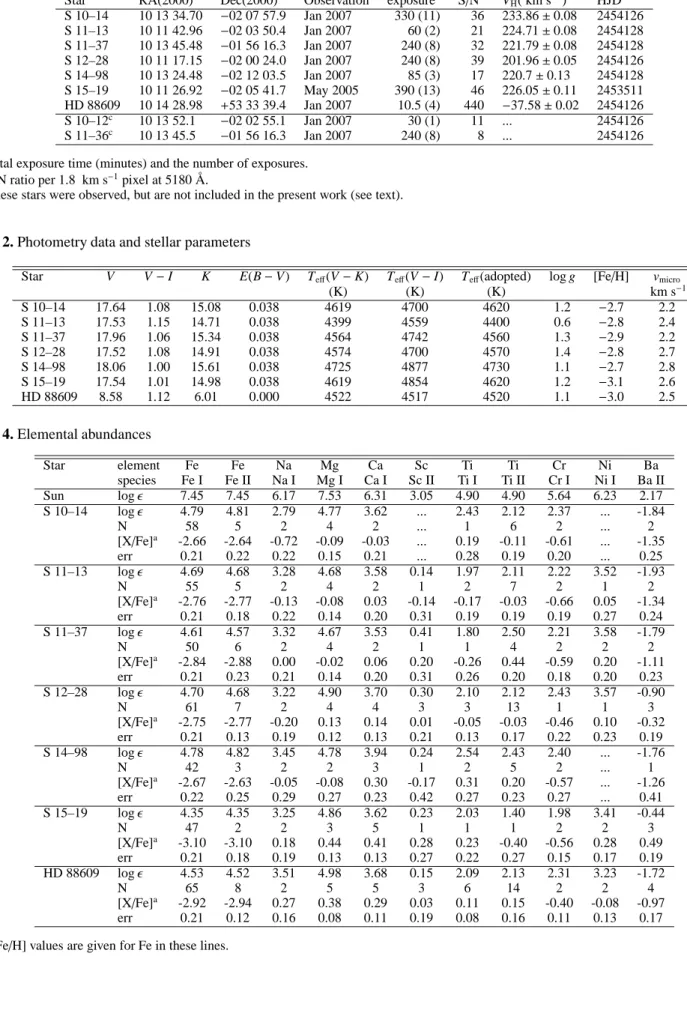
Star element Fe Fe Na Mg Ca Sc Ti Ti Cr Ni Ba species Fe I Fe II Na I Mg I Ca I Sc II Ti I Ti II Cr I Ni I Ba II Sun logǫ 7.45 7.45 6.17 7.53 6.31 3.05 4.90 4.90 5.64 6.23 2.17 S 10–14 logǫ 4.79 4.81 2.79 4.77 3.62 ... 2.43 2.12 2.37 ... -1.84 N 58 5 2 4 2 ... 1 6 2 ... 2 [X/Fe]a -2.66 -2.64 -0.72 -0.09 -0.03 ... 0.19 -0.11 -0.61 ... -1.35 err 0.21 0.22 0.22 0.15 0.21 ... 0.28 0.19 0.20 ... 0.25 S 11–13 logǫ 4.69 4.68 3.28 4.68 3.58 0.14 1.97 2.11 2.22 3.52 -1.93 N 55 5 2 4 2 1 2 7 2 1 2 [X/Fe]a -2.76 -2.77 -0.13 -0.08 0.03 -0.14 -0.17 -0.03 -0.66 0.05 -1.34 err 0.21 0.18 0.22 0.14 0.20 0.31 0.19 0.19 0.19 0.27 0.24 S 11–37 logǫ 4.61 4.57 3.32 4.67 3.53 0.41 1.80 2.50 2.21 3.58 -1.79 N 50 6 2 4 2 1 1 4 2 2 2 [X/Fe]a -2.84 -2.88 0.00 -0.02 0.06 0.20 -0.26 0.44 -0.59 0.20 -1.11 err 0.21 0.23 0.21 0.14 0.20 0.31 0.26 0.20 0.18 0.20 0.23 S 12–28 logǫ 4.70 4.68 3.22 4.90 3.70 0.30 2.10 2.12 2.43 3.57 -0.90 N 61 7 2 4 4 3 3 13 1 1 3 [X/Fe]a -2.75 -2.77 -0.20 0.13 0.14 0.01 -0.05 -0.03 -0.46 0.10 -0.32 err 0.21 0.13 0.19 0.12 0.13 0.21 0.13 0.17 0.22 0.23 0.19 S 14–98 logǫ 4.78 4.82 3.45 4.78 3.94 0.24 2.54 2.43 2.40 ... -1.76 N 42 3 2 2 3 1 2 5 2 ... 1 [X/Fe]a -2.67 -2.63 -0.05 -0.08 0.30 -0.17 0.31 0.20 -0.57 ... -1.26 err 0.22 0.25 0.29 0.27 0.23 0.42 0.27 0.23 0.27 ... 0.41 S 15–19 logǫ 4.35 4.35 3.25 4.86 3.62 0.23 2.03 1.40 1.98 3.41 -0.44 N 47 2 2 3 5 1 1 1 2 2 3 [X/Fe]a -3.10 -3.10 0.18 0.44 0.41 0.28 0.23 -0.40 -0.56 0.28 0.49 err 0.21 0.18 0.19 0.13 0.13 0.27 0.22 0.27 0.15 0.17 0.19 HD 88609 logǫ 4.53 4.52 3.51 4.98 3.68 0.15 2.09 2.13 2.31 3.23 -1.72 N 65 8 2 5 5 3 6 14 2 2 4 [X/Fe]a -2.92 -2.94 0.27 0.38 0.29 0.03 0.11 0.15 -0.40 -0.08 -0.97 err 0.21 0.12 0.16 0.08 0.11 0.19 0.08 0.16 0.11 0.13 0.17 a[Fe/H] values are given for Fe in these lines.
Fig. 6. Comparison of [Fe/H] derived by this work and results from by the Ca triplet by Helmi et al. (2006) (filled circles) and Battaglia et al. (2008) (open circles). The typical errors are pre-sented in the plot. The agreement between the estimates from the Ca triplet and from the high resolution spectroscopy is good, with the exception of S 15–19 for which a lower [Fe/H] is de-rived from our high resolution study.
Table 5. Abundance changes by changing stellar parameters δ(Teff) δ(log g) δ([Fe/H]) δ(vmicro)
+150 K +0.3 dex +0.3 dex +0.3 km s−1 Fe I 0.19 −0.04 0.00 −0.06 Fe II 0.02 0.08 0.00 −0.05 Na I 0.03 −0.05 −0.02 −0.09 Mg I −0.02 −0.04 0.00 −0.01 Ca I −0.07 0.01 0.01 0.04 Sc II −0.12 0.12 0.00 0.04 Ti I 0.00 0.00 0.01 0.04 Ti II −0.12 0.11 0.00 −0.01 Cr I 0.01 −0.01 0.00 −0.03 Ni I −0.05 0.02 0.01 0.06 Ba II −0.08 0.12 0.00 0.05
Table 6. Abundance changes by changing stellar parameters
Object [Fe/H] [Fe/H](Ca triplet)
(this work) Helmi et al. (2006) Battaglia et al. (2008)a S 10–14 −2.66±0.21 −2.62 −2.77 S 11–13 −2.76±0.21 −2.51 −2.66 S 11–37 −2.84±0.21 −2.66 −2.81 S 12–28 −2.75±0.21 −2.55 −2.70 S 14–98 −2.67±0.22 −2.53 −2.68 S 15–19 −3.10±0.21 −2.56 −2.71 aValues calculated from the calibration of Battaglia et al. (2008).
Table 3. Equivalent widths λ(Å) χ(eV) log(gf) S 10-14 S 11-13 S 11-37 S 12-28 S 14-98 S 15-19 HD088609 Na I 5889.95 0.00 0.12 124.6 158.3 153.0 168.6 165.0 153.6 179.4 Na I 5895.92 0.00 -0.18 90.7 149.4 137.3 142.2 149.9 137.6 156.9 Mg I 4571.10 0.00 -5.39 52.7 62.3 61.1 79.9 ... ... 81.1 Mg I 4702.99 4.33 -0.38 ... ... ... ... ... ... 63.6 Mg I 5172.68 2.71 -0.45 163.1 175.4 158.7 190.9 152.8 184.1 195.5 Mg I 5183.60 2.72 -0.24 175.1 182.3 164.9 229.6 201.9 190.4 223.2 Mg I 5528.40 4.35 -0.34 54.4 52.7 56.2 67.3 55.7 55.4 69.2 Ca I 5588.75 2.53 0.20 ... ... ... 51.8 ... 45.0 43.3 Ca I 6102.72 1.88 -0.79 ... ... ... ... 55.1 27.1 31.2 Ca I 6122.22 1.89 -0.31 44.4 60.7 47.6 51.4 58.8 40.7 60.0 Ca I 6162.17 1.90 -0.09 66.8 65.9 60.2 79.1 75.8 73.8 73.9 Ca I 6462.57 2.52 0.31 ... ... ... 52.2 ... 32.5 50.6 Ti I 4981.73 0.85 0.56 ... ... 37.1 57.4 81.0 47.8 52.9 Ti I 4991.06 0.84 0.44 ... ... ... 45.8 ... ... 49.2 Ti I 5007.21 0.82 0.17 48.4 35.0 ... 41.9 44.2 ... 41.7 Ti I 5192.97 0.02 -0.95 ... 30.5 ... ... ... ... 31.9 Cr I 5206.04 0.94 0.02 62.6 81.4 73.5 92.8 78.9 56.5 76.5 Cr I 5208.42 0.94 0.16 97.2 91.8 79.9 104.4 90.1 66.8 102.5 Mn I 4823.50 2.32 0.14 ... ... ... 28.1 ... ... 15.7 Fe I 4871.32 2.87 -0.36 64.7 ... 50.6 79.8 128.2 50.0 66.1 Fe I 4872.14 2.88 -0.57 60.8 ... ... 73.1 ... 45.9 55.9 Fe I 4890.75 2.88 -0.39 67.8 80.1 74.8 95.2 ... 42.2 ... Fe I 4891.49 2.85 -0.11 82.7 ... 60.8 95.0 ... ... 80.9 Fe I 4903.31 2.88 -1.08 ... ... ... ... ... ... 38.8 Fe I 4918.99 2.85 -0.34 72.6 88.3 76.0 82.0 82.2 61.3 69.8 Fe I 4920.50 2.83 0.07 106.1 114.3 92.7 98.1 89.7 79.5 92.2 Fe I 4938.81 2.88 -1.08 ... ... ... 47.9 ... ... 32.5 Fe I 4939.69 0.86 -3.25 56.8 ... ... 78.1 78.5 ... 63.2 Fe I 4957.60 2.81 0.23 ... 106.1 ... ... 105.6 85.0 112.4 Fe I 4994.13 0.92 -3.08 ... ... 72.5 ... ... ... 74.8 Fe I 5006.12 2.83 -0.64 48.8 52.7 65.6 ... 68.3 46.5 57.6 Fe I 5012.07 0.86 -2.64 84.5 112.2 104.3 132.2 105.2 86.9 105.1 Fe I 5041.76 1.49 -2.20 68.3 71.2 79.0 104.1 86.8 53.2 83.4 Fe I 5049.82 2.28 -1.42 72.6 69.1 66.9 73.5 75.8 41.4 62.6 Fe I 5051.63 0.92 -2.80 92.7 102.9 101.2 110.0 70.6 ... 93.9 Fe I 5068.77 2.94 -1.23 ... 48.4 46.8 28.0 ... ... 29.0 Fe I 5079.22 2.20 -2.07 42.0 ... ... 54.0 ... ... 33.8 Fe I 5079.74 0.99 -3.22 74.1 97.6 ... 85.2 ... 41.8 59.5 Fe I 5083.34 0.96 -2.96 77.2 106.6 80.6 90.1 ... 61.1 79.0 Fe I 5123.72 1.01 -3.07 75.3 86.1 ... 77.9 ... 37.6 70.6 Fe I 5125.12 4.22 -0.14 25.6 ... ... ... ... ... ... Fe I 5127.36 0.92 -3.31 ... 74.3 71.2 79.4 75.8 42.8 62.4 Fe I 5133.69 4.18 0.14 34.8 ... ... ... ... ... 23.0 Fe I 5142.93 0.96 -3.08 87.0 91.4 76.1 79.3 79.8 48.8 69.8 Fe I 5150.84 0.99 -3.07 68.2 64.0 46.3 75.0 ... 45.9 ... Fe I 5151.91 1.01 -3.32 57.0 73.2 58.7 64.5 ... 41.3 52.3 Fe I 5162.27 4.18 0.02 ... ... ... 30.1 ... ... 19.0 Fe I 5166.28 0.00 -4.20 92.0 80.2 77.0 110.2 83.5 73.7 86.4 Fe I 5171.60 1.49 -1.79 94.5 121.2 90.0 106.6 89.0 91.3 104.3 Fe I 5191.46 3.04 -0.55 63.7 59.5 63.3 54.7 44.0 ... 47.9 Fe I 5192.34 3.00 -0.42 60.3 70.0 61.3 62.3 ... ... 56.3 Fe I 5194.94 1.56 -2.09 84.2 95.7 73.1 ... 72.1 52.4 83.1 Fe I 5198.71 2.22 -2.13 ... ... ... 50.3 ... ... 25.9 Fe I 5202.34 2.18 -1.84 79.2 86.0 ... 57.0 104.4 ... 47.0 Fe I 5216.27 1.61 -2.15 79.9 99.3 69.1 83.4 65.3 49.2 74.3 Fe I 5225.53 0.11 -4.79 47.0 67.0 ... 42.1 61.0 ... ... Fe I 5232.94 2.94 -0.06 84.9 88.2 96.1 85.5 60.7 58.0 81.8 Fe I 5250.65 2.20 -2.05 38.0 65.1 ... 47.1 ... 28.5 31.1 Fe I 5266.56 3.00 -0.39 76.0 81.8 76.4 ... ... 32.7 60.6 Fe I 5269.54 0.86 -1.32 174.5 156.3 149.2 180.1 ... 148.4 ...
Table 3. continued. λ(Å) χ(eV) log(gf) S 10-14 S 11-13 S 11-37 S 12-28 S 14-98 S 15-19 HD088609 Fe I 5270.36 1.61 -1.51 113.7 129.1 109.2 141.6 ... 108.3 133.6 Fe I 5281.79 3.04 -1.02 ... 48.8 ... 50.4 ... ... 34.0 Fe I 5324.18 3.21 -0.24 80.8 80.3 66.9 77.3 ... 53.7 60.4 Fe I 5328.04 0.92 -1.47 138.7 175.0 132.1 160.6 122.3 159.4 158.7 Fe I 5328.53 1.56 -1.85 109.0 124.8 101.6 98.7 100.7 78.8 100.2 Fe I 5332.90 1.56 -2.94 61.3 67.1 45.4 43.1 36.1 ... 35.5 Fe I 5339.93 3.27 -0.68 ... 49.3 ... 37.8 67.8 26.0 ... Fe I 5341.02 1.61 -2.06 98.8 106.5 75.3 105.5 103.3 81.6 89.4 Fe I 5371.49 0.96 -1.64 ... 170.5 137.5 154.9 154.7 120.5 147.8 Fe I 5397.13 0.92 -1.99 138.6 140.0 99.3 164.3 127.6 125.3 134.8 Fe I 5405.77 0.99 -1.84 92.8 157.5 ... 156.0 120.0 117.4 137.2 Fe I 5429.70 0.96 -1.88 127.2 141.9 123.6 141.6 153.4 107.8 140.3 Fe I 5434.52 1.01 -2.12 98.8 131.6 97.7 134.6 133.6 103.8 123.5 Fe I 5446.92 0.99 -1.93 127.1 145.6 131.6 ... 129.1 114.5 ... Fe I 5455.61 1.01 -2.09 145.9 160.8 134.2 150.6 154.3 122.2 138.4 Fe I 5497.52 1.01 -2.85 88.7 106.4 87.1 100.2 104.5 70.8 86.3 Fe I 5501.46 0.96 -2.95 86.8 94.8 95.8 85.6 56.5 58.2 79.8 Fe I 5506.78 0.99 -2.80 95.0 117.2 94.9 106.4 97.7 82.3 92.5 Fe I 5569.62 3.42 -0.54 ... ... ... 34.0 ... 29.5 26.9 Fe I 5572.84 3.40 -0.31 ... 36.2 ... ... 40.1 ... 38.4 Fe I 5586.76 3.37 -0.14 58.9 71.3 47.3 57.9 57.5 ... 50.0 Fe I 5615.64 3.33 -0.14 64.0 66.6 55.8 71.8 42.9 55.0 60.9 Fe I 6136.62 2.45 -1.40 59.1 61.7 60.2 ... ... 37.9 53.4 Fe I 6137.69 2.59 -1.40 50.1 71.8 50.4 62.4 57.7 20.3 44.1 Fe I 6191.56 2.43 -1.60 70.5 55.6 53.2 61.1 62.9 35.1 51.2 Fe I 6230.72 2.56 -1.28 ... ... ... 75.7 ... ... 55.4 Fe I 6335.33 2.20 -2.23 37.5 54.2 28.0 45.3 32.5 ... 29.0 Fe I 6393.60 2.43 -1.62 47.3 ... 50.6 60.7 50.5 ... 48.0 Fe I 6421.35 2.28 -2.03 39.9 ... ... 32.2 ... ... 35.2 Fe I 6430.85 2.18 -2.01 64.5 ... 54.2 42.2 ... 31.0 45.5 Fe I 6677.99 2.69 -1.47 55.7 69.1 38.3 49.7 ... ... 37.9 Ni I 4714.41 3.38 0.26 ... ... 48.8 ... ... ... 20.9 Ni I 5137.07 1.68 -1.99 ... ... ... 32.9 ... ... 21.1 Ni I 5476.90 1.83 -0.89 ... 95.3 78.6 ... ... ... ... Sc II 4415.56 0.60 -0.67 ... ... ... 68.5 ... 70.2 63.7 Sc II 5031.02 1.36 -0.40 ... ... ... 32.6 ... ... 31.5 Sc II 5526.79 1.77 0.02 ... 35.7 35.9 35.9 27.9 ... 31.4 Ti II 4443.79 1.08 -0.72 102.0 101.4 138.6 99.8 ... ... 110.8 Ti II 4444.55 1.12 -2.24 ... ... 61.0 26.7 ... ... 40.2 Ti II 4450.48 1.08 -1.50 ... 123.5 102.2 67.2 ... ... 84.0 Ti II 4468.51 1.13 -0.60 91.7 144.5 ... 96.6 ... ... 111.0 Ti II 4501.27 1.12 -0.77 ... 76.4 ... 85.2 128.9 73.1 113.2 Ti II 4563.76 1.22 -0.69 ... 114.2 82.8 113.2 94.7 ... 112.6 Ti II 4571.97 1.57 -0.32 ... ... ... 88.7 ... ... 98.6 Ti II 4589.96 1.24 -1.62 50.2 ... ... 80.8 ... ... 66.5 Ti II 4657.20 1.24 -2.24 ... ... ... 50.3 ... ... 31.2 Ti II 4805.08 2.06 -0.96 46.9 40.2 ... ... ... ... 39.4 Ti II 5154.07 1.57 -1.78 ... 50.5 ... 40.9 45.3 ... 37.0 Ti II 5185.91 1.88 -1.37 ... ... ... 37.7 66.2 ... 30.0 Ti II 5226.54 1.57 -1.23 62.0 ... ... 76.9 ... ... 62.4 Ti II 5336.79 1.58 -1.59 40.9 ... ... 43.7 87.2 ... 44.5 Fe II 4508.29 2.86 -2.31 ... ... ... 47.3 ... ... 41.0 Fe II 4583.84 2.81 -1.74 ... 103.8 ... 75.1 ... ... 71.8 Fe II 4923.93 2.89 -1.21 76.3 111.3 73.2 97.2 106.3 82.5 97.4 Fe II 5018.43 2.89 -1.23 ... ... 63.0 ... ... ... 107.6 Fe II 5197.58 3.23 -2.35 56.9 ... 43.2 41.9 66.2 ... 27.9 Fe II 5234.63 3.22 -2.15 51.5 43.2 37.0 37.2 ... 23.1 33.0 Fe II 5275.99 3.20 -2.13 46.3 50.3 55.3 61.5 ... 23.1 39.8 Fe II 5316.62 3.15 -2.02 68.2 63.5 58.5 56.2 72.1 53.6 65.3 Ba II 4934.08 0.00 -0.15 50.7 89.0 86.5 158.3 90.3 177.9 85.7 Ba II 5853.69 0.60 -0.91 ... ... ... 39.1 ... 69.8 8.1
Table 3. continued.
λ(Å) χ(eV) log(gf) S 10-14 S 11-13 S 11-37 S 12-28 S 14-98 S 15-19 HD088609
![Figure 4 shows the [Na/Fe] and [Na/Mg] ratios for the Sextans sample and Galactic stars](https://thumb-us.123doks.com/thumbv2/123dok_us/1056687.2640323/4.918.66.837.88.1129/figure-shows-na-ratios-sextans-sample-galactic-stars.webp)
![Fig. 3. The same as Fig.2, but for [Ca/Fe] (top) and [Mg/Ca]](https://thumb-us.123doks.com/thumbv2/123dok_us/1056687.2640323/9.918.61.843.72.1131/fig-fig-ca-fe-mg-ca.webp)
![Fig. 6. Comparison of [Fe/H] derived by this work and results from by the Ca triplet by Helmi et al](https://thumb-us.123doks.com/thumbv2/123dok_us/1056687.2640323/11.918.65.435.79.464/fig-comparison-fe-derived-work-results-triplet-helmi.webp)
![Table 5. Abundance changes by changing stellar parameters δ(T eff ) δ(log g) δ([Fe/H]) δ(v micro ) +150 K +0.3 dex +0.3 dex +0.3 km s −1 Fe I 0.19 −0.04 0.00 −0.06 Fe II 0.02 0.08 0.00 −0.05 Na I 0.03 −0.05 −0.02 −0.09 Mg I −0.02 −0.04 0.00 −0.01 Ca I −0.0](https://thumb-us.123doks.com/thumbv2/123dok_us/1056687.2640323/12.918.89.421.117.312/table-abundance-changes-changing-stellar-parameters-eff-micro.webp)