Continuous user authentication using multi-modal biometrics
Hataichanok Saevanee1, Nathan Clarke 1, 3, Steven Furnell 1, 3, Valerio Biscione21
Centre for Security, Communications and Network Research,
2
Centre for Robotics and Neural Systems
Plymouth University, Plymouth, United Kingdom
3
Security Research Institute, Edith Cowan University,
Perth, Western Australia
Email: [email protected]
Abstract
As modern mobile devices are increasing in their capability and accessibility, they introduce additional demands in terms of security – particularly authentication. With the widely documented poor use of PINs, Active Authentication is designed to overcome the fundamental issue of usable and secure authentication through utilizing biometric-based techniques to continuously verify user identity. This paper proposes a novel text-based multimodal biometric approach utilizing linguistic analysis, keystroke dynamics and behavioural profiling. Experimental investigations show that users can be discriminated via their text-based entry, with an average Equal Error Rate (EER) of 3.3%. Based on these findings, a framework that is able to provide robust, continuous and trans-parent authentication is proposed. The framework is evaluated to examine the effectiveness of providing security and user convenience. The result showed that the framework is able to provide a 91% reduction in the number of intrusive authentication requests required for high security applications.
Keywords Biometrics, Transparent authentication, Multimodal biometrics, Linguistic profiling, Keystroke dynamics, Behavioural profiling, Mobile device
1 Introduction
It is commonly acknowledge that mobile devices have become part of an individual’s everyday life. Mobile devices are widespread with over 7 billion subscribers over the world [1]. With the rapid development of mobile network technology and the increasing popularity of mobile devices, modern mobile devices are capable of providing a wide range of services and applications over multiple networks. The plethora of functionalities offered by mobile devices enables user to store increasing amounts of wide range types of information from business to personal and sensitive data. A series of studies have highlighted the potential risk of mobile device misuse by storing personal information (e.g. home address), credentials (e.g. PIN codes, user name and password) and business data (e.g. customer data) [2, 3].
The most commonly used mobile authentication method for protecting devices being access is the use of Personal Identification Number (PINs) or passwords. Unfortunately, the poor use of passwords and PINs has been widely documented [4, 5] and a third of mobile users do not protect their devices with this simple technique [4]. In addition, the fundamental weakness of the PINs or
passwords is that as a point-of-entry technique, once the user has been authenticate successfully, they can access to the system without having to re-authenticate. This can be lead to high risk environment when an intruder targets a post authenticated session. Although many authentication mechanisms such as fingerprint or face recognition have been developed for mobile devices with the aim of increasing the level of security and convenient for the end user, these advanced techniques remain point of entry and intrusive to the user. Several studies have proposed an advanced authentication mechanism that can provide transparent and continuous authentication to the user by using behavioural biometrics [6-8]. According to these researchers, there are a number of biometrics that have the potential to be used for transparent authentication on mobile devices such as keystroke dynamics, behavioural profiling and gait recognition. Since texting is one of the most popular applications that mobile user uses on a daily basis [9]. Therefore, this paper focuses upon the use of three behavioural biometric techniques: linguistic profiling, keystroke dynamics and behaviour profiling for developing authentication mechanism that can provide a cost-effective, non-intrusive and continuous solution.
This paper begins by introducing the study and presenting the state of art in behavioural biometrics that has been applied within the mobile domain. This will then be followed by describing a comprehensive experimental study of multimodal biometrics. Based upon the results, a novel text-based multimodal framework that will provide the verification of a mobile user’s identify in a continuous and transparent manner is proposed and then evaluated through simulation. The paper concluded by highlighting the future direction of research.
2 An overview of behavioural biometrics for mobile devices
In recent years, many mobile devices come equipped with a number of hardware components that are able to capture a variety of biometric traits. This enables several biometric approaches to be deployed on them. For example, Apple has now incorporated TouchID, a finger-print-based approach, and Google has Face Unlock for its Android Operating System [10, 11]. To date, however, these physiological biometric techniques are mainly deployed to offer point-of-entry solutions that focus upon usability rather than security. In comparison, behavioural biometric methods have the ability to provide continuous and transparent verification of a user’s identity. However, behavioural biometric features tend to change over time and under different external circumstances that can affect the sample collection and classification. Therefore, care is required when considering their implementation in an authentication system where less control over the user and the environment exists.
A number of studies have been carried out on the use of behavioural techniques such as gait, hand writing and voice recognition for authentication on mobile devices. Of interest in this research is the use of three behavioural biometric techniques: linguistic profiling, keystroke dynamics and behavioural profiling. It is hypothesized that the integration of these three techniques together offers the opportunity to improve upon the usability through transparent capture, improved overall recognition performance and mitigation of samples due to unavailability at any given time.
Linguistic profiling is a behavioural biometric that identifies people based upon linguistic morphology [12]. A number of researchers have investigated the feasibility of linguistic profiling for several purposes such as text categorization, authorship identification and authorship verification. In the authorship verification domain, examples of writing from a single author are given to the system,
which is then asked to confirm if the given texts were written by this author. Over 1000 writing styles have been proposed and both statistical and machine learning methods were used in the analytical process [13]. Many studies have confirmed the good discriminating capability of linguistic features. By using a machine learning method, the performance accuracies were in the range of 80%-100% [12, 14]. However, there is no agreement on a best set of features for authorship verification and historically large volumes of text are required for the training dataset. The performance of linguistic profiling technique highly depends upon the number of candidate authors, the size of texts, the combination of the selected features and classification models utilized. Although the majority of previous studies tend to focus on long texts per author – 10,000 words per author are regarded to be a reliable minimum for an authorial set [15], some studies have shown promising results with short texts (e.g. student essay and email) but the minimum requirements for a text have not been determined [16, 17]
Behavioural profiling aims to identify users based upon the way in which they interact with the services on their mobile device. Previous behaviour-based studies have mainly focused upon the area of fraud detection and intrusion detection [18-22]. Research in mobile IDSs can be divided into two categories: call-based and mobility-based mechanisms. The former monitors user’s calling behaviour (e.g. start date of call and dial telephone number) that have been collected over a service provider’s network during a period of time [18, 19]. Based upon the theory that people have a predictable travelling pattern when they travel from one location to another, the mobility-based approach monitors a mobile user’s location activities to detect abnormal behaviour [20]. Through monitoring a user’s calling or location activities, behavioural-based IDS can offer a high detection rate and ability to detect unforeseen attacks [18-21]. Depending upon application types, profiling techniques and classification approach, a study by [7] showed that behavioural profiling could be used for authentication on mobile devices with accuracies of between 87% and 98%.
Keystroke dynamics identifies a user based upon the typing pattern of a user, looking at characteristics of their interaction with a keyboard. Based upon previous studies, two main characteristics were identified: inter-key and hold time [23]. The inter-key is the duration between two successive keys. The hold-time represents the duration between the press down and releasing of a single key. Many studies have shown it is feasible to authenticate users successfully based upon usernames and passwords (i.e. in parallel with a typical Windows login request), with a commercial product on the market utilizing this technology [24, 25]. More recent studies [6, 23] investigated the possibility of using keystroke dynamics on mobile devices, showing the possibility of key-stroke dynamic based authentication can be deployed in practice to provide an extra layer of security for mobile devices with an average accuracy of 87%.
Based upon the prior-art, these three techniques provide valuable discriminative information to permit identity authentication. All of the biometric traits of these three techniques can be captured during user interactions with a mobile device without explicit interaction to authenticate from the user. In addition, no additional hardware is required to deploy these techniques. As a result, these approaches arguably provide a cost effective and a non-intrusive solution for the mobile device. Furthermore, a significant amount of prior research within the point-of-entry authentication domain [26-29] has concluded that using multiple biometric modalities can improve accuracy and reliability of single-modal systems. For example, using combination of fingerprint and face modality can achieve better performance than using single biometric, improving the accuracy of 2.3% at 0.1% FAR
[29]. The next section will describe a feasibility study into the ability of individual and multi-modal biometrics to classify mobile user based upon text messaging.
3 Studying the feasibility of text-based multimodal biometrics
The study utilised SMS text messages as it is considered to represent a fair share of written communication, with over 9.8 trillion messages sent worldwide in 2012 [30]. On average, text messaging users send or received 35 messages per day. One challenge of author verification of SMS messages is the limited length of text messages which is limited to 160 characters. The short length of SMS messages may cause some identifying features in normal texts to be ineffective. However, SMS messages have some special characteristics which may help reveal the writing style of the author. Since the users have to find a way of being concise in their text message to communicate comprehensible messages within a limited length, this could manifest their own “text print” in their messages and subsequently be useful in forming suitable feature collection for discriminate between users.
3.1 Methodology
The experiments investigated the performance of linguistic profiling, keystroke dynamics and behavioural profiling. Based upon the findings, the final experiment investigated the performance of applying multimodal fusion of individual techniques to verify user’s identity.
3.1.1 Linguistic profiling
The purpose of this investigation is to determine the feasibility of identifying a user based on SMS messages. Given the importance the dataset has in ensuring appropriate features are identified, the research sought to examine two datasets. The first experiment employed a publicly available SMS corpus provided by the National University of Singapore [31]. The NUS SMS corpus consists of 26 users with a total of 1560 messages. The second experiment employed an SMS corpus provided by Plymouth University. The PU SMS dataset contains 487 messages from 30 users. Although more than 1000 features including lexical, syntactic, structural, content-specific, and idiosyncratic characteristics have been evaluated and compared in various studies. This research focused on features that cover a wide range of linguistic levels and are simple to measure. As a result, four types of linguistic features were employed to examine the linguistic profiling’s effectiveness: (1) user’s words profiling, (2) lexical, (3) syntactic and (4) structural. A brief description of each type of these features is given below:
User’s word profiling features: are collections of abbreviation and emotional words that are frequently used for each user.
Lexical features: can be divided into character-based or word-based features. In this study, character-based features used in [32] and word-length frequency features used in [32, 33] are investigated. In total, 33 lexical features were adopted into key feature set
Syntactic features: are used to measure an author’s writing style at the sentence level. The discriminative power of syntactic features is derived from people’s different habits of organizing sentence [14]. In total, 23 features were integrated into key feature set
Structural features: are used to measure the overall appearance and layout of the messages. In total, 8 features used in [32] were considered in this study.
In order to create individual user word profiling, special keywords such as abbreviation and emotion based words that a user uses in their message were selected as these special words may provide some useful insight into the identity of the author. By manually observing and analysing historical messages on NUS SMS corpus, a total of 317 abbreviation and emotional words were identified. For the PU SMS dataset, a total of 133 abbreviation and emotional words were named. For each message, a total 65 characteristics - the frequency distribution of abbreviations, emotional and user’s favourite words was used to create a single vector of user’s word profiling feature and 64 discriminating characteristics were extracted to create feature vectors.
3.1.2 Keystroke Analysis
The keystroke dataset used in this experiment provided by [23] as it contains keystroke dynamic data based on SMS text messages. A total 30 participants were obtained with a total of 900 text messages. The main traditional keystroke characteristics: hold-time and inter-key time were extracted to create feature vectors. The hold time vector constructed from five letters (E, T, A, O, N) and the inter-key time vector calculated from the latency between five pair of letters (‘t-g’, ‘e-p’, ’e-m’, ’h-d’, ’a-m’). The final dataset contains 3510 hold-time data and 1080 inter-key time data after outliers were removed (a standard procedure for keystroke analysis study). A number of analyses were undertaken using the FF-MLP neural network as it had demonstrated the better performance in previous studies over other techniques [23].
3.1.3 Behaviour Profiling
This study will focus on verifying users by the way in which they utilise a text messaging application. The experiment employed a public mobile usage dataset provided by the Massachusetts Institute of Technology (MIT) Reality Mining project [7]. The MIT dataset contains a rich amount of mobile user’s application activities over a long period of time: 106 participants enrolled for the data collection process from September 2004 to June 2005; among these participants, 49 participants’ text messaging activities were successfully logged. The experiment in this study utilised a subset of 30 participants whose text messaging activities occurred during the same period of 24/10/2004 - 21/11/2004. The following data were extracted to create feature vector: receiver’s telephone number and location of texting. A number of analyses were undertaken, using a Radial Basis Function (RBF) neural network as it had performed the best in the prior study [7].
To perform the classification for the individual techniques, the dataset was divided into two groups: 171 data samples were used for the testing set and the remainder was used for training. The pattern classification test was per-formed with one user acting as the valid user, while all others are acting as impostors (a standard procedure in this type of test) [6-8]. The Equal Error Rate (EER) was calculated to evaluate the system. The EER is the value where False Acceptance Rate (FAR) crosses the False Rejection Rate (FRR), and is typically used as a comparative measure within the biometric industry [34, 35].
Table 1 Final dataset used in the experiments
Training size Testing size Linguistic profiling 316 171 Keystroke dynamics 3339 171 Behaviour profiling 1178 171
3.1.4 Multimodal biometrics
The multimodal experiment was conducted using all possible combination of the three techniques. Since no multimodal database for these modalities exists, a standard practice employed within multi-biometrics is to combine the modalities from different datasets and create a virtual person [34]. An individual user from the linguistic profiling database was associated with an individual of keystroke and behavioural profiling database to create a virtual subject. As a result, a final database consisting of 30 users, each user having their SMS messages, keystroke and text messaging activity data was created and utilized in this experiment. The results of each technique were combined at the matching-level - as each technique utilized different classifiers and a different range of outputs, the min-max score normalization method was applied to scale the results of each technique into the range between 0 and 1 [35]. Based upon prior research, two fusion methods were utilized: simple sum and matcher weighting [34]. For the Simple Sum fusion, the raw score of each individual technique were simple added and rescaled into the 0 to 1 range. For the Matcher Weighting approach, weights are assigned to the individual matchers based on their individual EER. The weights are inversely proportional to the corresponding errors; the weights for less EER are higher than those of with a high EER.
3.2 Experimental results and discussion 3.2.1 Linguistic profiling
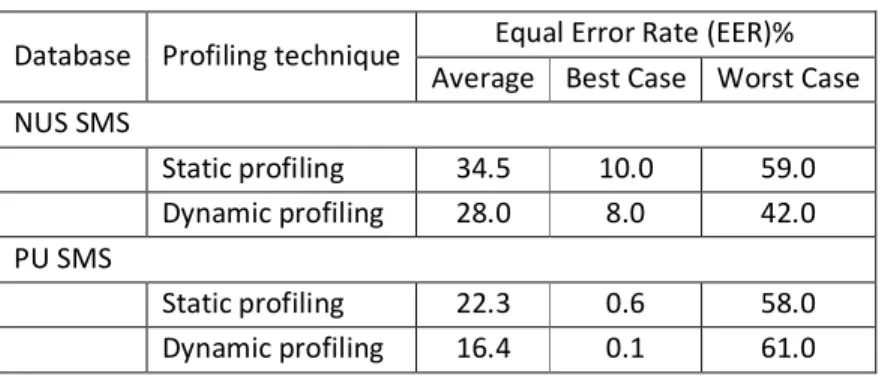
In order to analyse the impact of the linguistic features when evaluated in a multi-dimensional fashion, two types of profiling techniques: static and dynamic were employed. A static profiling technique utilised all of linguistic features to create a user profile. For dynamic profiling technique, the t-test ranking measure was utilized to rank input features according to its discriminative capability on a per user basis. From the ranking list, features with a p value less than 0.05 were selected to create input vectors. The key to utilizing the t-test was to ensure a set of features that was as unique to the individual authorized user in comparison to the wider population. Therefore, the number of linguistic features required for discrimination will vary between users. All experiments were examined using the most effective and well-known pattern classification: Feed-Forward Multi-Layered Perceptron (FF-MLP) neural network with an identical configuration to ensure a consistent and meaningful evaluation of the feature vector. The results are illustrated in Table 2.
Table 2Experiment results by employing linguistic profiling
Database Profiling technique Equal Error Rate (EER)% Average Best Case Worst Case NUS SMS Static profiling 34.5 10.0 59.0 Dynamic profiling 28.0 8.0 42.0 PU SMS Static profiling 22.3 0.6 58.0 Dynamic profiling 16.4 0.1 61.0
Based upon the above results, the static profiling approach showed that using all 65 linguistic features produced a fairly high EER or poor performance. A possible reason for this is that high dimensional input feature vector may contain a combination of positive, negative and no discriminative information. The dynamic profiling approach has performed significantly better than static profiling technique. This is expected since the input vector contains only strong discriminative features for each individual user. By employing a dynamic word profiling technique, individual user word profiling can be added or deleted over a period of time without affecting the user word profiling feature. Since a user’s typing style can change over time therefore by using a feature selection technique, a user profile can contain a user’s up to date discriminative information rather than using old features that might not be useful anymore. As a result, the dynamic profiling technique is the best solution to create user profile.
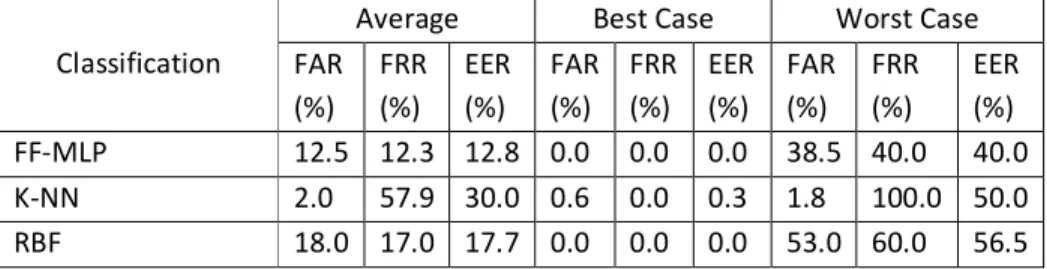
A further investigation was investigated in order to determine the optimal level of linguistic performance. As showed in previous researches, FF-MLP, K-Nearest Neighbour (K-NN) and Radial Basis Function (RBF) have shown the ability to deal efficiently with a high-dimensional and small size datasets [36-38]. Each of the classification algorithms performed numerous iterations, changing the various network parameters in order to optimise the performance of the classifier. In this study the SMS corpus provided by Plymouth University was used in the analytical process in order to maximise the number of users. The best overall performances from this experiment are illustrated in Table 3.
Table 3Experiment results by using the most successful network
Classification
Average Best Case Worst Case FAR (%) FRR (%) EER (%) FAR (%) FRR (%) EER (%) FAR (%) FRR (%) EER (%) FF-MLP 12.5 12.3 12.8 0.0 0.0 0.0 38.5 40.0 40.0 K-NN 2.0 57.9 30.0 0.6 0.0 0.3 1.8 100.0 50.0 RBF 18.0 17.0 17.7 0.0 0.0 0.0 53.0 60.0 56.5
The above three sets of results have demonstrated that the user can be discriminated by using linguistic characteristics with a good level performance. Among the three chosen classifiers, the KNN classifier gave the worst performance compared with the RBF and the FF-MLP neural networks. Although using an RBF neural network had a better classification performance, it was noticed that the RBF is very sensitive to network changes (based upon observations during the experimental study). The FF-MLP neural network archived the best overall performance. The smallest spread of performance between best and worst case suggested that this network provides more robust and stable network topology. However, this technique is the most intensive of the three techniques as it is required to perform a large number of training epochs.
3.2.2 Keystroke dynamics
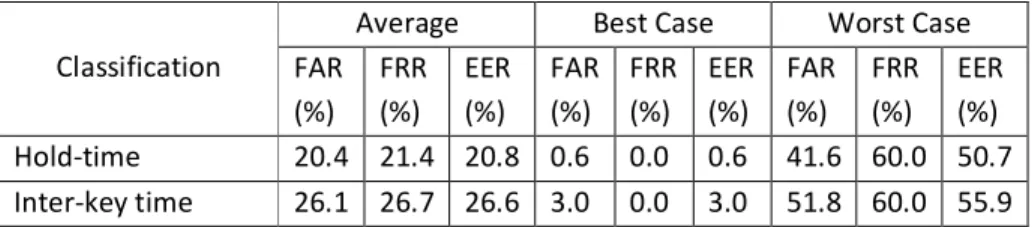
The experiment investigated the ability of the hold-time and inter-key time to classify user using different network configurations. As can be seen from Table 4, these two main traditional keystroke characteristics provide the valuable discriminative information to classify users. As the hold-time in this study was defined by the first key press down until the last key release, this immediately increased the range of values available in the feature vector. Therefore, it arguably makes the
classification process easier to discriminate between users. The study also showed that inter-keystroke characteristics did not perform very well in comparison. This may have been caused by the tactile interface. The keyboard used in this study is very small, with a more restricted keystroke interface thus reduced distance between the keys. In addition, the number of fingers utilised in typing are likely to be only one or two thumbs. Both of these factors restrict the typing dynamics, as the combination of the fingers in conjunction with the timing of the keystrokes and movement to achieve them, are reduced. This results in a smaller feature space for the inter-key characteristics to reside in and subsequently making it more difficult to distinguish between them.
Table 4Experiment results by using keystroke dynamics with the best FF-MLP network
Classification
Average Best Case Worst Case FAR (%) FRR (%) EER (%) FAR (%) FRR (%) EER (%) FAR (%) FRR (%) EER (%) Hold-time 20.4 21.4 20.8 0.6 0.0 0.6 41.6 60.0 50.7 Inter-key time 26.1 26.7 26.6 3.0 0.0 3.0 51.8 60.0 55.9
The results presented however, must consider that this feasibility study was performed in controlled conditions, with users entering data repeatedly. In practice, it is possible that the variability of the user’s input data could be larger as users might be walking or performing other tasks whilst they type. These factors would make classification more difficult. The authentication performance could be increased if the classification algorithm utilised a number of techniques to classify a user, capitalising on the specific content of the message. For example, the hold-time characteristics could be used together with inter-key latency to perform authentication based on commonly recurring static-words such as “hello” or “c u later” in order to provide better classification of the user [23]. Furthermore, user authentication can be performed by using either or both characteristics more than once within the same text message and the system responding on the combination of the results.
3.2.3 Behaviour profiling
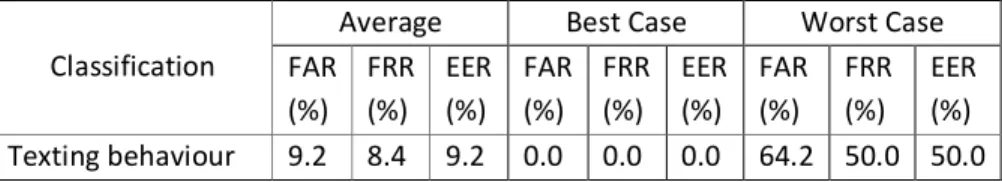
The result of using behaviour profiling to classify users is shown in Table 5. The result illustrates that utilising only two features: receiver’s telephone number and location of texting, some users can be discriminated form each other with a good degree of performance. One of the reasons behind this could be that people only send text messages to very close contacts. A minority of users achieved fairly high EERs. This may be caused by the number of samples assigned to the training of the classification was too small (and a limitation of the dataset). As such any authentication system that implements a behavioural profiling technique would also have to consider the small number of users that will experience a high EER to ensure both security and user convenience factors required by the overall system are met.
Table 5 Experiment results by using behaviour profiling with the best RBF network
Classification
Average Best Case Worst Case FAR (%) FRR (%) EER (%) FAR (%) FRR (%) EER (%) FAR (%) FRR (%) EER (%) Texting behaviour 9.2 8.4 9.2 0.0 0.0 0.0 64.2 50.0 50.0
As can be seen from the above three experimental studies, the results showed that the individual techniques can be used to discriminate users with relatively low error rates for a good proportion of participants. Behavioural profiling demonstrated the best individual performance using a single network configuration, with keystroke dynamics being the worst performer. A further analysis of individual user performances raises a number of interesting points. Foremost, that the best-case EERs are extremely good. However, it is noticeable that there are some users that experience very high error rates, reiterating the importance of multimodal approaches.
3.2.4 Multimodal biometrics
On the basis of the aforementioned experimental findings, it is evident that a number of users remain that are unable to be correctly authenticated to a reasonable degree. This problem can be potentially alleviated through the combination of two or more biometric approaches in order to enhance the overall performance of biometrics. The results of using the multimodal approach are shown in Table 6.
Table 6 Experiment results for text-based authentication Equal Error Rate (EER)% Average Best Case Worst Case Fusion by Sum
Multimodal (LP+BP) 5.5 0.0 30.6
Multimodal (KA+BP) 6.2 0.0 20.0
Multimodal (LP+KA) 11.2 0.0 45.0
All techniques 4.4 0.0 18.1
Fusion by Matcher Weighting
Multimodal (LP+BP) 3.6 0.0 20.0
Multimodal (KA+BP) 5.3 0.0 20.2
Multimodal (LP+KA) 8.5 0.0 44.7
All techniques (BP+LP+KA) 3.3 0.0 19.3
As seen in the Table 6, both of the two fusion methods lead to better performance than any of the individual classifiers. Generally, the Matcher Weighting technique outperforms the simple sum method. Whilst the results show that on average the use of more modalities leads to a better performance, this is not reflected within the individual user results. On occasions, it was noticed that users performed better when using two inputs (typically LP+BP) rather than three. Therefore in an operational environment care must be taken on selecting the most appropriate classifier. Examining
the individual worst-case performance, it can be seen that the multimodal models have significantly improved upon the error rates – further supporting the use of multimodal approaches.
4 A novel framework for multimodal biometrics on mobile devices
The concept of Transparent Authentication System (TAS) on mobile devices was first proposed in 2002 [39]. The framework utilizes a mixture of biometric techniques to verify a mobile user’s identity in a continuous and transparent manner. The framework is able to:
- To increase the authentication security beyond that offered by the secrete-knowledge based technique
- To provide transparent authentication manner for the user rather than intrusive to maximise user’s convenience
- To provide continuous verification of the user, ensuring that the protection can be maintained throughout the duration of usage
- To provide an authentication architecture that automatically works on all mobile devices regardless of hardware configuration, processing capability and network connectivity
A number of process engines and a security manager have been devised to achieve these objectives (as demonstrate in Figure 1). A detailed description of these processes is presented in the following sections. Data Collection Engine Input traits Authentication Manager Biometric Profile Engine Temporary Input Storage Profile Storage Authentication Engine Output Communication Engine Long-term Storage
Database
Process
Figure 1 Text-based multimodal framework 4.1 Processing engines
The primary role of the Data Collection Engine is to capture a user’s input text. When a user utilizes a text-based application on the mobile, information about the user’s typing, message writing style and the application usage are automatically collected by the Data Collection Engine and transformed into various biometric input samples. The captured input samples are then stored in the Temporary Input Storage to be used further in the authentication process by the authentication engine.
The main duty of the Biometric profiling engine is to generate the various biometric profile templates by using the combination of the user’s historical data and a number of template generation algorithms. The generated biometric templates will be stored in the Profile Storage and will be used in the verification process.
The main functionality of the Authentication Engine is to perform the user authentication process. The Authentication Engine has the ability to perform authentication for every permutation of inputs to ensure that authentication can be performed even if all of the three biometric samples are not presented (e.g. location may be not be able to be determined). When a verification process is required by the Authentication Manager, the Authentication Engine compares the input samples with the biometric templates to determine the legitimacy of the user. Once the verification process is completed, the verification result is appropriately processed by the Authentication Manager. If the verification result indicates the sample(s) came from authorized user, the sample(s) will be stored within the Profile Storage to be used for profile (re)generation; otherwise it will be deleted. A multibiometric authentication technique may produce a verification result that accepts the samples as coming from the authorized user even though the sample from one individual technique might be rejected as coming from an imposter. Since the overall decision was that the sample comes from the authorized user, the failed samples are deemed to be, in fact, from the authorized user and incorrectly failed. As such, these samples are added to the profile and are not deleted. In this way, the template re-training process can produce a more accurate profile that could provide better performance. This process overcomes a fundamental issue with biometric template re-training and ensuring the correct inclusion of relevant samples.
The framework can operate in both standalone and distributed modes to allow the framework to be useful for non-wireless and wireless devices. If the framework operates in client-server mode, the communication engine works as a bridge between the capture device and the comprehensive framework. When the framework operates in a standalone mode and the device is locked down, the communication engine sends a code to the user which they can use to unlock their device.
4.2 Security status element
The security status element is responsible for two main functions: providing security information to the user and to calculate the Security Status (SS) level. The security information includes the status of the security based on the SS level and the authentication results (whether failed or passed) of previous authentication requests. This information provides a guidance to the user in which how their device is utilised and therefore help them to identify possible misuse.
The SS level is a numerical value in the range of 0 and +51 with 0 indicating a low security level and +5 indicating a protected security level. When the device is initially switched on, the SS level is set to the security level of 0. This SS level is a continuous measure increasing and decreasing over the time during the user’s session. The SS level changes depending upon the performance of the authentication techniques. Each of the biometric authentication techniques are given a number which is added to (verify successfully) or subtracted from (verify unsuccessfully) the SS level to maintain the current SS level.
1
The time that has elapsed between authentication requests also affects the SS level. When a device with high SS level is not used for a period of time, the framework will automatically decrease the SS level accordingly. In this way, the opportunities of an imposter accessing more sensitive information could be significantly reduced. The actual period is set dependent upon individual user requirements. After each defined period of misuse the SS level decrease until the normal security level of 0 is reached.
In this proposed framework, each application will have its own security level. Applications or services that associated with private information or expensive services would require a high level of security whereas the normal application would requires a low level of security. This can be achieved either manually by the user or automatically by the system, using a database stored in the Long-term Storage. Prior research has investigated simple mechanisms by which these risk-based evaluations for applications can be made [40].
4.3 Security manager
The Authentication Manager is the central controller of the framework and provides the “intelligence”. The key task of the Authentication Manager is to monitor the security level and make authentication decisions when the user requests access to an application. It is the responsibility of the Authentication Manager to handle the security and user convenience trade-off. In order to achieve this, the Authentication Manager utilizes two processing algorithms: the System Security (SS) Level Automatic Update Algorithm and the Application Request Algorithm to manage the balance between the security of the mobile device and user convenience. These processes have been designed based upon a well-known study [23].
The Authentication Manager utilizes the SS Level Automatic Update Algorithm in order to periodically update the SS level based on the results of authentication decisions based upon the user’s input samples. The Authentication Manager periodically sends an authentication request to the Authentication Engine in order to update the SS level. The time interval in which the authentication should be requested depends upon the user’s preference (i.e. every 5 minutes). Initially, the Authentication Manager requires the Authentication Engine to perform authentication using the best set of the user’s input samples (i.e. utilizes the classifier with the lowest EER that samples exist for) from the last x minutes (i.e. 5 minutes). In a case where no user’s input data is presented, the Authentication Manager maintains the SS level at its latest updated value. However, if the Authentication Engine responds with a pass then the Authentication Manager updates the SS level and subsequently reverts back to monitoring mode. If not, the Authentication Manager decreases the SS level and sends an authentication request again by using the next best set of user’s input samples. The Authentication Manager will try three times to send an authentication request, every time with the next best available sample being employed. The Authentication Manager updates the SS level based upon the authentication result. The SS value is increased or decreased based on the type of sample used. For example, a sample using the keystroke dynamics technique will have an increment/decrement value of 0.5; a sample which contains both linguistic profiling and behaviour profiling will have an increment/ decrement value of 2. This numbers are based on the performance of the technique or combination of techniques. In scenarios where the updated SS level is less than 0, the Authentication Manager will set the SS level back to 0, meaning that the user will be able to access only the applications that do not required security. The process gives bias
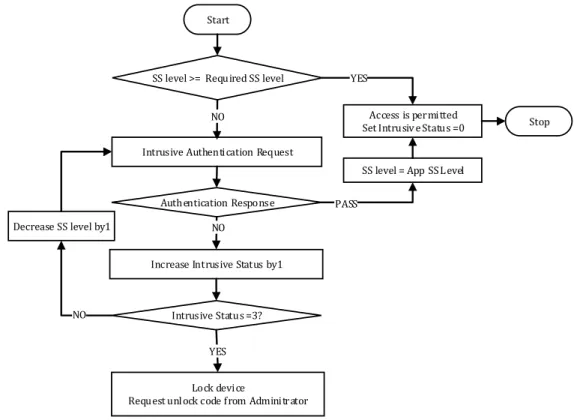
toward the user as they are given three non-intrusive chances to authenticate correctly and no intrusive authentication requests. This enables the system to minimize inconvenience to its user. Should the user attempt to access applications that require a SS level greater than the current SS level, the Authentication Manager will utilize the Application Request Algorithm to check the legitimacy of the user as shows in Figure 2.
SS level >= Required SS level
Authentication Response NO
PASS Intrusive Authentication Request
NO Start
Stop
Increase Intrusive Status by1
YES
Access is permitted Set Intrusiv e Status =0
Intrusive Status =3? NO
YES
Lock device
Request unl ock code f rom Adminitrator Decrease SS level by1
SS level = App SS L evel
Figure 2 Application Request Algorithm
The current SS level of the user is compared with the security level of the requested application. If the level is equal to or greater than the security level of the required application, the user can automatically access the application. Otherwise the user will be asked intrusively to authenticate. If the authentication response to this intrusive request fails to pass, the device is locked. Otherwise, the level of the user will be up-dated to the security level of the requested application and access will be granted.
5 Evaluation
In order to understand the performance of the framework, two aspects of framework: security and user convenience would be examined. Due to the lack of public datasets, the effectiveness of the proposed framework was evaluated via a simulation approach (using the MATLAB environment). The simulation process involves implementing a virtual user and applying the SS level Automatic update Algorithm and the Application Request Algorithms.
To evaluate the performance of the security mechanisms to an authorized user, three different usage levels (infrequent, moderate and frequent) will be investigated - as the level of usage will have a direct impact on the availability of biometric samples and thus the capability of the system to
maintain the security level. The use of the mobile device is simulated using a flow of timeslots. Each time slot can be seen as a minute in real life. Within each time slot the user can do one of two actions, or both: provide an input sample (thus simulating a text-based entry) or the use an app. To simulate different types of users, the probability of these actions occurring will be changed. There are 6 different types of applications that can be chosen by the user (reflecting the possible security levels of an application from 0 to 5). Each type of application has the same probability of being accessed. Similarly, there are 7 different non-intrusive techniques (see Table 7). Given that within a time slot the user provides an input sample, each type of technique has the same probability of occurring.
All non-intrusive techniques are evaluated based upon the EER of each authentication technique as demonstrated in the experimental result section and shown in Table 7. This means that, when the system evaluates a sample, there is a probability (equal to the EER of the technique) that an authorized user will be rejected or an imposter will be authorized. With regards to the intrusive authentication requests, the probability of an authorized user and impostor being rejected and accepted respectively is set to 0.03. This approach to the methodology removes any bias and provides for a randomly generated dataset with a mix of samples, performances and application requests across three usage scenarios. To further remove any bias that would exist from a single run of the simulation, the simulation is repeated.
In order to examine the ability of the system security to prevent an imposter from using the mobile device, two scenarios were simulated: an imposter using a mobile device at the initial state (SS =0) and the imposter using a mobile device starting from a high level of security (SS=5). This can simulate an imposter taking control a mobile device which has just been used by the authorized user.
The performance of the framework can be influenced by the frequency of mobile usage and verification time. Therefore, the evaluation soughs to analyse the effect these parameters have upon on the performance. The security system will work as described in the Security Manager session. The SS level will be increased or decreased based upon the success or failure of authentication attempt, using the values shown in Table 7. If the mobile device is not used for 10 minutes consecutively, the SS will be decreased by 0.05 for every following minute, until the system is used again.
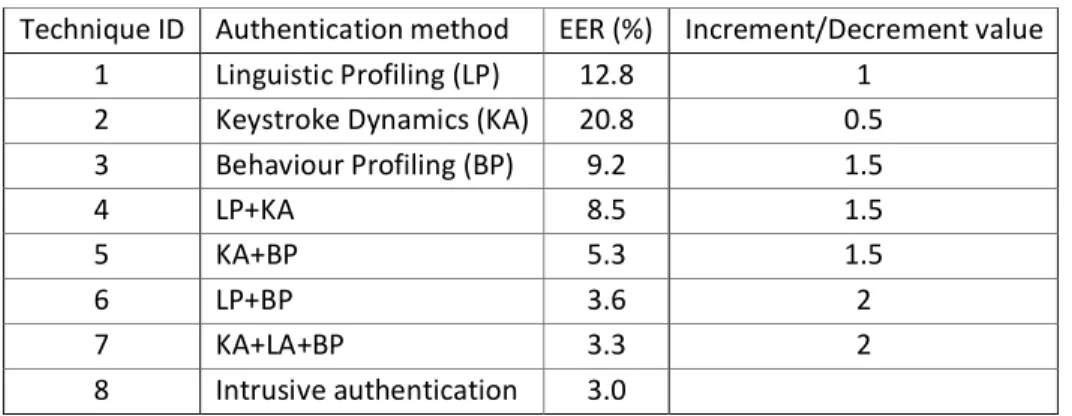
Table 7 Configuration in the Simulation System
Technique ID Authentication method EER (%) Increment/Decrement value
1 Linguistic Profiling (LP) 12.8 1
2 Keystroke Dynamics (KA) 20.8 0.5
3 Behaviour Profiling (BP) 9.2 1.5 4 LP+KA 8.5 1.5 5 KA+BP 5.3 1.5 6 LP+BP 3.6 2 7 KA+LA+BP 3.3 2 8 Intrusive authentication 3.0
5.1 Simulation results and discussion 5.1.1 Authorised User
For authorised user scenarios, the probability for the user to provide an input sample or accessing an application will set to 0.05, 0.15 and 0.50 in order to simulate an infrequent, moderate and frequent user respectively. In order to examine the role of the verification time, the configuration of time period between authentications will vary from 2 minutes, 3 minutes and 10 minutes. The result for all scenarios is represented using the average of running the simulation 10 times. The simulation results for an infrequent, moderate and frequent authorised user are presented in Table 8, Table 9 and Table 10 accordingly.
Table 8 Simulation Results for Infrequent User
Verification time 2 minutes Verification time 3 minutes Verification time 10 minutes Application level #Application Request #Intrusive Request #Application Request #Intrusive Request #Application Request #Intrusive Request 5 6.6 5.5 5.9 4.5 7.2 4.2 4 5.8 0.3 7.7 0.8 5.1 0.4 3 6.6 0.2 6.4 0.5 7.3 0.3 2 6.0 0.4 6.3 0.1 5.9 0.2 1 6.7 0.0 4.7 0.1 6.0 0.0 0 5.6 0.0 6.5 0.0 6.7 0.0 Average total 37.3 6.4 37.5 6.0 38.2 5.1
Table 9 Simulation Results for Moderate User
Verification time 2 minutes Verification time 3 minutes Verification time 10 minutes Application level #Application Request #Intrusive Request #Application Request #Intrusive Request #Application Request #Intrusive Request 5 17.8 9.2 16.8 7.4 16.2 1.5 4 19.4 1.0 19.3 1.0 17.9 0.5 3 18.0 0.3 19.3 0.6 20.0 0.2 2 17.3 0.0 17.9 0.3 16.8 0.3 1 18.3 0.0 18.3 0.2 19.5 0.2 0 17.4 0.0 17.8 0.0 19.3 0.0 Average total 108.2 10.5 109.4 9.5 109.7 2.7
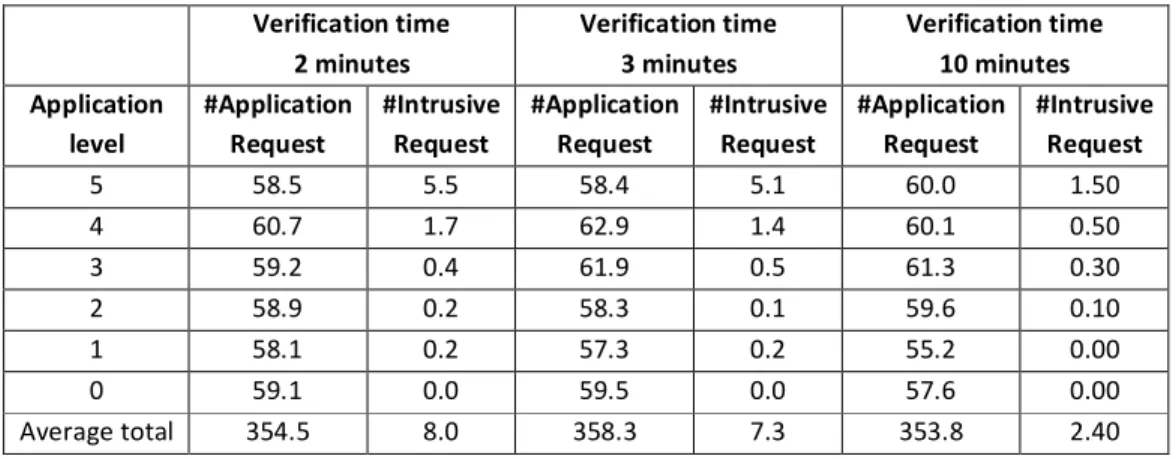
Table 10 Simulation Results for Frequent User Verification time 2 minutes Verification time 3 minutes Verification time 10 minutes Application level #Application Request #Intrusive Request #Application Request #Intrusive Request #Application Request #Intrusive Request 5 58.5 5.5 58.4 5.1 60.0 1.50 4 60.7 1.7 62.9 1.4 60.1 0.50 3 59.2 0.4 61.9 0.5 61.3 0.30 2 58.9 0.2 58.3 0.1 59.6 0.10 1 58.1 0.2 57.3 0.2 55.2 0.00 0 59.1 0.0 59.5 0.0 57.6 0.00 Average total 354.5 8.0 358.3 7.3 353.8 2.40
Based upon simulation results, it shows that the security system can provide high security while minimizing user inconvenience. Analysing the proportion between intrusive authentication requests and application accesses permits an insight into how often the user experiences an intrusive authentication request when they access the application. Ideally, this proportion would be zero meaning that the user will not be required to perform an intrusive authentication request when they access an application. By calculating an average of the proportion across thee verification times, the results show that the infrequent user has been, on average, asked to authenticate 15% of the time that they accessed an application while the moderate and frequent user had averages of 2.5% and 1.6% respectively. The reason why the infrequent users experience an intrusive request is greater than a frequent user is because the system decreases the SS level after the user does not use the mobile device for a period of time preventing abuse of high value applications. Therefore, when the user wishes to access a high value application, they were required to perform an intrusive authentication again. On the other hand, a frequent user not only will prevent the SS level to automatically decrease by continuously using the device, but will also keep giving samples to the device so that the SS level can remain high.
5.1.2 Imposter User
The imposter was simulated as a frequent user with the probability of accessing an application at 0.50 and the probability of entering an input sample at 0.50. The imposter has probability of being incorrectly identified as the authorised user when using an intrusive authentication of 0.03. The simulation results for the imposter user start using device at SS=0 are shown in Table 11.
The simulation results of the first scenario, showed that the security system works extremely well, blocking the imposter from using the mobile device after a few minutes. The majority of imposters never manage to access an application requiring a security level of more than 0. The reasons for this is that when the imposter tried to access an application that required a security level greater than 0, the system requested the imposter to authenticate themselves using an intrusive technique three times. Although, there was a case were the imposter passed the intrusive technique (the probability is 0.8732(0.03*0.97+0.03*0.97+0.97*0.03)) and the security system granted them permission to access the application. However, the security system decreased the SS level continuously as the imposter failed to authenticate themselves using non-intrusive authentication techniques. In this case, the imposter will be challenged again by an intrusive authentication request.
Table 11 Simulation results for imposter user start using device at SS= 0 Verification time 2 minutes Verification time 3 minutes Verification time 10 minutes Application level #Application Request #Intrusive Request #Application Request #Intrusive Request #Application Request #Intrusive Request 5 0.3 0.3 0.3 0.3 0.6 0.4 4 0.3 0.3 0.3 0.3 0.3 0.1 3 0.0 0.0 0.1 0.1 0.4 0.4 2 0.3 0.3 0.1 0.1 0.4 0.2 1 0.3 0.2 0.4 0.4 0.3 0.1 0 0.3 0.0 0.1 0.0 0.4 0.0 Average Total 0.1 1.1 1.3 1.2 2.4 1.2
Average Time use 2.3 minutes 2.6 minutes 5.0 minutes
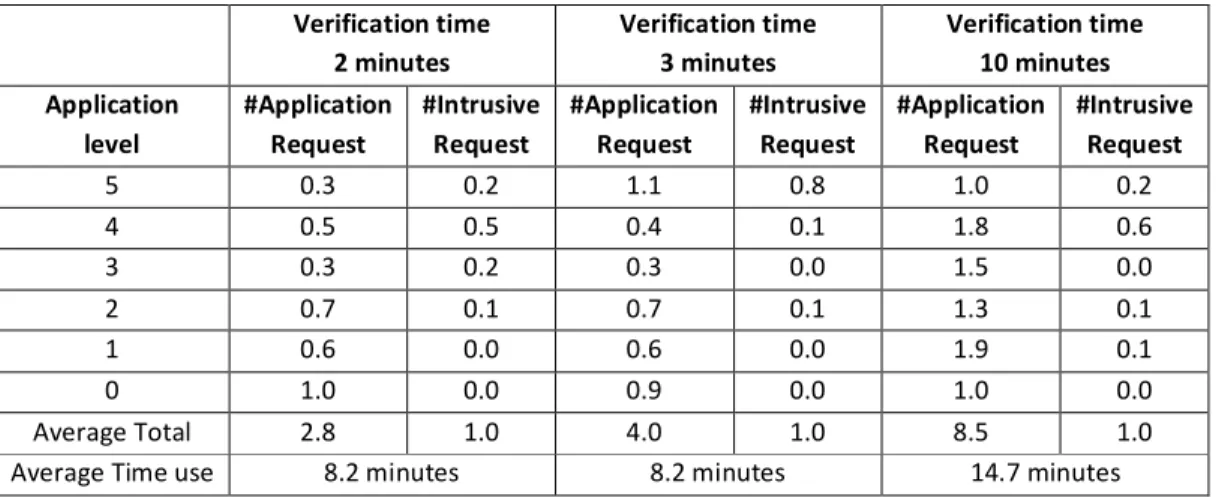
The second scenario was simulated to examine the performance of the security system in preventing an imposter from accessing a high value application when the mobile device was left with SS level 5. As can be seen from Table 12, the simulation results showed that the security system works very well to prevent device misused by an imposter. Although the imposter begins with a big advantage in accessing the high security application, the system decreased the SS level as soon as the authentication request failed. However, the SS level will be decreased depending upon the input samples.
Table 12Simulation results for imposter user start using device at SS= 5
Verification time 2 minutes Verification time 3 minutes Verification time 10 minutes Application level #Application Request #Intrusive Request #Application Request #Intrusive Request #Application Request #Intrusive Request 5 0.3 0.2 1.1 0.8 1.0 0.2 4 0.5 0.5 0.4 0.1 1.8 0.6 3 0.3 0.2 0.3 0.0 1.5 0.0 2 0.7 0.1 0.7 0.1 1.3 0.1 1 0.6 0.0 0.6 0.0 1.9 0.1 0 1.0 0.0 0.9 0.0 1.0 0.0 Average Total 2.8 1.0 4.0 1.0 8.5 1.0
Average Time use 8.2 minutes 8.2 minutes 14.7 minutes
As it can be seen from the simulation results from both authorised and imposter scenarios, the verification time does play an important role in providing security and user convenience. By regularly authenticating the user, the user will suffer more intrusive authentication requests but the system will be able to recognise an imposter in a relatively short period of time. On the other hand, the user will find the device more convenient to use with longer time periods between user authentications but with the effect that the system will take longer to recognise an imposter and lock down the system.
Although the time period of decreasing SS level was not examined, it is expected that this will have an impact on the system. The infrequent user will experience less challenges from the intrusive
authentication technique when the time period of the degradation function gets longer. However, the imposter will have more chance of accessing a high level application in cases where the device was initially left with a high level SS. In this simulation, a linear function is used to decrease the SS level but it is suggested that the function for degrading the SS level should be implemented using an exponential function as it decrease slowly at first and then more rapidly.
6 Conclusion and future work
The first part of this paper presented a feasibility study that demonstrated the ability of utilizing text-based entry to authenticate users. The individual techniques can be used to discriminate users with relatively low error rates for a good proportion of participants. However, there are some users that experience very high error rates. The use multimodal biometrics, specifically the combination of linguistic profiling, behaviour profiling and keystroke dynamics showed an excellent level of recognition performance, validating the feasibility that multimodal text-based has the ability to authenticate user on mobile devices.
The novel multimodal authentication framework subsequently presented to support text-based biometrics was designed to add additional security to a mobile handset, providing transparent and continuous authentication. The system is designed using a variety of single and multimodal biometric techniques without any additional hard-ware. The users can benefit from the framework in terms of both device security and convenience of use. By setting various security levels for different applications/services based upon their risk, the framework is capable of controlling the impact on each application/service. The simulation results clearly showed that the proposed authentication framework is able to provide continuous and transparent authentication to protect mobile devices.
Future work will focus upon the development of a more representative and larger biometric corpus from which to further examine the level of recognition performance that can be achieved. To accompany this work, an operational prototype will also be developed to enable an end-user evaluation to be undertaken so that user acceptance and operational performance can be established.
7 References
1. ITU.:The world in 2010 ICT Facts and Figures, International Telecommunication Union,
http://www.itu.int/en/ITU-D/Statistics/Documents/facts/ICTFactsFigures2014-e.pdf (2014)
2. Kaspersky Lab.: European Users Mobile Behaviour and Awareness of Mobile Threats, Kaspersky Lab ZAO, http://www.kaspersky.com/news?id=207576289 (2011)
3. Dimensional Research.: The impact of mobile devices on information security: A survey of IT professionals, Dimensional Research, http://www.checkpoint.com/downloads/products/check-point-mobile-security-survey-report.pdf (2013)
4. McAfee.: McAfee Reveals Consumers Fail To Protect Their Mobile Devices, http://www.mcafee.com/us/about/news/2013/q1/ 20130224-01.aspx (2013)
5. Clarke, N.L., Furnell, S.M.: Authentication of users on mobile telephones – a survey of attitudes and practices, Comput. Secur. 24(7), 519-527 (2005)
6. Karatzouni S., Clarke, N.L., Furnell, S.M.: Utilising Biometric for transparent user authentication on mobile devices. In: Internet Technologies and Applications, 549-557 (2007)
7. Li, F., Clarke, N.L., Papadaki, M. Dowland, P.: Behaviour Profiling for Transparent Authentication for Mobile Devices. In Proceedings of the European Conference on Information Warfare (ECIW), 307-314 (2011)
8. Sim, T., Zhang, S., Janakiraman, R., Kumar, S.: Continuous verification using multimod-al biometrics. In: Pattern Analysis and Machine Intelligence, 29(4), 687-700 (2007)
9. Ofcom.: UK is now texting more than talking,
http://media.ofcom.org.uk/2012/07/18/uk-is-now-texting-more-than-talking/ (2012)
10. ComputerWeekly,http://www.computerweekly.com/news/2240205200/Apple-adopts-hands-off-approach-to-iPhone-fingerprint-scanner
11. MIT Technology Review, http://www.technologyreview.com/news/425805/new-google-smart-phone-recognizes-your-face/
12. Halteren, V.H.: Linguistic Profiling for Author Recognition and Verification. In: Computational Linguistics, 199-206 (2004)
13. Rudman, J.: The state of authorship attribution studies: Some problems and solutions. Computers and the Humanities, 31, 351-365. (1998)
14. Zheng R., Li, J., Chen, H., Huang Z.: A Framework for Authorship Identification of Online Messages: Writing-Style Features and Classification Techniques. Int. J. the American Society for Information Science and Technology, 53, 378-393 (2006)
15. Burrows, J.: All the way through: testing for authorship in different frequency strata. In: Literary and Linguistic Computing, 22(1), 27-47 (2007)
16. Sanderson, C., Guenter, S.: Short text authorship attribution via sequence kernels, Markov chains and author unmasking: An investigation. In: Proceedings of the Empirical Methods in Natural Language Processing (EMNLP), 482-91 (2006)
17. Hirst, G., Feiguina, O.: Bigrams of syntactic labels for authorship discrimination of short texts, In: Literary and Linguistics Computing, 22(4), 405-417 (2007)
18. Boukerche, A., Nitare,M.S.M.A.: Behavior-based intrusion detection in mobile phone systems. J. Parallel Distrib. Comput. 62(9),1476–1490 (2002)
19. Damopoulos, D. Menesidou, S. Kambourakis, Papadaki, M. Clarke, N. Gritzalis, S. Evaluation of Anomaly-Based IDS for Mobile Devices Using Machine Learning Classifiers, Security and Communication Networks, 5(1), 3-14, 2012, Wiley
20. Buschkes, R., Kesdogan, D., Reichl, P.: How to increase security in mobile networks by anomaly detection. In: Proceedings of the Annual Computer Security Applications Conference, 3–12 (1998)
21. Hall, J.,Barbeau,M., Kranakis, E.: Anomaly based intrusion detection using mobility profiles of public transportation users. In: Proceeding of IEEE International Conference on Wireless and Mobile Computing, Networking and Communications, 2, 17–24 (2005)
22. Sun, B., Chen, Z.,Wang, R., Yu, F., Leung, V.C.M.: Towards adaptive anomaly detection in cellular mobile networks. In: the IEEE Consumer Communications and Networking Conference, 2, 666– 670 (2006)
23. Clarke, N. and Furnell, S.M.: Authenticating Mobile Phone Users Using Keystroke Analysis, Int. J. Inf. Secure. 6(1), 1-14 (2006)
24. Biopassword.: the keystroke dynamics approach, http://www.biopassword.com/bp2/welcome.asp.
25. Behaviosec, http://www.behaviosec.com/products/enterprise/
26. Kittler, J.,Matas, J., Jonsson, K., Sanchez, M.U.: Combining Evidence in Personal Identity Verification Systems. Pattern Recognition Letters, 18, 845-852 (1997)
27. Poh, N. and Korczak, J.: Hybrid Biometric Authentication System Using Face and Voice Features. Lecture Notes in Computer Science, 2091/2001, 348-353 (2001)
28. Snelick, R., Uludag, U., Mink, A., Indovina, M., and Jain, A.K.: Large-Scale Evaluation of
Multimodal Biometric Authentication Using State-of-the-Art Systems. In: IEEE Transactions on pattern analysis and machine intelligence, 27(4), 450-455 (2005)
29. Indovina, M., Uludag, U., Snelick, R., Mink, A., Jain, A.: Multimodal biometric authentication methods: a COTS approach. In: Proceeding MMUA, 99-106 (2003)
30. Cmo Council, http://www.fastcompany.com/3010237/bottom-line/texting-is-the-new-emaildoes-your-company-do-it-right
31. How, Y., Lee, M.F.: NUS SMS Corpus,
http://www.comp.nus.edu.sg/~rpnlpir/downloads/corpora/smsCorpus (2004)
32. De Vel, O., Anderson, A., Corney, M., Mohay, G.: Mining E-mail Content for Author Identification Forensics. In: ACM Sigmod Record, 30(4), 55–64 (2001)
33. Mendenhall, T.C.: The characteristic curves of composition, Science, 11(11), 237-249 (1887) 34. Snelick, R., Uludag, U., Mink, A., Indovina, M., Jain, A.K.: Large-Scale Evaluation of Multimodal
Biometric Authentication Using State-of-the-Art Systems. In: IEEE Transactions on pattern analysis and machine intelligence, 27(4), 450-455 (2005)
35. Jain, A. K. Nandakumar, K. and Ross, A.: Score normalization in multimodal biometric systems. In: Pattern Recognition, 38(12), 2270-2285, Dec. (2005)
36. Jockers, M.L. and Witten, D.M.: A comparative study of machine learning methods for authorship attribution. In: Literary and Linguistic Computing. 25(2), 215-223 (2010)
37. Tsimboukakis, N., Tambouratzis, G.: A comparative study on authorship attribution classification tasks using both neural network and statistical methods. In: Neural Computing and Application, 19(4), 573–582 (2010)
38. Kusakci, A. O. (2012) “Authorship attribution using committee machines with k-nearest neighbors rated voting”, The 11th Symposium on Neural Network Applications in Electrical Engineering, pp.161-166.
39. Clarke, N. Furnell, S.M. Reynolds, P.L., Rodwell, P.M.: Advanced Subscriber Authentication Approaches for Third Generation Mobile Systems. In: IEEE conference publication, Institute of Electrical Engineers, 319-323 (2002)
40. Ledermuller, T., Clarke, N.L.: Risk assessment for mobile devices. In: 8th International Conference Privacy and Security in Digital Business, TrustBus, 210–221 (2011)