Regulation of continuity of supply in the electricity sector and cost of energy not
supplied
Ilaria Losa - ERSE S.p.A. (mail to: [email protected])
Osvaldo Bertoldi - ENGINET S.r.L.
Abstract
The expectation of customers to be served by electric utilities with higher levels of continuity of supply becomes more stringent as long as the share of electricity to total energy consumption grows worldwide, and mostly in developed areas and countries. Indeed, electricity supply interruptions are less and less accepted by customers mainly because their social-economical effects become heavier and heavier. At the same time, in a liberalised electricity market, if continuity of supply is neither contractible nor incentivized, utilities could reduce investments aimed at guaranteeing adequate reliability standards, thus decreasing the levels of continuity of supply to final consumers (this trend has been demonstrated with practical experiences and theoretical analyses). Therefore incentive regulation for continuity of supply can ensure that cost cut policies driven by price-cap regimes are not achieved at the expense of continuity of supply. This paper shows and discusses the main results of a survey on methodologies and techniques used worldwide to assess the cost of electricity supply interruptions, as well as on the actions of European Regulators aimed at incentivizing the continuity of supply. The final target is to provide a reference framework to define economic indices to estimate the Cost of Energy Not Supplied (CENS), as well as to provide a reliable estimation of costs and benefits related to investments aimed at increasing the actual levels of reliability of electricity supply.
Introduction
One of the main tasks of the electricity industry is to provide reliable electricity to customers at a reasonable and competitive price. Since worldwide, and mostly in developed areas and countries, the share of electricity to total energy consumption grows, higher continuity levels of electricity supply become an unavoidable request to the utilities. Indeed supply interruptions, anyway theoretically possible, are less and less accepted by customers and society mainly because their socioeconomic effects are heavier and heavier. More in general, very severe outages and blackouts that occurred in the past years in the United States and in Europe clearly showed that, besides the price of electricity, continuity of service (in terms of reliability/continuity of supply) is also a very important issue for customers and society as a whole. Therefore, regulators and institutions are strongly promoting the improvement of continuity of service in the electricity sector. Then reliability of supply and its value are key factors for the decision making process underlying expansion plans not only of electricity generation systems but also of transmission and distribution networks. It is evident that low levels of investment can result in unreliable supply (unacceptable low continuity), while excessive investments can result in unnecessary expenditures with a resulting increase of the cost of electricity to customers. Following the radical changes occurred in the institutional framework of electricity supply industry since early 90’s of the past century, it is nowadays widely recognised that investments related to the provision of electricity continuity of service must be carefully evaluated through an explicit cost-benefit analysis that provides the basis for answering the economic question: How much reliability is adequate from the customer's perspective? [1] To answer this question it is necessary
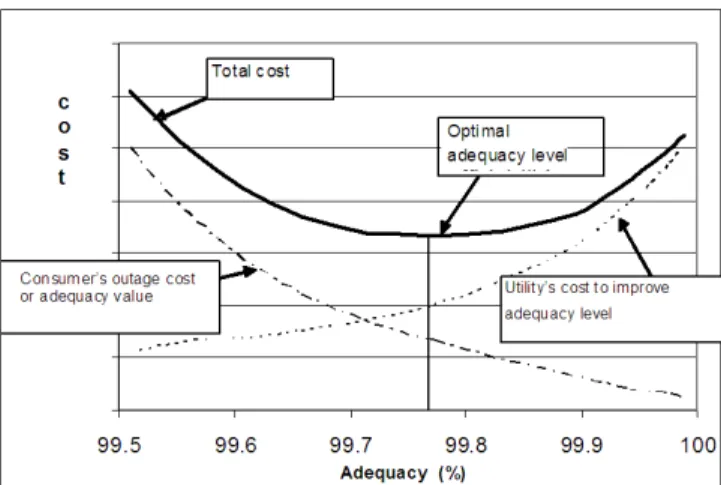
to move from a “criteria-based” planning approach to a “value-based” planning approach, by accounting for both utility’s and customer’s perspectives. Moreover, it has to be taken into account that the continuity of supply to the final consumers can not benefit anymore from the coordination among Generation, Transmission and Distribution sectors, as in the previous monopolistic and vertically integrated framework, because they are now unbundled and autonomous from both the regulatory and the economic point of view. Therefore, the investment optimisation process must be carried out separately for the G, T and D segments and so three independent optima are calculated, thus resulting in an overall quasi-optimum quality level for consumers. In a liberalised framework, optimisation of the quality level and of related investments can be based on the fact that, from the consumer's perspective, the total cost of the electric service consists of two components: cost of service received, proportional to the cost borne by utility, and the cost of service interruptions (that is the cost of unreliability), which are non linear functions of reliability level, as shown in Figure 1. The cost-of-service received, that is the cost in charge of the utility to provide customers with electric service at a given continuity level, rapidly increases as continuity grows while, on the contrary, customer’s cost due to interruptions is very high when reliability level is low and it rapidly decreases as reliability grows.
Figure 1: Adequacy optimization in a power system. (source [2])
Consumers are then best served when their total cost is minimized, that is in the condition defined by equating the marginal cost and the marginal value of service reliability. The assessment of the best compromise between additional investment costs and corresponding benefits to consumers needs to quantitatively determine the value of continuity. This is a very complex task and it cannot be implemented as a direct method mainly because no market exists for the continuity of electricity supply or, conversely, for interruptions of that supply. Currently, an usually adopted approach to get over this obstacle is to assess the reverse, that is the cost associated to lack of continuity. Anyway we must remark that the latter is not identical to the value of continuity although representative of it, perhaps a lower bound.
In the framework of the SECURE project1 a survey has
been carried out aimed at investigating and discussing methodologies and techniques used worldwide to assess the cost incurred by customers due to supply interruptions and at collecting the results of their application to real power systems. This in order to provide a reference framework enabling to quantify the economic index Cost of Energy Not Supplied (CENS), also known as VOLL (Value Of Lost Load) or IEAR (Interrupted Energy Assessment Rate) to be adopted for future transmission network expansion studies in the pan-European area. To this aim, the study has been mainly focused on four topics: i)-the costs of interruptions and the relevant indicators, ii)-the approaches and methods to assess them, iii)-the regulation of the continuity of service and its impact on
1 SECURE is a research project funded by the European Commission under the Seventh Framework Programme with the scope of building a comprehensive framework that covers the issues related to security of supply inside and outside the EU. The project develops appropriate tools for evaluating the vulnerability of the EU to the different energy supply risks. SECURE develops energy security indicators for the major energy sources and technologies so as to identify risk factors and quantify EU exposure. Costs and benefits of energy security are evaluated for different energy demand scenarios to help policy-makers provide the most appropriate solutions.
continuity of supply, iv)-the available estimates of interruption unit costs in the European context.
The cost of interruptions: indices and
methods for their assessment
Economic indices of interruption costs
Useful indices to quantitatively represent the economic losses due to interruptions can be expressed in terms of /interruption, /kW of lost peak load, /kWh of annual energy consumed, /kWh of energy not supplied [5]. Three indices are most frequently used and referenced in the literature:
• IEAR (Interruption Energy Assessment Rate) is a system-wide interruption cost index expressed in /kWh. Together with the adequacy index EENS (Expected Energy Not Supplied per year), it provides an estimation of the expected annual economic damage incurred on average by customers due to interruptions.
• VOLL (Value Of Lost Load) whose prevailing meaning is conceptually equivalent to the IEAR, even though it is sometimes intended as the value ( /kWh) an average consumer puts on an unsupplied kWh of energy, rather than the incurred cost [2], [3] [4], [5].
• WTP (Willingness To Pay) represents the customer willingness to pay to improve its continuity of supply. It may be expressed in /kWh of consumed energy, if it represents the willingness of customers to pay for an increase of their electricity bills in order to have a given continuity improvement [6], or as /event, if the customer’s goal is to reduce or to avoid interruptions at all [7].
Interruption cost indicators are not quantified as a single value, but rather they can imply a large range of values depending on the relative importance of three main factors [8]:
• kind of consumer, such as residential, industrial, commercial, etc.
• interruption characteristics, such as duration, extent, advance notification or not, time of occurrence, etc.
• perceived reliability level, that is strongly determined by the incidence of interruptions in the past and by the level of socioeconomic development and welfare.
Methodologies and techniques to assess
interruption cost indices
The cost of supply interruptions is related to the economic consequences incurred by consumers when an electricity shortage occurs. Suitable approaches and methodologies have been developed in the last decades to assess interruption cost indices and are now available and used by institutional firms for regulatory purposes and by utilities for expansion planning studies.
Methodologies
The methodologies used worldwide can be categorized into four typologies:
a) Revealed preferences, whose main advantage is that relatively accurate data can be collected through observations and analysis of consumers’ market behaviour, while the main drawback is that only large consumers can provide suitable signals.
b) Stated preferences, based on customer surveys. This approach has two main advantages: firstly, it provides utilities with interruption cost data suitable for planning purposes, and secondly, it is customer based / bottom-up, and therefore it directly incorporates customers’ preferences. The main drawback is the high cost to implement it. c) Proxy methods (including the production
function approach), whose main advantage is that they are quite easy to apply, making use of readily available data, such as Gross National Product, total energy consumption, sector production functions, etc., and moreover they are practically inexpensive to implement. The main drawback is that most of them are based on limiting and some times unrealistic assumptions. d) Case studies, based on collection of as much
data as possible immediately after the occurrence of large-scale power supply interruptions. Their main advantage is that interruption cost values are directly related to consumers’ experience of real interruptions, rather than hypothetical scenarios. The fundamental drawback is that the number of case studies and relevant data sets is very small and therefore the meaningfulness of the calculated interruption cost indices may be relatively poor.
Computing techniques
As far as the assessment of interruption cost indices is concerned, it has to be stressed that the Stated Preferences method is the most frequently used by utilities and regulators. On the basis of customer surveys, utilities usually collect cost data for each interruption type and duration. In this case, the assessment of system interruption cost indices in principle requires three computing steps:
a) Processing of raw collected data, that mainly consists in normalisation of individual customer data either by annual consumed energy (MWh) or by peak load demand (MW), in order to make it possible and consistent the subsequent grouping or aggregation process into customer categories (sectors).
b) Setting up of customer interruption cost models, usually based on Customer Damage Functions (CDF) that represent the normalized Cost of Interruptions as a function of outage duration and parameterised according to consumer and outage characteristics. CDFs are usually formulated at Consumer level (CDF), at Sector level (SCDF), by aggregating all consumers of the same sector
and weighing the relevant CDFs, and finally at Composite Consumer level (CCDF), by weighing and combining the previously determined SCDFs.
c) Computing of power system interruption cost indices, that involves the convolution of interruption cost models, of load models and of system model, concerning interruption statistics and power flows analysis.
In particular, computing of interruption cost indices (3rd
step) requires the availability of both frequency and duration of interruptions and of the corresponding load shortages. Should an “ex post” interruption cost investigation be carried out, the system information on the frequency and duration of interruptions, as well as on the total energy not supplied due to outages of network components, can be obtained from recording and processing of operation data. When, on the contrary, an “ex ante” interruption cost analysis is requested, as in the case of network expansion planning, power system interruption indices must be assessed by using suitable network modelling and computing procedures, based on either state enumeration methods or on probabilistic simulations, such as Montecarlo sampling techniques.
Regulation of continuity of electricity
supply
The key motivation for continuity regulation in the electricity sector mainly lies in the strong incentives to cost reduction by utilities, induced by privatisation and price capped tariffs. In this context, indeed, if continuity is not enforced or not incentivized, operators could reduce network investments, thus causing a lower continuity of service for the final consumers. Incentive regulation for continuity can ensure that cost cuts required by price-cap regimes are not achieved at the expense of continuity itself. In some European countries national regulatory authorities have started implementing continuity regulation schemes since the beginning of the present decade. The reference reliability indicators usually considered are SAIDI (System Average Interruption Duration Index), SAIFI (System Average Interruption Frequency Index) and ENS (Energy Not Supplied). As far as the distribution service is concerned, at the end of 2005 incentive/penalty schemes were in place in 8 countries out of the 19 surveyed by CEER [9] (Council of European Energy Regulators): Italy (from 2000), Norway and Ireland (from 2001), Great Britain (from 2002), Hungary and Portugal (from 2003), Sweden (from 2004), and Estonia (from 2005). Meanwhile, some other countries expressed interest for setting up an incentive scheme in the future, such as Finland, France, Lithuania, Poland, Spain, and Slovenia. The, beneficial effects on supply continuity indicators that have been experienced, are summarized below:
SAIDI: GB: -19% (3 years), HU: -65 % (5 years), IT: -53% (5 years)
SAIFI: GB: -15% (3 years), IT: -34% (5 years) ENS: NO: -40% (4 years)
Average Continuity: IE: +28% (5 years).
The analysis of the adopted regulation schemes allows to obtain the VOLL values that have been either explicitly or implicitly assumed by Regulators for their formulation. According to the 3rd Benchmarking Report issued by CEER in 2005 and to British and Italian Regulators’ documents, the continuity incentive schemes adopted in six countries assume the values of VOLL shown in Table 1.
Table 1: VOLL values adopted for continuity regulation schemes (source: [9]).
Country Consumer Sector /kWh not supplied /kW Inter-rupted Supply level Great Britain All sectors 4.18 52.9 Distribution Transmission
Italy All sectors 15.0 Transmission
Sweden Urban Suburban Rural 12.0 8.8 7.4 2.5 1.9 1.6 Distribution Norway Resident. Commercial Industrial 0.96 11.8 7.9 Distribution
Ireland All sectors 7.2 Distribution
Portugal All sectors 1.5 Distribution
In the following paragraphs we report two examples of mechanisms of regulations of continuity of supply that have adopted a “value based” approach. In particular we focus on two examples that involve two large electric systems: Italy and England. In particular the latter is significant because it represent the first case of regulation of continuity of supply based on value based criteria ever applied. Instead the mechanism adopted in Italy is significant because it involves three different indicators that measure the performances of the transmission grid, that account for different requirements submitted by all the stakeholders of the electric system.
Case Study 1: Italy
A price-cap regulation scheme for electricity transmission services has been introduced by the Italian Regulator (AEEG) for the third regulatory period 2008-2011, aimed at stimulating the recovery of the continuity of supply by means of economic incentives or penalties [10]. Regulation has two main objectives:
• The reduction of the ordinary outages that occur on the transmission network.
• The prevention and mitigation of major incidents (those outages that involve more than 250 MWh of energy not supplied for more than thirty minutes [11] [12]).
The regulation scheme is based on a mechanism of incentives and penalties which are applied to TERNA, the Italian TSO, and are determined through three indices, described here below, that measure continuity of supply by accounting for the amount, the frequency and the territorial distribution of the outages.
Indices of continuity of supply
• ENSS (Standard Energy Not Supplied)
Following the indication of TERNA that declared to be available to be considered responsible for all the interruptions that occur on the transmission network (with the exception of those caused by natural catastrophes, by emergency reasons or by programmed disconnections) AEEG introduced the index ENSS that accounts for continuity of supply. It is a weighted average of the energy not supplied during ordinary outages and during major incidents. In order to mitigate the volatility that characterizes the latter ones, ENSS is assessed using average values calculated for three years periods and weighted with a limitation function that has a less than proportional trend. The main points defining the function are reported in Table 2.
Table 2: Main points of the ENSS limitation function (source: [10]).
Energy Not Supplied
[MWh] Standard Energy Not Supplied [MWh]
250 250
1000 500
2250 750
2250< ENS<40.000 750
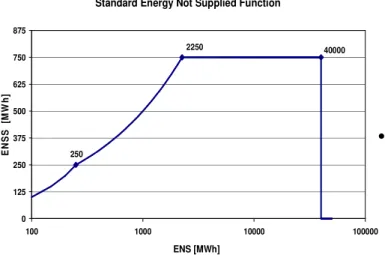
Moreover, AEEG defined the following function: ENSS [MWh] = 250 [MWh] × (ENS [MWh] / 250)1/2
in order to calculate ENSS values from ENS values between 250 MWh and 2250 MWh. Figure 2 shows the resulting ENSS function.
Standard Energy Not Supplied Function 250 2250 40000 0 125 250 375 500 625 750 875 100 1000 10000 100000 ENS [MWh] E N S S [ M W h]
Figure 2: ENSS limitation function (source: elaboration by CESI RICERCA according to guidelines described in [10]).).
The domain of the limitation function varies from a minimum value of ENS equal to 0 MWh to a maximum value of 40000 MWh. For ENS values lower than 250 MWh, ENSS is considered to be equal to ENS. An event that causes an ENS greater than that 40000 MWh is excluded. In ENSS computation, the ENS due to outages occurred on foreign grids that affect the Italian transmission network is also included. The starting reference value of ENSS is the arithmetic average of three years averages calculated for years 2001÷2007.
• NOU (Number of Outages per Users)
This index was introduced “in order to foster the level of protection offered to the final customers also regarding short-lasting outages”. It accounts for both short and long term outages and it is calculated for each category of final users of the transmission network and for each Operative Area identified by TERNA (AOT). It is expressed in terms of outages/user. AEEG chose, for the beginning of the regulatory period and for each AOT, a starting value equal to the average NOU calculated, in each area, during years 2006 and 2007.
• ACO (Amount of Customers without Outages) This index has been taken into account in order to introduce an asymmetry in penalties and incentives, to increase the influence of the latter. The starting reference value is equal, for each AOT, to the two years average value calculated in 2006 and in 2007. Economic impact of regulation
Starting from 2010 AEEG will provide TERNA with an economic incentive in case it achieves the target levels of the indicators of continuity of supply. On the contrary, if the indicators is lower than the target levels TERNA shall pay a penalty. More in detail:
• Incentives and penalties regarding ENSS are equal to:
(LEENSS - LOENSS) × CENSS
where LEENSS is the actual ENSS value, LOENSS is
the target level (its value ensures a reduction of ENSS equal to 2% per year) and CENSS is the cost
of energy not supplied.
• Incentives and penalties regarding NOU are equal to:
(LENOU-LONOU)*CNOU *Pij
where LENOU is the actual NOU value recorded on
the transmission network, LONOU is the target
level, CNOU is the cost of energy not supplied
during outages and Pij is the average power
transmitted by AOT j during year i divided by the number of hours in a year.
• Finally, if TERNA meets both the ENSS and the NOU target standards, the above incentives are increased by a factor equal to: [1 + 2 × max(LEACO
–LPACO; 0)], where LEACO and LPACO are the
actual value and the starting value of the ACO index.
The reference value for the ENSS index for years 2008-2009 has been set equal to the starting value. For years 2010-2011 it will be set equal to 98% of the value set for the previous years.
The reference value for the NOU index, for each year and for all the AOTs, has been set equal to 0.18 outages/customer; if the starting value is greater than 0.18 outages/customer, the reference value is set equal to the starting value and every year it will decrease in order to reach the value of 0.18 outages/customer in year 2019. An unique target value of NOU for all the AOTs has been adopted to harmonize the continuity of supply all over the entire transmission network. In order to limit the exposure of the TSO to the financial risk, AEEG determined a maximum limit for incentives and penalties. The maximum amount of the penalties is equal to 1.5% of the revenues deriving from transmission service, while the maximum limit of the incentives is equal to 2%. These limitations have been introduced in order to test and refine the regulation, that will be enforced also in future regulatory periods.
Evaluation of the cost of energy not supplied
To assess the cost of energy not supplied (CENSS)
AEEG tried to reach a compromise between two requirements:
• the proposal submitted by TERNA that suggested to choose a value of the cost of outages that increases when ENSS decreases;
• the willingness to pay (WTP) principle, according to which the availability to pay for the improvement of any service decreases when the value of the continuity index increases.
In order to account for both requirements AEEG chose a fixed value of CENSS equal to 15000 /MWh. Such a
value is consistent with the result of a market survey carried out by Sintef on behalf of AEEG in 2003 among end users, aimed at determining the costs that they have to bear when an outage occurs.
In Figure 3 the results of the market survey are reported
(the Y axis shows the cost of energy not
supplied in /kWh, while the X axis shows the different categories of end users: “Domestici” = “Domestic”, “Totale Business” = “Total Business Users”, “Industria” = “Industry”, “Servizi” = “Services”, “Commercio” = “Commerce”).Figure 3: Outage costs for end users in Italy in year 2003 (source: [13]).
According to Figure 3, the results of the survey have led to an average cost of interruptions equal to 10000 /MWh for domestic customers and equal to 20000 /MWh for non domestic ones.
Case Study 2: Great Britain
On 25 June 2004 the British Office of Gas and Electricity Markets (Ofgem) published a statement [14] about the transmission failures in London that, in its conclusions, acknowledged the need to introduce new incentive arrangements for Transmission System Operators (TSO) operating in Great Britain2 in 2004, in
order to improve reliability of supply. The main objective of such incentive arrangements is to provide Transmission System Operators with incentives aimed at maintaining and improving the reliability of transmission systems, with respect to the continuity of supply to consumers. The regulatory scheme introduced involves a performance incentive/penalty calculated on the basis of the energy not supplied due to outages occurred in the transmission grid during one year.
2In 2004 there were three transmission licensees in Great Britain:
National Grid Company (NGC) that operated in England and Wales; SP Transmission Limited (SPTL) that operated in the South of Scotland and Scottish Hydro Electric Transmission Limited (SHETL) that operated in the North of Scotland.
Economic impact of regulation
The incentive scheme foresees a maximum incentive equal to 1.0% of the revenues of the TSO and a maximum penalty equal to 1.5%. In 2004 NGC’s transmission revenues were around £900 millions ( 1323 millions, according to 2004 exchange rate [15]), which implied a maximum incentive of £9 millions (corresponding to 13.2 millions), and a maximum penalty of £13.5 millions (corresponding to
19.8 million).
Index used to assess incentives
The incentive arrangements are based on TSO’s annual performance, measured using the cumulative amount of energy not supplied during the year taken into account. The target is set equal to the average annual performance calculated in the period 1991-2004, but excluding events that affect less than 4 customers, that according to the data published by Ofgem [15], is equal to 101 MWh per year.
Incentives and penalties
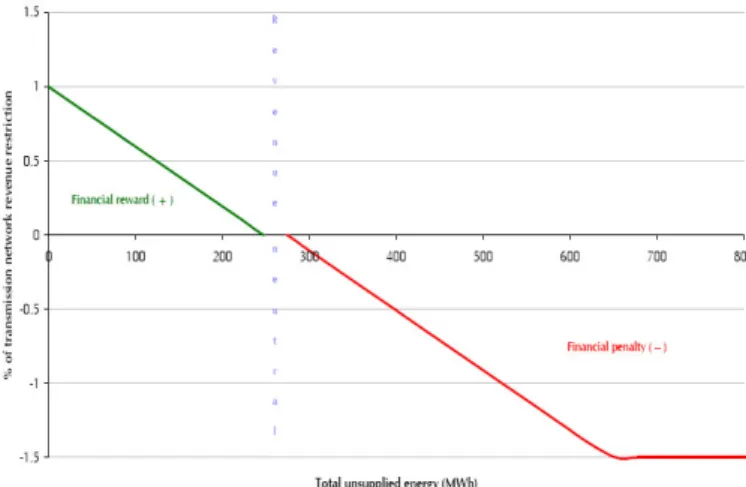
Since 2005 Ofgem has been providing NGC with an economic incentive (or penalty) based on the index of continuity of supply. This mechanism compares the actual amount of energy not supplied with the corresponding target value. NGC will neither be rewarded nor penalized if it manages to maintain the annual energy not supplied within the range of ± 5% of the average level recorded between 1991 and 2004 (i.e. within the range 248÷274 MWh). NGC will be penalized for an annual level of energy not supplied that exceeds 274 MWh; on the contrary, it will be rewarded for an annual level of energy not supplied lower than 248 MWh. In Figure 4 incentives and penalties as a function of the energy not supplied for the first regulatory period are reported. The continuity of supply incentive scheme was enforced on 1 January 2005 and it was applied in the first regulatory period till 31 March 2006 (taking into account 125% of the annual target, since the period was 15 months long). The scheme was applied also in the second regulatory period, from 1/4/2006 to 31/3/2007 [15], [16].
Figure 4: Incentives and penalties as a function of the energy not supplied (source Ofgem).
According to the relation reported in Figure 4 we can estimate a value of the energy not supplied equal to 36000 £/MWh, that corresponds to 52941 /MWh referred to 2004 currencies [17]. This value has been calculated as the slope of the function illustrated in Figure 4.
In Table 3 a summary of the scheme for the two regulatory periods is reported.
Table 3: Summary of the scheme for the two regulatory periods (source: [16]).
Range of Energy Not Supplied Range of incentives/penalties Period 1: 1/1/2005 to 31/3/2006 (125% of annual targets) Reward 0-309 MWh 0-1.25% of revenues Revenue neutrality 310-342 MWh 0 Penalty >343 MWh 0-1.875% of revenues Period 2: 1/4/2006 to 31/3/2007 (100% of annual targets) Reward 0-247 MWh 0-1.0% of revenues Revenue neutrality 248-274 MWh 0 Penalty >275 MWh 0-1.5% of revenues
Past performances of NGC transmission grid
In Figure 5 we report the past performances of the NGC transmission grid during years 1991 – 2004 and we try to assess the impact of the incentive regulation in case it were already enforced at that time. According to the performances shown in Figure 5, and according to the proposed incentive scheme, NGC would have received a financial reward for eight years. On the other hand, in the remaining 5 years NGC would have
paid penalties. Based on this evaluation of asymmetry in grid performances it could be argued that the reason of the asymmetry of the thresholds of incentives and penalties (+1.0%; -1.5%) is the willingness to create a £0 regulation scheme without major impacts on tariffs for grid users.
Figure 5: Energy not supplied in the England and Wales transmission system from 1991 to 2004 (source: Ofgem).
Estimates of VOLL values
For the period from 1991 to 2007 the survey allowed to obtain for some European countries the VOLL values shown in APPENDIX I [9]. In Table 5. we report results of a literature survey aimed at quantifying values of VOLL in different Countries. In particular we report values for Great Britain, Sweden, Norway, Netherlands, Finland, Ireland, Slovenia, Albania Bulgaria, Croatia and Romania. For each Country we specify the customer sector investigated (commercial, residential, industry ), the Value of VOLL identified by literature and the approaches used to assess them. As far as the worldwide estimates of VOLL at the horizon year 2030 are concerned, a research of University of Bath [18] suggests the values shown in Table 4.
Table 4: Estimated VOLL values at year 2030 (maximum range and 90% confidence limit range) (source [18]).
VOLL in US$(2007)/kWh
Entire economy (all consumer’s sectors) Maximum range 90% CL range Developed countries 4 ÷÷÷÷ 40 5 ÷÷÷÷ 25 Developing countries 1 ÷÷÷÷ 10 2 ÷÷÷÷ 5
Conclusions
The investigation on costs of electricity interruptions carried out in the framework of the SECURE Project focused both on the methodologies to assess the unit value of such costs and on the efforts done by Regulators in some countries to incentivize the improvement of continuity of electricity supply. The authors deem that the following conclusions can be drawn.
As far as methodologies and techniques to assess the interruption costs, four types of methods are categorized in the literature: Revealed Preferences, Stated Preferences, Proxy methods, Case Study. On the basis of the analysis of relevant advantages and drawbacks and according to the existing worldwide experience, the Stated Preferences approach, based on the development of customer surveys, seems to be preferable, despite the overall costs necessary to implement it.
Moreover, when an “ex ante” outage cost analysis is requested, as in the case of network expansion planning, power system interruption indices, such as SAIFI, SAIDI, ENS, are needed and they have to be assessed by using suitable network modelling and probabilistic methods. Due to non linearity of interruption costs w.r.t. their duration, it is suggested to prefer those methods (e.g. sequential Montecarlo probabilistic simulation) enabling to account for the statistical distribution of interruption durations rather than for their average value.
Some values of VOLL available in the literature have been obtained through different approaches and computing methodologies and, moreover, they are expressed in different currencies and are referred to different years. Then, it is difficult to compare them to each other.
However some general conclusions can be drawn:
• VOLL tends to be higher for developed countries than for developing ones, mainly depending on the respective shares of electricity to total energy consumption;
• such differences could be smoothed by expressing VOLL in PPP (Power Purchase Parity) rather than in US$ and current international exchange rates;
• in the long term (2030) it has been estimated that VOLL values (in /kWh) could lie in the intervals 5 - 25 and 2 - 5 for developed and developing countries respectively, with 90% confidence limit;
• the spread in VOLL values in absolute terms, and thus the “risk” for a high value of VOLL, is higher for more developed countries than for developing ones; in any case their distributions seem to be left-skewed so that median values are closer to lower bound than to upper bound of each relevant interval.
Finally it has to be stressed that in the European context, regulation of electricity continuity of supply has started at the beginning of 2000. Currently, regulation of continuity of supply is in force in eight
countries and it is based on incentives/penalties schemes. In Great Britain and in Italy regulators implemented specific schemes for transmission service continuity, too. In those countries where continuity incentive schemes have been adopted, remarkable beneficial effects on supply continuity indicators have been experienced.
The content of this paper is the result of a study carried out in the frame of the SECURE project (Security of Energy Considering its Uncertainty, Risk and Economic implications) under grant agreement n° 213744. SECURE is a research project funded by the European Commission under the Seventh Framework Program and coordinated by Fondazione Eni Enrico Mattei. The project aims at developing appropriate tools for evaluating the vulnerability of the EU to different energy supply risks, and for promoting the optimization of EU energy insecurity mitigation strategies.
References
[1]. Sanghvi A.P., “Measurement of customer interruption cost/value of service for cost-benefit reliability evaluation: some commonly raised issues”. IEEE Transactions on Power Systems, Vol. 5, No. 4, pp. 1333-1344, November 1990. [2]. CIGRE Task Force 38.06.01: “Methods
to consider customer interruption costs in power system analysis”. Technical Brochure, August 2001.
[3]. Kariuki K.K., Allan R.N., “Evaluation of reliability worth and value of lost load”. IEE Proc. Gener. Transm. Distrib., Vol. 143, No. 2, March 1996.
[4]. ERI, Energy Research Institute, “Electricity outage cost study”. Chulalongkorn University, Thailand, 2001
[5]. Tol R.S.J., “The value of Loss of Load”. ESRI-Ireland, working paper 214, October 2007
[6]. Goett A.A., Hudson K., Train K.E., “Customer’s choice among retail energy suppliers: the Willingness-To-Pay for service attributes”. Energy Journal, 2000, 21 (4): 1-28.
[7]. Carlsson F., Martinson P., “Willingness to pay among Swedish households to avoid power outages: a Random Tobit Model approach”. Elforsk report 05:04, February 2005.
[8]. Tollefson G., Billinton R., Wacker G., Chan E. and Aweya J., “A Canadian
customer survey to assess power system reliability worth”. IEEE Transactions on Power Systems, Vol. 9, No. 1, February 1994.
[9]. Council of European Energy Regulators – CEER, “Third benchmarking report on quality of electricity supply”. 6 December 2005.
[10]. Autorità per l’Energia Elettrica e il Gas (AEEG), Decision n. 341/07 (in Italian). http://www.autorita.energia.it/docs/07/34 1-07.htm, 16 Feb. 2007.
[11]. Autorità per l’Energia Elettrica e il Gas (AEEG), Decision n. 250/04 (in Italian). http://www.autorita.energia.it/docs/04/25 0-04.htm, 30 Dec. 2004.
[12]. Autorità per l’Energia Elettrica e il Gas (AEEG), Decision n. 281/07 (in Italian). http://www.autorita.energia.it/docs/07/28 1-07.htm, 6 Dec. 2007.
[13]. Autorità per l’Energia Elettrica e il Gas (AEEG), “Annual Report 2005” (in Italian).
http://www.autorita.energia.it/relaz_ann/0 5/rel_ann2005.zip, 23 June 2005.
[14]. Office of Gas and Electricity Markets (Ofgem), “Statement by the Gas and Electricity Markets Authority, following an investigation into compliance by National Grid Company plc with its obligations under section 9(2)(a) of the Electricity Act 1989 and Special Licence Condition AA4.1 of its Electricity Transmission Licence in relation to a transmission failure in London and in relation to a transmission failure in Birmingham, June, Electricity transmission network reliability incentive schemes — consultation document Office of Gas and Electricity Markets”. 2004. [15]. Office of Gas and Electricity Markets
(Ofgem), “NGC system operator incentive scheme from April 2005”. Final proposals and statutory license consultation, 65/05, March 2005.
[16]. Office of Gas and Electricity Markets (Ofgem), “Electricity transmission network reliability incentive schemes. Final proposals”. December 2004, London.
[17]. European Central Bank, Bilateral exchange rates 1999 – 2007, http://sdw.ecb.europa.eu.
[18]. “WP5 Report on national and EU level estimates of energy supply externalities”. Deliverable D.5.1 of Project No 518294
SES6, CASES (Cost Assessment of Sustainable Energy Systems). University of Bath (UK), 19th December 2007. [19]. Billinton R., Ali S.A., Wacker G.,
“Reliability Worth Comparisons”. IEEE Power Engineering Review, Vol. 21, May 2001.
APPENDIX I
: ESTIMATIONS OF VALUES OF VOLL
Table 5: VOLL values resulting from the literature survey ([9], [18])Country Sector VOLL Approach Adopted Remarks
Residential 2.5 ÷ 9 US$(2004)/kWh Industrial 4 ÷ 10 US$(2004)/kWh All sectors 4 ÷ 6 US$(1993)/kWh Great Britain
All sectors 11 ÷ 13 £(1996)/kWh
Surveys Obtained from CDFs and SCDFs of 1993 survey.
Expected VOLL through probability method and 1993 data.
Residential 2.5 ÷ 5 US$(2004)/kWh Commercial 49.0 US$(2004)/kWh Industry 6.2 ÷ 18,2
US$(2004)/kWh Sweden
All sectors WTP per 1h outage: 9.4 ÷ 13.5 SEK(2004)
Surveys
Residential 1.0 US$(2004)/kWh Commercial 5.0 US$(2004)/kWh Norway
All sectors 3 ÷ 4 US$(1991)/kWh
Surveys
The
Netherlands All sectors 10.0 US$(2004)/kWh Finland All sectors 2.0 ÷ 3.8
US$(1999)/kWh Survey
VOLL as a decreasing function of outage duration Residential 62.0 (2007)/kWh Others 9.0 (2007)/kWh Ireland Average 40.0 (2007)/kWh Proxy
method VOLL assessment by using linear production functions Slovenia All sectors 1.0 ÷ 3.0 (2007)/kWh SECI
inquiry SEE Area: Albania Bulgaria Croatia Romania UNMIK All sectors 0.5 (2007)/kWh 2.0 (2007)/kWh 2.56 (2007)/kWh 0.8 (2007)/kWh 0.4 (2007)/kWh SECI inquiry
![Table 1: VOLL values adopted for continuity regulation schemes (source: [9]).](https://thumb-us.123doks.com/thumbv2/123dok_us/1041663.2637923/4.892.83.438.397.698/table-voll-values-adopted-continuity-regulation-schemes-source.webp)
![Figure 3: Outage costs for end users in Italy in year 2003 (source: [13]).](https://thumb-us.123doks.com/thumbv2/123dok_us/1041663.2637923/6.892.75.457.381.602/figure-outage-costs-end-users-italy-year-source.webp)
![Table 5: VOLL values resulting from the literature survey ([9], [18])](https://thumb-us.123doks.com/thumbv2/123dok_us/1041663.2637923/10.892.80.816.221.849/table-voll-values-resulting-literature-survey.webp)