Asset Management:
Using Efficient Frontier Analysis to Select Projects With Achievable Returns While Operating Within Acceptable Risk
Frank Hoss GE Energy
Introduction
A Utility is a business and therefore, it must provide both shareholder and customer value. The Utility’s investments must deliver an appropriate level of return and manage customer satisfaction, all while operating within an acceptable level of risk. It’s common knowledge that there is a direct relationship between return and risk – the larger the return, the higher the risk. Few Utilities, however, fully understand whether their assets reflect appropriate returns for the risks they face. Constrained by finite budgets, staff and other resources, Utilities are continually faced with the issue of deciding where to invest to deliver the most value to the business. With millions of dollars and hundreds, if not thousands of “project” investments at the Utility each year, it makes sense to treat these investment decisions in a manner similar to how a fund manager determines a portfolio of stocks.
For example, a Primen-Electric Utility study identified that “by investing an average of $1.64 per customer in service delivery (customer communications), a Utility can achieve an 8%
increase in customer satisfaction, while investing $180 per customer in improving distribution infrastructure (capital projects) only improves customer satisfaction by 5%. Clearly, this is not meant to imply that the Utility should invest 100% of their available budget in improving service delivery (customer communications), as higher customer satisfaction is not the only return they are seeking. It does indicate, however, that a Utility must have a structured process in-place to measure and
maximize the return (however it is characterized, e.g., customer satisfaction, reliability, ROI, EPS, etc.) one can expect to achieve given all
combinations of investments that are constrained by the Utility’s finite budgets, staff and other resources.
2 4 6 8 10 25 50 75 100 125 150 175 200 $ Invested/Customer % Increas e Cust omer Sa ti s fac ti on $178 3% Service Delivery Investment Infrastructure Investment
Figure 1: Primen-Electric Utility Study 2 4 6 8 10 25 50 75 100 125 150 175 200 $ Invested/Customer % Increas e Cust omer Sa ti s fac ti on $178 3% Service Delivery Investment Infrastructure Investment
Figure 1: Primen-Electric Utility Study
Investments must not only produce an acceptable return for the business unit (e.g., Operations, Engineering) providing the budget and other resources, but it must be beneficial at the enterprise level. Optimizing one part of the business at the overall expense or betterment of the enterprise occurs all too often as Utilities haven’t had the capability to appropriately assess projects and determine a portfolio that truly achieves the best interests of the Utility. Using the efficient frontier method, the Utility is easily provided with better return and risk information upon which investments decisions can be based and
periodically evaluated as conditions change. The focus of this paper looks at the extension of efficient frontier analysis to the Utility’s Transmission & Distribution (T&D) business.
Efficient Frontier Analysis (EFA)
Utilities spend a great deal of time deciding how to invest in T&D assets. Often, however, the process focuses almost exclusively on the potential financial impacts on only one or a few assets at a time (or segmented by business units within the Utility’s organization), and not the impact of all projects (i.e., the selected portfolio of projects) to the Utility’s T&D business as a whole. In many cases, only the net present value (NPV) approach is used in making investment decisions, absent of methodically evaluating the risk considerations. The resulting, selected portfolio of projects is likely inconsistent with the level of risk the Utility is willing to accept. Using this approach to make investments is not sufficient for portfolio level decisions. With millions of dollars in project investments at Utilities each year, it makes better sense to determine these investment decisions in a manner similar to how a fund manager determines a portfolio of stocks. The application of Harry Markowitz’s Nobel Prize winning Efficient Frontier and Modern Portfolio theory is well suited to support these types of portfolio investment decisions.
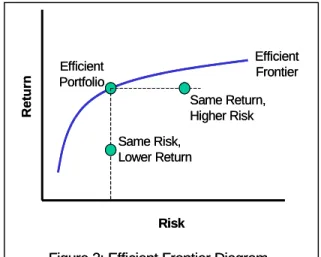
The efficient frontier is designed to assess risk versus return for an investment portfolio (not a single project, but a group of potential projects selected from a comprehensive list). While the financial evaluation of an individual project is extremely important as input to the analysis, the end result using EFA is to structure a portfolio of projects that provides the highest return for a given level of risk. This is the Efficient Frontier as shown in Figure 2.
The vertical axis represents return for the portfolio and the horizontal is the risk. Return is typically the mean return of the projects in the portfolio expressed in dollars. Risk is also normally expressed in terms of dollars,
particularly for funds management, but can use other risk metrics when applied to a physical asset portfolio. The curve, labeled “Efficient Frontier”, is the highest level of expected return for any given level of risk resulting from all possible combinations of projects for the portfolio. For any portfolio on the efficient frontier, it provides the highest return possible at that given level of risk. As
seen in the diagram, a higher return is possible, however it requires a larger risk. Conversely, a portfolio of projects could produce a lower return for the same risk. The area under the curve represents every non-efficient portfolio that can exist. By
displaying the portfolios in this manner, it’s easy to see that the Efficient Frontier answers three (3) fundamental portfolio management decisions:
Efficient Frontier Efficient Portfolio Risk Re tu rn
Figure 2: Efficient Frontier Diagram Same Risk, Lower Return Same Return, Higher Risk Efficient Frontier Efficient Portfolio Risk Re tu rn
Figure 2: Efficient Frontier Diagram Same Risk,
Lower Return
Same Return, Higher Risk
What are the best combination of projects that the Utility can implement, given the available budget, risk tolerance, and other constraints (e.g., resource availability, reliability improvements)?
Is the Utility over- or under-investing?
Is the Utility getting the optimum return from the potential portfolio of projects? Another important outcome from Efficient Frontier modeling is the opportunity cost. The Efficient Frontier shows the opportunity cost of investing an additional dollar versus the additional value received. When the company is discovering the most valuable projects for the investment, those with the highest value/cost ratios, the Efficient Frontier is quite steep. In contrast, when there are very few valuable projects left, those with the worst value/cost relations, the Efficient Frontier curve is quite flat.
Application of EFA to the Utility T&D Business
Initially, and probably most frequently, EFA has been applied to funds management. In looking at the applicability to the T&D business, it’s worthwhile to build up to it by
looking at how it’s typically used in funds management, can be leveraged in evaluating generation asset portfolios, and extended to determining the optimal T&D projects. In
funds management, the investments may provide expected Returns in terms of the fund
price, coupon payments, dividends, stock splits, etc. Accordingly, the expected return
for each investment is assigned an associated Risk (or volatility). Based on a set of
constraints, e.g., available money to invest, all combinations of fund portfolios with expected return and associated risk can be generated, and the resulting efficient frontier plotted.
For selecting the optimal generation asset portfolio, a similar process can be followed. All specific generation assets or asset classes need to first be identified. If the Utility doesn’t have specific generation plants in mind, generation asset classes (e.g., coal,
gas, nuclear, wind, hydro) can be substituted. These assets can be further
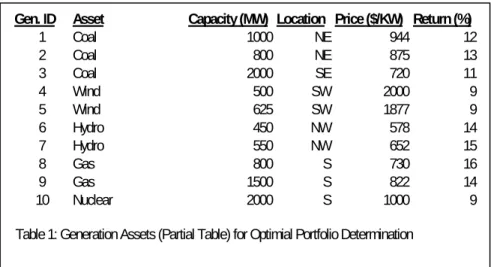
differentiated (or constrained, depending on one’s point of view) by parameters such as clean technology, location, renewable sources, high operating availability, etc. (see Table 1) In this type of analysis, similar to the funds management example, the
appropriate Return metric needs to be identified. For generation assets, it is typically
financial, such as net income, income per kilowatt generated, etc. Finally, a decision on the total dollars to be invested in the portfolio and any limitations as to the amount of
Gen. ID Asset Capacity (MW) Location Price ($/KW) Return (%)
1 Coal 1000 NE 944 12 2 Coal 800 NE 875 13 3 Coal 2000 SE 720 11 4 Wind 500 SW 2000 9 5 Wind 625 SW 1877 9 6 Hydro 450 NW 578 14 7 Hydro 550 NW 652 15 8 Gas 800 S 730 16 9 Gas 1500 S 822 14 10 Nuclear 2000 S 1000 9
investment in any specific type of generation asset, e.g., 40% coal, 10% wind, 30% gas, needs to be defined. Applying EFA will result in many portfolios being identified within the specified investment dollars, and those portfolios with the highest return for a given risk, will define the efficient frontier.
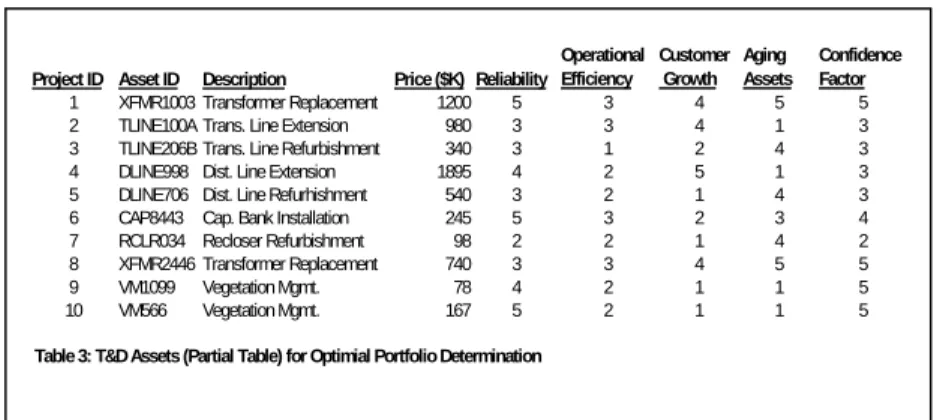
T&D business asset portfolios are analyzed very similarly to generation assets. The major difference is that instead of evaluating various types generation assets, we now look at T&D projects (e.g., new transmission line, line refurbishment, transformer replacement, vegetation management). As with generation assets, the Utility is ultimately constrained by the amount of investment dollars available, however
differentiation parameters, such as clean technology, location, etc. are different for the T&D business. They are, in fact, the T&D business drivers. This typically includes reliability, customer satisfaction, operational efficiency, aging assets, aging workforce, etc. (see Table 2). Once defined, and it’s extremely important to have a common definition and weighting across the business, each potential project can be assessed relative to its impact on the business drivers. As with determining the optimal generation portfolio, constraints can be placed on the T&D projects such that the resulting portfolio will improve reliability metrics (e.g., SAIDI, CAIDI) by 3%, customer satisfaction by 5%, operational efficiency by 3%, etc. Alternatively, because of the difficulty in estimating specific improvements, e.g., improving operational efficiency by 3%, a weighted scale can be applied (e.g., 1 to 5, with 1 being the least
impact and 5, the most). Similarly, a confidence factor can be placed individually, or collectively, on the assignment of these values. The valuation of projects is best
approached by a small, experienced team of Utility personnel that review and
assign the appropriate values to each project. In the application of EFA and the
determination of projects included in a specific portfolio, a total maximum budget can be specified, and a certain percentage of the budget be weighted towards reliability,
customer growth, etc. Similar to the optimal generation asset portfolio, applying EFA will result in many portfolios being identified within the specified investment dollars (budget), and those portfolios with the highest return for a given risk, will define the efficient frontier.
Operational Efficiency
Drive costs out of the business Manage the Total Cost of Ownership (TCO) for enabling technology solutions
Regulatory Compliance
Financial/Governance (Sarbanes-Oxley) Security
Operational (system reliability, pipeline safety)
Aging Assets Aging Workforce
Reduced access to Capital Customer Growth
Table 2: T&D Core Business Drivers
Project ID Asset ID Description Price ($K) Reliability Operational Efficiency Customer Growth Aging Assets Confidence Factor 1 XFMR1003 Transformer Replacement 1200 5 3 4 5 5
2 TLINE100A Trans. Line Extension 980 3 3 4 1 3
3 TLINE206B Trans. Line Refurbishment 340 3 1 2 4 3
4 DLINE998 Dist. Line Extension 1895 4 2 5 1 3
5 DLINE706 Dist. Line Refurhishment 540 3 2 1 4 3
6 CAP8443 Cap. Bank Installation 245 5 3 2 3 4
7 RCLR034 Recloser Refurbishment 98 2 2 1 4 2
8 XFMR2446 Transformer Replacement 740 3 3 4 5 5
9 VM1099 Vegetation Mgmt. 78 4 2 1 1 5
10 VM566 Vegetation Mgmt. 167 5 2 1 1 5
Conclusion
The Efficient Frontier approach to the selection of T&D business projects as a portfolio can be very insightful, ensuring that the resulting optimal portfolio provides the expected return, lies within the risk tolerance of the Utility, and considers what is best for the enterprise as a whole. EFA can be used to simplify the view of a complex portfolio management problem by bringing clarity to basic questions such as tradeoffs, opportunity costs, scarcity of resources, and the implication of applying constraints. EFA should only be applied to those projects that represent an opportunity, that is, projects that have to been done no matter what should be excluded from the potential projects list, and the remaining available budget reduced accordingly. Also, “nice-to-have” projects should be excluded from consideration.
Although it’s readily apparent that considerable complexity exists in manipulating the data to produce the efficient frontier, fortunately, several commercially available software solutions make this relatively easy following the initial setup.
So, should you invest an average of $1.64 per customer in service delivery (customer communications projects), to achieve an 8% increase in customer satisfaction, or invest $180 per customer in improving distribution infrastructure (capital projects) to improve customer satisfaction by 5%? If your only business driver was customer satisfaction, then the likely answer is “yes”. As the Utility T&D business has many projects
competing for limited funds, and many business drivers, let Efficient Frontier Analysis help to structure the right solution.