Appendix
C
White
Paper
to
Support
Bicycle
Facility
Design
Toolkit
on
Lane
Width
Design
Modifications
MEMORANDUM
Date: December 31, 2012 Project #: 11080.03
To: Washington County
From: Hermanus Steyn, Pr. Eng., PE; Casey Bergh, PE; and, Jack Freeman, PTOE
Subject: White Paper to Support Bicycle Facility Design Toolkit on Lane Width Design Modifications
This paper supports the Washington County Bicycle Facility Design Toolkit prepared by Kittelson & Associates, Inc. (KAI) to supplement the current Washington County Road Design and Construction Standards. The Toolkit provides engineers and planners more options to address safety concerns and accommodate a wider range of bicyclists.
Reducing travel lane width1 to accommodate bicycle facilities on existing roadways or within existing right-of-way of future roads is often desired. However, conventional wisdom of most highway engineers is that use of narrower lanes will have negative impacts on safety and operations. Agency policies require that whenever the lane width standard is not met, a design modification must be obtained. In recent years, definitive research has been conducted to evaluate the validity of this conventional wisdom.
This white paper provides summaries of literature that document the trade-offs of reducing lane width and provides empirical support for small variations from standard widths based on decisions that balance mobility targets, safety goals, and design user needs of each roadway.
Many factors influence the findings of the literature, including: facility type (e.g., intersection or segment), functional classification (principal arterial, collector, local road, etc.), number of lanes, travel speed, percent of truck traffic, area type (e.g., urban, rural, etc.), and on-street parking. In many cases, the literature provides findings that inform design decisions by allowing for calculation of the incremental impacts of reducing lane width on safety and operations. With this information, the overall effect of a cross-section change can be evaluated. On the basis of this type of quantitative evaluation, travel lane width reductions should be considered a viable solution for accommodating all motorized and non-motorized users.
1
Typically measured from center of stripe to center of stripe, or from center of stripe to face of curb/edge of pavement (if no striped shoulder).
LITERATURE REVIEW
The following sections summarize literature that has documented how travel lane width impacts traffic operations and safety. Findings from the literature have been grouped by roadway characteristic (i.e., facility type, functional classification, or area type) where the literature includes focused studies with that level of detail.
The literature reviewed for this study includes the most-recent and widely-accepted national research available. The methods applied by the researchers to establish quantitative trends to inform design decisions represent the state-of-the-practice. However, the results reflect data collected in a limited number of states and are based on statistical methods that inherently include some bias. Therefore, the literature should be applied with engineering judgment. Actual impacts on operations and safety associated with changes in lane width may vary from the findings outlined here due to many factors that influence operations and safety (e.g., driver characteristics, geography, climate, presence of on-street parking, shoulder type, etc.).
Operations
While travel lane width influences multiple elements of operations, the most significant impacts that have been documented in literature relate to signalized intersection capacity, multilane segment travel speed, and two-lane highway segment travel speed.
Urban Street Intersection Capacity
Lane width is one of 11 factors reflected in the calculation of saturation flow. Saturation flow is a key parameter of intersection capacity per the Highway Capacity Manual (HCM) 2010 methodology (1). Saturation flow at intersections is also factored into Urban Street2 Level of Service as it impacts average through-vehicle travel speed.
Relevant research on the impact of lane width on saturation flow for through lanes on signalized intersection approaches is in general agreement. The measured saturation flow rates are similar for lane widths between 10 feet and 12 feet. For lane widths below 10 feet, there is a measurable decrease in saturation flow rate. Thus, so long as all other geometric and traffic signalization conditions remain constant, there is no measurable decrease in urban street capacity when through lane widths are narrowed from 12 feet to 10 feet.
2 The 2010 HCM defines Urban Street Facilities as portions of roadways that typically have two or more lanes, serve multiple travel modes, and have intersections spaced less than two miles apart on average.
Chapter 18 of the HCM 2010 describes the adjustment to signalized intersection saturation flow associated with lane width. The 2010 HCM includes updated adjustment factors compared to those provided in the 2000 HCM.
Per the HCM 2010,
“The lane width adjustment factor accounts for the negative impact of narrow lanes on saturation flow rate and allows for an increased flow rate on wide lanes. Values of this factor are listed in Exhibit 18-13.”
Exhibit 18-13: Lane Width Adjustment Factors for Urban Signalized Intersections (1)
Average Lane
Width (ft) Adjustment Factor <10.0 0.96 ≥10.0-12.9 1.00 ≥12.9 1.04
As indicated by the adjustment factors in Exhibit 18-13 of the HCM 2010, the reduction of lane widths below ten feet is associated with a four-percent reduction in saturation flow at signalized intersections on urban streets. Wide lanes, over 12.9 feet, are associated with the opposite effect, an increase in saturation flow of 4 percent.
Research on the impacts of lane widths on saturation flow conducted in 2007 by Potts, I.B., et.al. influenced changes to the HCM 2000 methodology that are reflected in the HCM 2010 lane width adjustment factors (1, 2). Potts’ research is summarized, with other relevant research on the impact of lane width on signalized intersection saturation flow, in the technical memorandum provided in Appendix “A”.
Travel Speed
Travel speed on multilane and two-lane highway segments is impacted by lane width. When determining segment capacity and level-of-service (LOS) on multilane and two-lane highways, the HCM 2010 suggests adjustments to free-flow speed (FFS) based on lane width. The FFS calculations and lane width adjustments apply to highways with directional traffic in general terrain (level or rolling). The adjustments apply to facilities in rural, suburban, and limited urban areas, but do not apply on facilities defined by the HCM as Urban Street Segments that have signalized intersections spaced less than two miles apart.
Table 1 presents FFS adjustments for lane widths of less than 12 feet on multilane highways.
DRAFT
Table 1: Adjustment to Free-Flow Speed for Average Lane Width for Multilane Highways (1)
Lane Width (ft) Reduction in FFS (mi/hr)
12 0.0
≥11-12 1.9
≥10-11 6.6
As shown in Table 1, on multilane highways free-flow speed is reduced by 1.9 miles per hour when a 12-foot lane is reduced by one foot or less. Free-flow speeds are reduced by more than three times that amount when a 12-foot lane is reduced to between 10 and 11 feet.
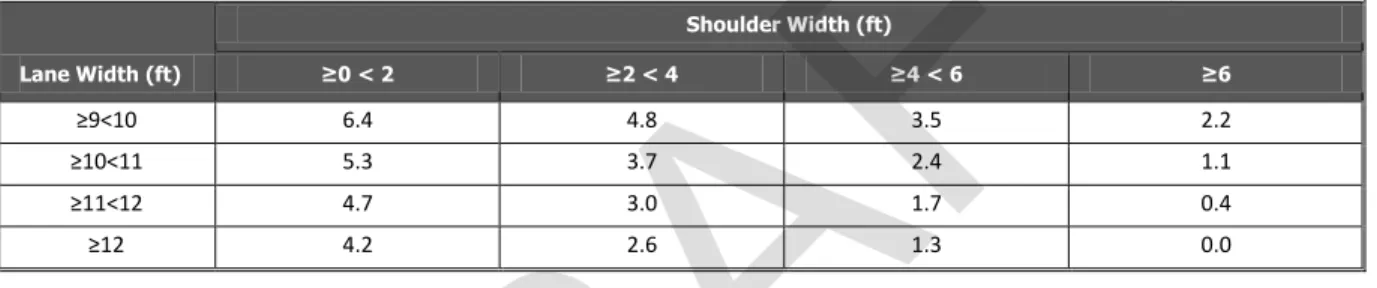
Table 2 summarizes the reduction in free-flow speed associated with various combinations of shoulder width and lane width on paved two-lane highways. The HCM generally describes two-lane highways as directional segments that may or may not include passing or truck climbing lanes.
Table 2: Reduction to Free-Flow Speed for Lane and Shoulder Width on Two-Lane Highways (mi/hr) (1)
Lane Width (ft) Shoulder Width (ft) ≥0 < 2 ≥2 < 4 ≥4 < 6 ≥6 ≥9<10 6.4 4.8 3.5 2.2 ≥10<11 5.3 3.7 2.4 1.1 ≥11<12 4.7 3.0 1.7 0.4 ≥12 4.2 2.6 1.3 0.0
As shown in Table 2, regardless of shoulder width, if lane width on two-lane highways is reduced from 12 to 11 feet, the difference in free-flow speed reduction does not exceed 0.5 miles per hour. It is also notable that if shoulder width is at least 6 feet and lane width is reduced, speeds on two-lane highways will not drop more than 2.2 miles per hour. However, if shoulder width is limited to 2 feet and lane width is reduced, speeds on two-lane highways may drop as much as 4.8 miles per hour, relative to a 12-foot lane with 6-foot shoulder.
The FFS reduction factors indicate the need to consider shoulder width and lane width together when evaluating the reallocation of right-of-way for bicycle lanes. It should also be noted that highway shoulders can be used as bicycle lanes, although posted speed and traffic volume will influence the percentage of the population that use the shoulder for bicycling.
Safety
Many highway engineers associate narrow travel lanes with a potential increase in crash frequency. However, this exercise of judgment has historically not been based on empirical evidence and the degree, to which crashes may increase, relative to lane width, is not definitive. In recent years several studies have been conducted to develop quantitative estimates of the impacts of lane width reductions on crash frequency. The research provides quantitative estimates that can be used to inform design decisions on rural roads and/or suburban segments.
Rural Road Segments
The Highway Safety Manual (HSM), published by the American Association of State Highway and Transportation Officials (AASHTO), is the most-recently published reference for evaluating the safety impacts of design decisions (3). The HSM provides Crash Modification Factors (CMFs) that indicate the expected change in crashes associated with various roadway design features. The CMFs are developed through empirical studies conducted throughout the United States. The HSM provides a combination of equations and values that reflect the change in crash frequency associated with reducing lane widths. The HSM does not indicate how crash frequency varies with respect to various combinations of lane and shoulder width. CMFs for lane width modifications are provided in Part C of the HSM. The CMFs were developed for Rural Two-Lane Roads and Rural Multilane Highways (4). The CMFs are a function of facility type, Average Annual Daily Traffic (AADT), and lane width.
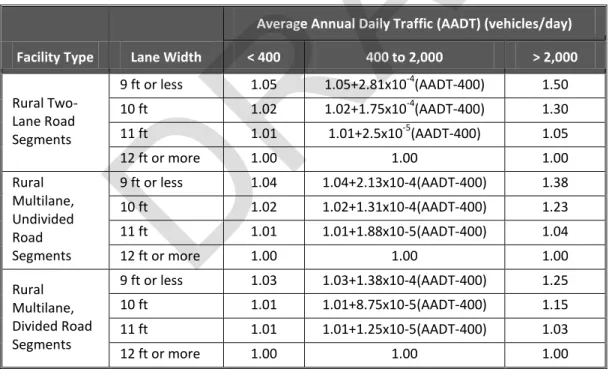
Table 3 includes a summary of the CMFs for each facility type. The base condition assumed is 12-foot lane width. The crash frequency predicted for reducing a 12-foot lane to a narrower lane is calculated by multiplying the number of crashes of the specific crash types (see table note) by the CMF for a narrower lane (considering facility type and AADT). Alternatively, the percentage change in crashes associated with a change of travel lane width can be calculated by dividing the CMF for the “new” width by the CMF for the “existing” width.
Table 3: CMFs for Lane Width on Road Segments by Facility Type (4)
Facility Type Lane Width
Average Annual Daily Traffic (AADT) (vehicles/day)
< 400 400 to 2,000 > 2,000 Rural Two-Lane Road Segments 9 ft or less 1.05 1.05+2.81x10⁻⁴(AADT-400) 1.50 10 ft 1.02 1.02+1.75x10⁻⁴(AADT-400) 1.30 11 ft 1.01 1.01+2.5x10⁻⁵(AADT-400) 1.05 12 ft or more 1.00 1.00 1.00 Rural Multilane, Undivided Road Segments 9 ft or less 1.04 1.04+2.13x10⁻⁴(AADT-400) 1.38 10 ft 1.02 1.02+1.31x10⁻⁴(AADT-400) 1.23 11 ft 1.01 1.01+1.88x10⁻⁵(AADT-400) 1.04 12 ft or more 1.00 1.00 1.00 Rural Multilane, Divided Road Segments 9 ft or less 1.03 1.03+1.38x10⁻⁴(AADT-400) 1.25 10 ft 1.01 1.01+8.75x10⁻⁵(AADT-400) 1.15 11 ft 1.01 1.01+1.25x10⁻⁵(AADT-400) 1.03 12 ft or more 1.00 1.00 1.00
NOTE: The collision types related to lane width to which these CMFs apply are single-vehicle run-off the-road and multiple-vehicle head-on, opposite-direction sideswipe, and same-direction sideswipe crashes.
Standard error of the CMF is unknown.
To determine the CMF for changing lane width and/or AADT, divide the “new” condition CMF by the “existing” condition CMF.
The CMFs in Table 3 indicate a reduction in lane width from 12 feet to 11 feet, on a rural two-lane road segment, would increase crashes by one percent if the AADT is less than 400 vehicles per day, or by approximately five percent if the AADT is greater than 2,000 vehicles per day. Additional guidance on the use of CMFs is provided in Part D of the HSM.
Urban and Suburban Arterial Safety
The Florida Department of Transportation (FDOT) conducted statistical analysis to evaluate the impacts of restriping multilane roadways to increase the outside lane width by “borrowing” width from inner lanes (5). The crash severity and frequency of the imbalanced lanes (i.e., asymmetrical) was assessed on four-lane roadways with either a flush, two-way left-turn lane (TWLTL) or a raised median. The study did not differentiate between the width of the center TWLTL or raised median. The study identified two trends that were statistically significant, as follows:
“given a 24-foot lane width for inside and outside through lanes, restriping the outside through lane to provide 13-foot lane width and leaving the inside lane with 11-foot lane width would result in a slight reduction of crashes for four-lane sections with raised median.”
“…if an extra 0.5 foot is added to the outside asymmetric lane to make it 13.5 feet wide while keeping the inside lane at 11 feet, a decrease in crashes is found for four-lane sections with raised or two-way-left-turn-lane (TWLTL) medians.” (5)
Potts, I.B. et.al. conducted research on the relationship between lane width and safety for roadway segments and intersection approaches on urban and suburban arterials as part of NCHRP Project 3-72:
Lane Widths, Channelized Right Turns, and Right-turn Deceleration Lanes in Urban and Suburban Areas
(6). The research included data from various roadway and intersection types in Minnesota and Michigan ranging from 2-lane undivided to four-lane divided roadways. They also considered how Average Annual Daily Traffic (AADT) and lane width together influence safety.
Several trends were observed in the data from Minnesota and Michigan, but inconsistencies exist between states. The researchers noted that “crash frequency in [Minnesota] was higher for 10-foot lanes than for 11- and 12-foot lanes on four-lane undivided arterials,” but the same was not true in Michigan. They also found that crash frequency in Michigan “was higher for 9-foot lanes than for 10-foot lanes on four-lane divided arterials.” The same was not true is Minnesota.
The researchers concluded that “…there was no indication of an increase in crash frequencies as lane width decreased for arterial roadway segments or arterial intersection approaches.” They noted the inconsistencies between states related to four-lane undivided and divided arterials and that in these cases the inconsistencies should not infer “the use of narrower lanes must be avoided.” But, rather the inconsistencies indicate that “narrower lanes be used cautiously in these situations unless local experience indicates otherwise.”
Impacts to Trucks and Buses
Design decisions regarding travel lane width (measured from center of stripe to center of stripe) require special considerations for trucks and buses with dimensions that exceed those of a passenger car. General guidance provided in A Policy on Geometric Design of Highways and Streets (i.e., The Green Book), published by AASHTO, indicates that “If substantial truck traffic is anticipated, additional lane width may be desirable (7).” This guidance is ideal, but not often realistic. When right-of-way is limited, the desire for additional travel lane width must be balanced with capacity needs and multimodal considerations, such as pedestrian crossing distance and presence of bicycle lanes.
Increasing lane width to accommodate trucks and buses should take into account whether the travel lane is adjacent to a shoulder, center two-way left-turn lane, or buffered pavement area. When a truck or bus travels in a lane adjacent to these facilities it minimizes the potential for sideswipe crashes and effectively allows more useable lane width for large vehicles, particularly those that have less than one foot of horizontal clearance on either side of their vehicle in a 12-foot travel lane.
Information from national design guides and applicable research conducted by the Florida Department of Transportation (FDOT) Transit Office is summarized below in order to understand whether a minimum travel lane width is necessary and what dimension is reasonable.
FDOT Transit Office Research
The FDOT Transit Office documented an evaluation of lane width needs for transit vehicles in a report titled “Integrating Transit into Traditional Neighborhood Design Policies - The Influence of Lane Width on Bus Safety (8).” The report summarizes their investigation into whether there is a significant relationship between travel lane widths and bus vehicle safety. Through surveys, crash analysis, incident report analysis, field observations, and physical constraints analysis the agency identified a strong correlation between lane width and bus vehicle safety. Specifically, the statewide crash database analysis identified 10 segments with the highest frequency of sideswipe crashes. Nine of the ten segments had average travel lane widths from 9 to 11 feet and seven of the ten had average travel lane widths of 10 feet or less.
The FDOT Transit Office report suggests a minimum of 12-foot outside lane width for roadways that serve as bus routes to minimize sideswipe crashes, and to meet Florida bicycle clearance standards (Florida Statute 316.083). A minimum inside lane width of 11 feet is suggested based on the 10.5 feet mirror-to-mirror width for buses.
Lane Widening on Horizontal Curves
The turn radii of trucks and buses generally results in the rear wheels tracking outside front wheels (off-tracking) when negotiating horizontal curves. To accommodate for these design vehicles, wider lanes are generally provided on horizontal curves. In some urban and rural areas widening pavement on curves is not feasible; in these cases the County has set length limits on vehicles. The amount of
widening on the curve can be calculated using equations provided in Section 3.3.10 of the AASHTO Green Book. The calculations are based on the design vehicle dimensions, which are also provided in the Green Book, for a range of vehicles, including multiple types of buses and trucks.
A common method for evaluating whether adequate lane width is provided is to use a turn template program, such as AutoTurn in AutoCAD/Microstation, to project the vehicle’s horizontal dimensions over the scaled roadway design. In situations where a lane width reduction is proposed on a horizontal curve the County could require the design be checked using AutoTurn.
The FDOT Transit Office research and turning width constraints indicate that lane width should be increased on facilities that serve as transit or freight routes. Given that there is no national empirical evidence to support a consistent minimum for all transit and freight routes, the design width should reflect design vehicle dimensions and demonstrate the design vehicle can navigate the study roadway without encroaching on adjacent lanes or sidewalk facilities.
DESIGN CONSIDERATIONS
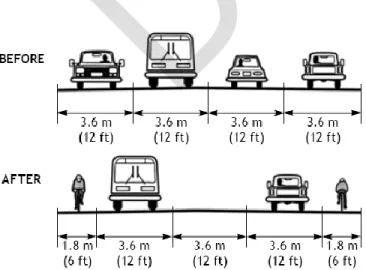
This section outlines local, state, and national guidance for establishing lane width. The review identifies design guidance that indicates how cross-sections can be varied to accommodate bicycles. The primary focus of the review of design guidance is related to reducing lane width within a constrained corridor to reallocate right-of-way for bike lanes on facilities that do not provide dedicated right-of-way for bicyclists. An alternative approach is to apply a “road diet” in which a 4-lane section is reduced to a 3-lane section (two directional travel lanes and one center TWLTL) with bicycle lanes. An example of a “before” and “after” condition of a road diet is shown in Figure 1.
Guidance on lane width from the Oregon Department of Transportation (ODOT), Washington County, and AASHTO is summarized below.
Figure 1: Example of Providing Bicycle Lanes through Implementation of a Road Diet (image credit: www.feetfirst.org/blog)
ODOT
ODOT’s Bicycle and Pedestrian Design Guide includes dimensions that serve as a “best practice” for application on state and local roadways (9). The document suggests that “restriping the roadway to add bike lanes is a practical approach” because it is often impractical to alter the curb-to-curb width of an existing roadway that does not have bicycle lanes. The guide suggests narrowing travel lane widths to accommodate bicycle lanes should take into account the width of the center left-turn lane and posted speeds, as shown in Table 4.
Table 4: Minimum Travel Lane Width by Travel Speed (9)
Posted Speed
(mph) Travel Lane Width (feet) Suggested Minimum Suggested Minimum Center Left-Turn Lane Width (feet)
≤25 10-11 -
≥30-40 11 12
≥45 12 12-14*
* 14 feet width is suggested when truck volumes are high
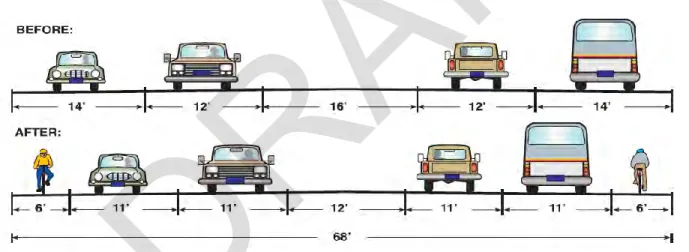
The Oregon Department of Transportation’s Bicycle and Pedestrian Design Guide provides an example of how an existing 5-lane roadway with a 68-foot cross-section could be modified to include bicycle lanes by narrowing travel lanes, as illustrated in Figure 2.
Figure 2: Example of Reallocating Cross-Section to Accommodate Bicycle Lanes (9)
Dimensions for ODOT highways must meet standards in ODOT’s Highway Design Manual (10). On local agency projects, when funds are administered through ODOT, AASHTO standards must be met. On local projects, funded locally, the Bicycle and Pedestrian Design Guide provides dimensions that can be adopted by local agencies or they can adopt their own.
AASHTO and Washington County Standards
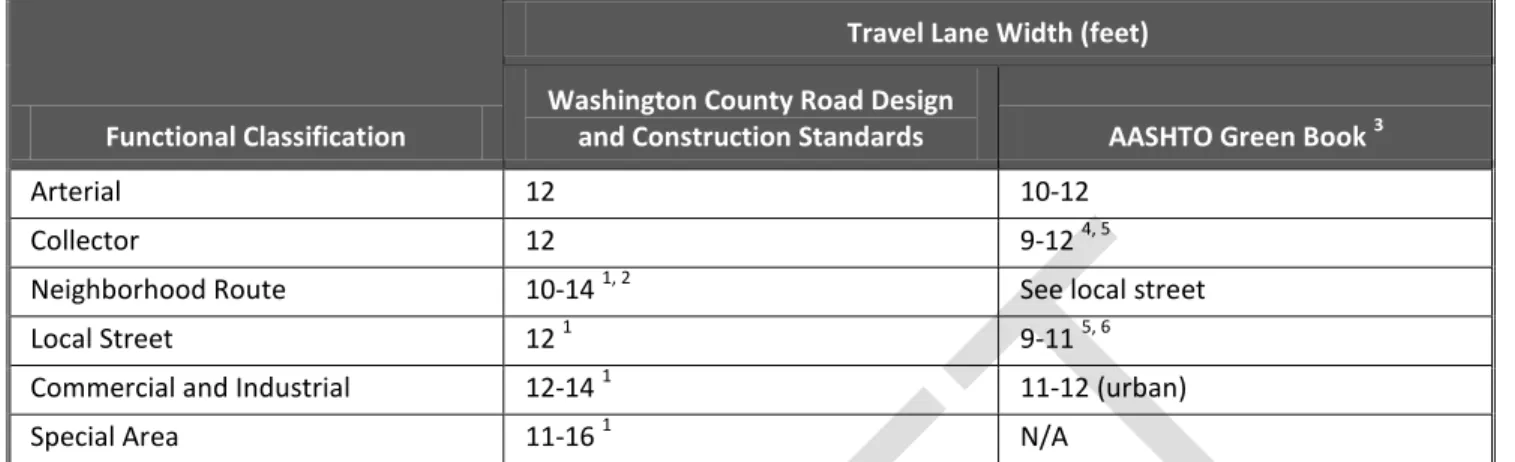
The AASHTO “Green Book” offers guidance on the selection of appropriate lane widths by facility type and roadway user based on established practices and national research (7). A comparison between AASHTO lane width guidance and the Washington County Road Design Standards for lane width is
provided in Table 2 (11). This comparison is intended to serve as a reference to identify where County standards exceed AASHTO standards and could be modified while satisfying AASHTO standards.
Table 2: Comparison of Washington County Road Design Standards with AASHTO Standards (7, 11)
Functional Classification
Travel Lane Width (feet)
Washington County Road Design
and Construction Standards AASHTO Green Book 3
Arterial 12 10-12
Collector 12 9-12 4, 5
Neighborhood Route 10-14 1, 2 See local street
Local Street 12 1 9-11 5, 6
Commercial and Industrial 12-14 1 11-12 (urban)
Special Area 11-16 1 N/A
1 Dependent on Washington County Designation determined by the county’s transportation plan and land use decisions. 2 Dependent on whether parking is provided on one, both, or neither side of street.
3 Additional information regarding provisions for bicyclists are provided in the AASHTO Guide for the Development of
Bicycle Facilities (12)
4 Dependent on average daily traffic volumes.
5 Minimum lane widths of 9 or 10 feet is only suggested in “highly restricted areas with little to no truck traffic.” 6 Up to 12-foot width at intersections.
As shown in Table 2, the County’s Road Design Standards generally exceed the AASHTO standards. Therefore, if the County were to allow reduced lane widths, in many cases they would still be consistent with AASHTO minimum lane widths. The FHWA publication, Flexibility in Highway Design,
provides guidance that indicates the need to take into account right-of-way constrictions when evaluating lane width decisions (13).
“Generally, as the design speed of a highway increases, so must the lane width to allow for the lateral movement of vehicles within the lane. However, constricted right-of-way and other design restrictions can have an impact on this decision. Chapter IV of the Green Book recognizes the need for flexibility in these cases: Although lane widths of 12 feet are desirable on both rural and urban facilities, there are circumstances that necessitate the use of lanes less than 12 feet wide. In urban areas where right-of-way and existing development become stringent controls, the use of 11 feet lanes is acceptable.”
The AASHTO Green Book also identifies 11 feet as adequate width for center two-way left-turn lanes. Little to no discussion is provided regarding trade-offs of TWLTL widths.
FINDINGS
The literature highlights the trade-offs of reducing lane width and provides empirical support for small variations from standard widths based on decisions that balance mobility targets, safety goals, and design user needs of the roadway. The following trends and quantitative findings were identified:
Urban Signalized Intersections
There is no measurable decrease in urban street capacity when through lane widths are narrowed from 12 feet to 10 feet, assuming all other geometric and traffic signalization conditions remain constant.
Rural Road Segments
On rural road segments, reducing lane width from 12 feet to 11 feet may increase the frequency of specific crash types by less than five percent.
Multilane Highways
On rural and suburban multilane highways, free-flow speed is reduced by 1.9 miles per hour between 11 and 12-foot lane width. Free-flow speeds are reduced by more than 3 times that amount when the lane width drops below 11 feet.
On rural and suburban multilane highways, “given a 24-foot lane width for inside and outside through lanes, restriping the outside through lane to provide 13-foot lane width and leaving the inside lane with 11-foot lane width would result in a slight reduction of crashes for four-lane sections with raised median.”
For four-lane sections with raised or two-way-left-turn-lane (TWLTL) medians, “…if an extra 0.5 foot is added to the outside asymmetric lane to make it 13.5 feet wide while keeping the inside lane at 11 feet, a decrease in crashes is found.”
Two-Lane Highways
On two-lane highways (with more than two miles between signalized intersections), if lane width is reduced from 12 to 11 feet, the difference in free-flow speed reduction is less than 0.5 miles per hour.
RECOMMENDATIONS
While the literature provides support for reducing lane width in limited situations, overall trends indicate it should be considered in other situations when right-of-way constraints exist and there are few other options for accommodating bicycle traffic. An example of reallocating lane width to accommodate dedicated bicycle lanes is provided in Figure 2.
The research provides for more definitive assessments of design decisions regarding lane width reductions. Therefore, when right-of-way constrains a roadway cross-section, we recommended that travel lane width reductions be considered a viable solution for accommodating all motorized and non-motorized users. Specifically, when right-of-way constraints exist we recommended that Washington County allow width reductions from 12 feet to 11 feet in travel lanes that do not carry high volumes of transit and/or freight vehicles. For example, on multi-lane facilities the inside lane width may be reduced to 11 feet, but the outside lane may remain 12 feet to accommodate wider design vehicles.
REFERENCES
1) TRB. Highway Capacity Manual. 2010.
2) Potts, I.B., et.al., Relationship of Lane Width to Safety on Urban and Suburban Arterials. Transportation Research Record: Journal of the Transportation Research Board, No. 2023. Washington, DC. 2007.
3) American Association of State Highway and Transportation Officials. Highway Safety Manual. Washington, DC. 2010.
4) Harwood, D. W., F. M. Council, E. Hauer, W. E. Hughes, and A. Vogt, Prediction of the Expected Safety Performance of Rural Two-Lane Highways. FHWA-RD-99-207, Federal Highway Administration, U.S. Department of Transportation, McLean, VA. 2000.
5) Sando, T., and R. Moses, Operational and Safety Impacts of Restriping Inside Lanes of Urban Multilane Curbed Roadways to 11 Feet or Less to Create Wider Outside Curb Lanes for Bicyclists – BDK82 977-01. Florida Department of Transportation. Tallahassee, FL. 2011.
6) Potts, I.B., et.al. NCHRP Project 3-72: Lane Widths, Channelized Right Turns, and Right-turn Deceleration Lanes in Urban and Suburban Areas. TRB. Washington, DC. 2006.
7) American Association of State Highway and Transportation Officials. A Policy on Geometric Design of Highways and Streets, Sixth Edition. Washington, DC. 2011.
8) Florida Department of Transportation Public Transportation Transit Office. Integrating Transit into Traditional Neighborhood Design Policies - The Influence of Lane Width on Bus Safety. 9) Oregon Department of Transportation. OregonBicycle and Pedestrian Design Guide. Salem, OR.
2011
10)Oregon Department of Transportation. Highway Design Manual. Salem, OR. 2012 11)Washington County, Oregon. Road Design and Construction Standards. 2011
12)American Association of State Highway and Transportation Officials. Guide for the Development of Bicycle Facilities – Fourth Edition. Washington, DC. 2012.
13)FHWA. Flexibility in Highway Design. Accessed on 12-11-12 at:
http://www.fhwa.dot.gov/environment/publications/flexibility/ch00.cfm#admin
APPENDIX
Technical Memorandum
Date: March 22, 2007 Project #: 7969.
To: Sprinkle Consulting Engineers
From: John Zegeer
Copy to: Patrick McMahon and Paul Ryus
Subject: The Effect of Lane Width on Urban Street Capacity FDOT Conserve by Bicycle Project
One of the goals of the FDOT Conserve by Bicycle project is to determine how the provision of bicycling facilities can enhance opportunities for recreational travel. One potential treatment that is being considered for accommodating additional bicycle travel along urban streets is the narrowing of street lane widths in order to provide a striped bicycle lane on the paved roadway surface adjacent to these narrower lanes. In considering this treatment, a concern has been raised regarding the reduction in roadway capacity (for motorized vehicles) that could occur due to the lane width reduction.
The purpose of this memorandum is to provide a summary of relevant research that describes the relationship between lane width and urban street capacity. The next section of this memorandum summarizes the method by which urban street capacity is determined. Then, a summary of relevant research is provided. Finally, conclusions are drawn as to the impact of narrowing lanes on urban street capacity.
How is Urban Street Capacity Determined?
Chapter 15 of HCM2000 provides the methodology for analyzing urban streets.
(Highway Capacity Manual 2000. Fourth Edition. Transportation Research Board., Washington, D.C. 2000.) “Urban street level of service is based on average through-vehicle travel speed for the segment or for the entire street under consideration. The average travel speed is computed from the running times on the urban street (between signalized intersections) and the control delay experienced by through movements at signalized intersections.” (page 15-2) “The capacity of an urban street is defined for a single direction of travel as the capacity of the through movement at its lowest point (usually at a signalized intersection). The capacity is determined by the number of lanes, the saturation flow rate per lane (influenced by geometric
The Effect of Lane Width on Urban Street Capacity
October 29, 2008 Page 2
design and demand factors), and the green time per cycle for the through movement at the intersection.” (page 15-9)
Chapter 16 of HCM2000 provides the methodology for analyzing signalized intersections. This methodology includes the determination of the saturation flow rate for each lane group. “The saturation flow rate is the flow in vehicles per hour that can be accommodated by the lane group assuming that the green phase were displayed 100 percent of the time (i.e., g/C = 1.0).” (page 16-9) The equation for this calculation is shown below:
Rpb Lpb RT LT LU a bb p g HV w oNf f f f f f f f f f f s s (Equation 16-4) where
s saturation flow rate for subject lane group, expressed as a total for all lanes in lane group (veh/h);
o
s base saturation flow rate per lane (pc/h/ln);
N number of lanes in lane group;
w
f adjustment factor for lane width;
HV
f adjustment factor for heavy vehicles in traffic stream;
g
f adjustment factor for approach grade;
p
f adjustment factor for existence of a parking lane and parking activity adjacent to lane group;
bb
f adjustment factor for blocking effect of local buses that stop within intersection area;
a
f adjustment factor for area type;
LU
f adjustment factor for lane utilization;
LT
f adjustment factor for left turns in lane group;
RT
f adjustment factor for right turns in lane group;
Lpb
f pedestrian adjustment factor for left-turn movements; and
Rpb
f pedestrian-bicycle adjustment factor for right-turn movements.
As shown in the above equation, the adjustment factor for lane width is the first of the eleven adjustment factors that is used in calculating the saturation flow rate for the subject lane group. “The lane width adjustment factor, fW, accounts for the negative impact of narrow lanes
on saturation flow rate and allows for an increased flow rate on wide lanes.” (page 16-10) Summary of Relevant Research
Four relevant research documents were found that provide guidance on the relationship between lane width and saturation flow rate:
The Effect of Lane Width on Urban Street Capacity
October 29, 2008 Page 3
1. Potts, I.B., et.al. Relationship of Lane Width to Saturation Flow Rate on Urban and Suburban
Signalized Intersection Approaches. Presented at the 2007 Transportation Research Board
Annual Meeting. Accepted for publication in a Transportation Research Record. 2. Zegeer, J.D. Field Validation of Intersection Capacity Factors. Transportation Research
Record 1091, Transportation Research Board. 1986.
3. Agent, K.R. and J.D. Crabtree. Analysis of Saturation Flow at Signalized Intersections.
Kentucky Transportation Research Program University of Kentucky. February, 1983. 4. Bonneson, J.A. Modeling Queued Driver Behavior at Signalized Junctions. Transportation
Research Record 1365, Transportation Research Board. 1992.
The first paper cited above provides an overview of the other three research documents. So, the remainder of this section contains direct quotes from that paper.
Zegeer (2) evaluated the saturation flow rates on approaches with lane widths varying between 2.6 and 4.7 m (8.5 and 15.5 ft). Saturation flow data was collected from 2,733 vehicles on eleven approaches with lane widths varying between 2.6 and 2.9 m (8.5 and 9.5 ft). Four approaches with lane widths varying between 3.9 and 4.7 m (13.0 and 15.5 ft) were also surveyed, with a sample size of 1,568 saturation flow vehicles. All baseline conditions except for lane width were held constant at these locations. The survey results were then compared with those of the baseline condition surveys (with a sample size of 6,687 saturation flow vehicles). The narrower lane widths demonstrated saturation flow rates between 2 and 5 percent less than did those in the baseline surveys, while the wider lane widths demonstrated saturation flow rates 5 percent greater than did those in the baseline surveys. Zegeer proposed the following lane width adjustment factors:
Lane width category (ft) adjustment factor Saturation flow
8 – 8.9 0.95
9 – 9.9 0.98
10 – 12.9 1.00
13 – 15.9 1.05
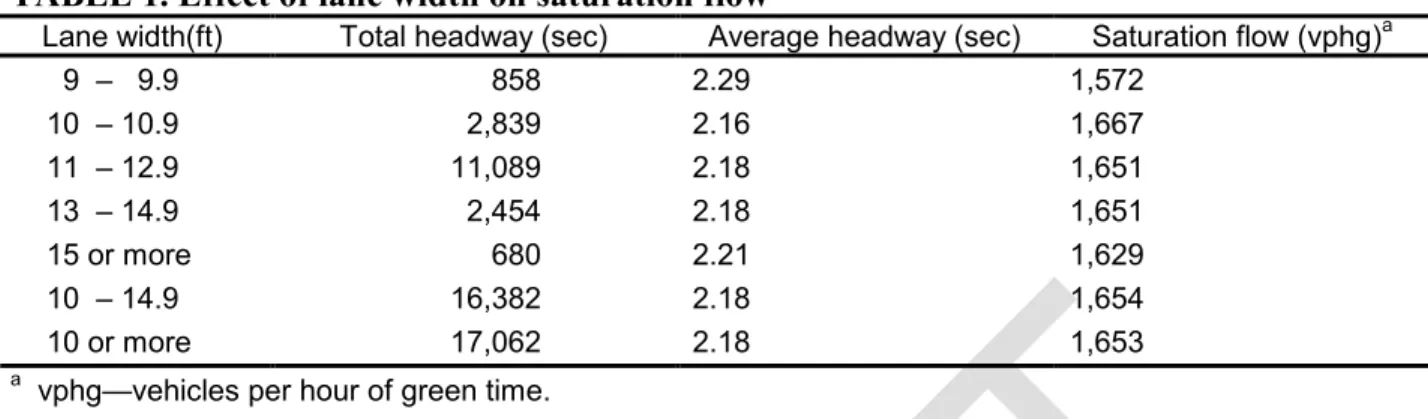
A 1983 study by Agent (3) of the effects of lane width on saturation flow indicated that lane width did not have an effect on saturation flow for lane widths of 3.0 m (10 ft) or more. For lane widths between 2.7 and 3.0 m (9 and 10 ft), a 5 percent reduction in saturation flow was found compared to lane widths of 3.0 m (10 ft) or more. No lane widths below 2.7 m (9 ft) were observed. There was a slight unexplained reduction in saturation flow for lane widths greater than 4.5 m (15 ft). A similar analysis was performed with the limited data available for
commercial vehicles, and no effect was found even for lane widths below 3.0 m (10 ft). Table 1 illustrates the effect of lane width on saturation flow found by Agent.
The Effect of Lane Width on Urban Street Capacity
October 29, 2008 Page 4
TABLE 1. Effect of lane width on saturation flow
Lane width(ft) Total headway (sec) Average headway (sec) Saturation flow (vphg)a
9 – 9.9 858 2.29 1,572 10 – 10.9 2,839 2.16 1,667 11 – 12.9 11,089 2.18 1,651 13 – 14.9 2,454 2.18 1,651 15 or more 680 2.21 1,629 10 – 14.9 16,382 2.18 1,654 10 or more 17,062 2.18 1,653
a vphg—vehicles per hour of green time.
In a 1992 study by Bonneson (4), it was determined that discharge headway is a function of a vehicle’s position in the queue and, therefore, measurements taken between the fourth and eighth vehicles will have longer headways than measurements taken between the eighth and eleventh vehicles. Using empirical data from two study sites, Bonneson developed a model to estimate the impact of queue position on saturation flow rate. Bonneson found that the minimum discharge headway using queue positions four through ten is about 0.02 s/veh shorter than that found when using queue positions four through eight. This difference translates into a base saturation flow rate ratio of 1.3 percent.
The following text summarizes the research results from the study conducted by Potts, et.al. (1):
Field studies were conducted at signalized intersections to determine the difference in saturation flow rates of exclusive through lanes with 2.7-, 3.0-, 3.3-, 3.6-, and 4.0-m (9-, 10-, 11-, 12-, and 13-ft) lane widths. Left- and right-turn vehicles were not surveyed. Data collection focused on through travel lanes under the most ideal conditions possible to minimize the influence of site-specific factors. At those intersection approaches where exclusive left- or right-turn lanes were present, vehicles right-turning from the exclusive right-turn lanes were observed for a minimum period of time to ensure that they did not influence surveyed vehicles in the adjacent through lanes. To eliminate any influence of turning vehicles at sites with shared through-right or through-left lanes, data were not collected for signal cycles during which any turning
movement took place.
Saturation flow headways were measured beginning when the front axle of the fourth vehicle in queue crossed the stop bar. The cumulative elapsed time was then measured when the front axle of the last vehicle in queue (stopped at the onset of the green signal phase) crossed the stop bar. Any impedance (driveway movements, bus stop activity, pedestrian or bicycle activity) that could influence the saturation flow rate during a surveyed signal green phase was noted. The number of heavy vehicles per cycle was documented.
For analysis purposes, the study sites were grouped into lane width categories as follows:
2.9 m (9.5 ft) (9 study sites)
3.3 to 3.6 m (11 to 12 ft) (12 study sites)
The Effect of Lane Width on Urban Street Capacity
October 29, 2008 Page 5
4.0 m (13 ft) and greater (4 study sites)
From the average headway of each headway sample, an average saturation flow rate was calculated. Table 2 presents basic average saturation flow statistics (sample size, mean, median, minimum, maximum, standard deviation, and relative standard deviation) for each lane width category.
TABLE 2. Average saturation flow statistics (pc/h/ln) for each lane width category
Lane width
category (ft) N Mean Median Minimum Maximum Standard deviation CV (%)1
9.5 334 1,752 1,714 711 3,000 282 16.1 11 to 12 653 1,830 1,831 550 2,746 274 15.0 13+ 209 1,913 1,901 962 3,000 293 15.3 Total 1,196
1 Coefficient of variation = 100% x standard deviation/mean.
The results of this research indicate that using narrow lanes (i.e., 2.9 m [9.5 ft]) on signalized intersection approaches on urban and suburban arterials resulted in an average saturation flow rate that is approximately 78 to 79 pc/h/ln, or 4.3 percent, lower than if 3.3- to 3.6-m (11- to 12-ft) lanes are used. Similarly, using lane widths of 4.0 m (13 ft) or greater resulted in an average saturation flow rate that is approximately 82 to 84 pc/h/ln, or 4.3 to 4.4 percent, higher than if 3.3- to 3.6-m (11- to 12-ft) lanes are used. Both relationships were negligibly affected by whether average saturation flow was adjusted for the position of the vehicle in the queue.
The HCM provides saturation flow rate adjustment factors for lane widths that are greater than or less than 3.6 m (12 ft). Table 3 compares the saturation flow rate estimates based on HCM procedures to those measured in the current research. The table shows that the
measured saturation flow rate values are generally lower than those obtained from HCM procedures. Furthermore, the percent difference in saturation flow rate between sites with 2.9- to 3.6-m (9.5-to 12-ft) lanes was found to be about half the value used in the HCM. These findings should be considered as a basis for revisions to the HCM. In particular, there appears to be justification for revising the HCM lane width adjustment factors for lane widths less than 3.6 m (12 ft).
TABLE 3. Comparison of saturation flow rate values from this research to HCM values
Lane width (ft) HCM Current research Adjusted saturation flow ratea (pc/h/ln) Percent difference from value for
12-ft lanes Adjusted saturation flow rateb (pc/h/ln) Percent difference from values for
12-ft lanes 9.5 1,742 –8.3 1,736 –4.4 11 1,837 –3.3 1,815c 0 11.5 1,868 –1.7 1,815c 0 12 1,900 0.0 1,815c 0
DRAFT
The Effect of Lane Width on Urban Street Capacity
October 29, 2008 Page 6
13 1,963 +3.3 1,898d +4.5
14 2,026 +6.7 1,898d +4.5
a The HCM saturation flow rates have been adjusted for lane width.
b The saturation flow rates from the current research have been adjusted for queue position. c This value was derived for sites with a range of lane widths from 11 to 12 ft.
d This value was derived for sites with a range of lane widths of 13 ft or more.
Conclusions Drawn from the Research
All of the relevant research is in general agreement as to the impact of narrowing lane width on saturation flow for through lanes on signalized intersection approaches. The measured saturation flow rates are similar for lane widths between 10 feet and 12 feet. For lane widths below 10 feet, there is a measurable decrease in saturation flow rate. Thus, so long as all other geometric and traffic signalization conditions remain constant, there is no measurable decrease in urban street capacity when through lane widths are narrowed from 12 feet to 10 feet.