National Accounts
Satellite Accounts
Statistics of the non-profit sector for South Africa, 2012
February 2015 Discussion document: D0407.2
Statistics of the non-profit sector for South Africa, 2012
Pali Lehohla
Statistician-General
Discussion document: D0407.2
Statistics South Africa
Statistics of the non-profit sector for South Africa, 2012
Published by Statistics South Africa, Private Bag X44, Pretoria 0001 © Statistics South Africa, 2015
Users may apply or process this data, provided Statistics South Africa (Stats SA) is acknowledged as the original source of the data; that it is specified that the application and/or analysis is the result of the user's independent processing of the data; and that neither the basic data nor any reprocessed version or application thereof may be sold or offered for sale in any form whatsoever without prior permission from Stats SA.
Statistics of the non-profit sector for South Africa, 2012/Statistics South Africa. Pretoria: Statistics South Africa, 2015
Discussion No.D0407.2 Title continuous in English only
A complete set of Stats SA publications is available at Stats SA Library and the following libraries: National Library of South Africa, Pretoria Division
National Library of South Africa, Cape Town Division Library of Parliament, Cape Town
Bloemfontein Public Library
Natal Society Library, Pietermaritzburg Johannesburg Public Library
Eastern Cape Library Services, King William's Town Central Regional Library, Polokwane
Central Reference Library, Mbombela Central Reference Collection, Kimberley Central Reference Library, Mmabatho
This discussion document is available on the Stats SA website: www.statssa.gov.za
Copies are available from: Printing and Distribution, Statistics South Africa Tel: 012 310 8044/310 8161
Fax: 012 321 7381 012 310 2973
Statistics South Africa ii
Contents
List of tables ... iii
List of figures ... iv
Abbreviations and acronyms ... v
Preface ... vi
Chapter 1: Introduction ... 1
1.1: Definition of non-profit institution in the System of National Accounts ... 2
1.2: Definition of non-profit institution in the handbook on non-profit institutions in the System of National Accounts ... 2
1.3: Definition of non-profit institution reviewed and adopted by South Africa... 3
Chapter 2: Progress on the development of the non-profit institutions satellite account for South Africa ... 5
2.1: The approval of the South African non-profit institutions classification ... 5
2.2: Testing of the administrative data ... 5
2.3: Voluntary activity survey ... 9
Chapter 3: Financial and non-financial indicators of non-profit institutions in South Africa ... 11
3.1: Types of non-profit institution by legal entity ... 11
3.2: Cross-classification of institutional sectors ... 16
3.3: Income of South African non-profit institutions ... 17
3.4: Expenditure of South African non-profit institutions ... 20
3.5: Final consumption expenditure of non-profit institutions controlled by government ... 22
Chapter 4: Conclusion ... 24
Glossary ... 25
List of tables
Table 1: Types of non-profit institution by legal entity and objectives, 2012,
2013 and 2014 (number) ... 13 Table 2: Types of non-profit institution by legal entity and objectives, 2012,
2013 and 2014 (%) ... 15 Table 3: Cross-classification of production account items by institutional sector,
Statistics South Africa iv
List of figures
Figure 1: Income of South African non-profit institutions, 2010, 2011 and 2012 ... 18
Figure 2: Category of income by types of non-profit institution, 2012 ... 19
Figure 3: Expenditure of South African non-profit institutions, 2010, 2011 and 2012 ... 20
Figure 4: Category of expenditure by types of non-profit institution, 2012 ... 21
Figure 5: Final consumption expenditure of South African non-profit institutions controlled by government, 2010, 2011 and 2012 ... 22
Figure 6: Category of final consumption expenditure by types of non-profit institution controlled by government, 2012 ... 23
Abbreviations and acronyms
BSF Business Sampling Frame
CBO Community-based organisation
CCIS Cross-classification of Institutional Sectors CIPC Companies and Intellectual Property Commission
DDG Deputy Director-General
DSD Department of Social Development EMF Executive Managers' Forum
Exco Executive Committee
FBOs Faith-based Organisations GDP Gross domestic product
GVA Gross value added
ICNPO International Classification of Non-profit Organisations IEA Integrated Economic Accounts
IES Income and Expenditure Survey IMF International Monetary Fund ILO International Labour Organization
ISIC International Standard Industrial Classification NGO Non-governmental Organisation
NPC Non-profit Company
NPI Non-profit Institution
NPISA Non-profit Institutions Satellite Account NPISH Non-profit institutions serving households
NPO Non-profit Organisation
OECD Organisation for Economic Co-operation and Development QLFS Quarterly Labour Force Survey
SAC Standard Approval Committee
SG Statistician-General
SANPIC South African Non-profit Institutions Classification SASQAF South African Statistical Quality Assessment Framework SARB South African Reserve Bank
SIC Standard Industrial Classification SNA System of National Accounts SOP Standard Operating Procedure Stats SA Statistics South Africa
SU-tables Supply and Use Tables
The dti Department of Trade and Industry
UN United Nations
UNV United Nations Volunteer VAS Voluntary Activity Survey
Statistics South Africa vi
Preface
The aim of this discussion document is to provide an overview of the current financial and non-financial statistics of the non-profit sector for South Africa for the reference year 2012, and to provide progress on the development of the South African non-profit institutions satellite account (NPISA).
The System of National Accounts (SNA) defines non-profit institutions (NPIs) as ’legal or social entities created for the purpose of producing goods and services whose status do not permit them to be a source of income, profit or other financial gain for the units that establish, control or finance them. In practice, their productive activities are bound to generate either surpluses or deficits but any surpluses they happen to make cannot be appropriated by other institutional units. The articles of association by which they are established are drawn up in such a way that the institutional units which control or manage them are not entitled to a share in any profits or other income which they receive’.
This definition contains some ambiguities with respect to the borders between NPIs and both corporations and government. So the working definition of an NPIs consists of units that are:
• Organisations;
• Not-for-profit and non-profit distributing;
• Institutionally separate from government;
• Self-governing; and
• Non-compulsory.
There has been increasing interest in recent years, internationally, in the set of entities or institutions known variously as 'non-profit', 'voluntary' or 'non-government' organisations. In order to differentiate them from corporations and government institutional units, these entities are referred to as NPIs in the national accounts. The scale and number of such organisations have been increasing and they have taken on expanded roles as governments seek to provide social and other services in more flexible, cost-effective ways. At the same time, economic statistics covering NPIs have been quite limited1.
Chapter 1: Introduction
The System of National Accounts (SNA) is a set of international guidelines for the development of economic accounts and for reporting such statistics to international organisations in a manner comparable across countries. The SNA provides an integrated framework of concepts, definitions, accounting rules, classifications and accounts and tables, all designed to organise in an analytically useful way the transactions, other flows and stocks that make up the accounting record of the economy2.
The SNA guidelines suggest the expansion of the SNA through the development of satellite accounts and more targeted handbooks in order to offer additional instructions and provide specific approaches and technical advice to national accountants, statisticians and other users of national accounts data on specialised topics3. A satellite account is a term developed by the United Nations
(UN), the World Bank, the International Monetary Fund (IMF), and the Organisation for Economic Co-operation and Development (OECD) to expand the SNA in order to measure the employment and size of economic sectors not defined as industries in the national accounts.
Non-profit institutions (NPIs) play an important role in national economies and policy. Their measurement in the SNA and the explicit reporting of the NPI figures are important functions to improve economic statistics and provide policy, business, and civic leaders with information that will help them to make decisions.
NPIs have been at the centre of a growing effort to document and study their role in recent years, internationally. Often referred to interchangeably as 'civil society', the 'voluntary', 'third' or 'independent' sector, this group of organisations plays a critical role in society, separate from that of governments or corporations, and is central to community engagement and the building of social capital. NPIs have now gained prominence in many countries' official economic statistics4.
The Handbook on Non-Profit Institutions in the System of National Accounts is one in a series of handbooks dealing with various components of the SNA. The emphasis of the Handbook is on three areas:
• The definition of an NPI is detailed, which makes it possible to identify it within a certain group of activities;
• The valuation of volunteer labour, which is significant in the activities of NPIs; and
• The introduction of the detailed classification of NPIs by function5.
None of these elements is available in the concepts and classifications of the central framework of the SNA.
2 Source: System of National Accounts
3 Source: System of National Accounts
4 Source: Statistics Canada, Satellite Account of Non-profit Institutions and Volunteering, 2006–2007
Statistics South Africa 2
1.1: Definition of non-profit institution in the System of National Accounts
NPIs are separately identified as institutional units. That is, they are capable in their own right of owning assets, incurring liabilities, and engaging in economic activities and in transactions with other entities.
NPIs may be created by households, corporations, or government, but the motive leading to their creation varies. For example, NPIs may be created to provide services for the benefit of the households or corporations who control or finance them; or they may be created for charitable, philanthropic or welfare reasons to provide goods or services to other persons in need; or they may be intended to provide health or education services for a fee, but not-for-profit; or they may be intended to promote the interests of pressure groups in business or politics; etc. Although they may provide services to groups of persons or institutional units, by convention they are deemed to produce only individual services and not collective services.
1.2: Definition of non-profit institution in the handbook on non-profit
institutions in the System of National Accounts
For the purpose of the satellite account on NPIs, the Handbook defines NPIs as consisting of (a) organisations that (b) are not-for-profit and, by law or custom, do not distribute any surplus they may generate to those who own or control them, (c) are institutionally separate from government, (d) are self-governing, and (e) are non-compulsory.
This definition contains some ambiguities with respect to the borders between NPIs and both corporations and government. So the working definition of the non-profit sector consists of units that are defined as follows:
• Organisation means that the entity has an institutional reality. Institutional reality can be signified by some degree of internal organisational structure, persistence of goals, structure, and activities, meaningful organisational boundaries, or legal charter of incorporation. Most NPIs are legal entities created by process of law whose existence is recognised independently of the persons, corporations or government units that establish, finance, control or manage them. Those entities can take the legal form of voluntary associations, non-profit companies or trusts;
• Not-for-profit and non-profit distributing: NPIs are organisations that do not exist primarily to generate profit, either directly or indirectly, and that are not primarily guided by commercial goals and considerations. NPIs may accumulate a surplus in a given year, but any such surplus must be ploughed back into the basic mission of the agency and not distributed to the organisation's owners, members, founders or governing board;
• Institutionally separate from government: NPIs are not part of the apparatus of government and do not exercise governmental authority in their own right. An NPI may receive significant financial support from government and it may have public officials on its board; however, it has sufficient discretion with regard to the management of both its production and its use of funds that its operating and financing activities cannot be fully integrated with government finance in practice;
• Self-governing: An NPI is able to control its own activities and is not under the effective control of any other entity. This means that the NPI is in charge of its own destiny, i.e. it can dissolve itself, set and change its by-laws and alter its mission or internal structure without having to secure permission from any other authority; and
• Non-compulsory: Membership and contributions of time and money are not required or enforced by law or otherwise made a condition of citizenship.
This definition is illustrated by examples and applied to organisations which are on the borderline of an NPI, or either a corporation, government or a household unit (cooperatives, mutuals, self-help groups, social ventures, rehabilitation centres, universities, hospitals, indigenous or territorial groups, etc.).
Because NPI status is determined by legal, structural and operational characteristics rather than by production or revenue characteristics, the NPI cannot be defined as an aggregate over a particular set of International Standard Industrial Classification (ISIC) classes. Even though NPIs are concentrated in such service activities as education, human health and social work, in principle NPIs may be found anywhere in the International Classification of Non-profit Organisations (ICNPO) structure. Furthermore, not all units in a particular ICNPO class will necessarily be an NPI even though the majority may be6.
1.3: Definition of non-profit institution reviewed and adopted by South Africa
This sub-section will discuss the definitions used in South Africa as reviewed and adopted by the NPISA inter-institutional working group.
1.3.1: Definition of non-profit institution
'NPI' is an associated term for civil society organisations that range from faith- and community-based organisations, charities (welfare) and traditional organisations like social and sports clubs, to a host of other development and social forms of organisations working tirelessly within the social fabric of society. These organisations are commonly referred to as non-governmental organisations (NGOs), community-based organisations (CBOs) and faith-based organisations (FBOs).
In the late 1990s, the Department of Social Development (DSD) established a technical team to work on the definition of an NPI for South Africa. The definition adopted was included in the Non-profit Organisations (NPO) Act, 1997 (Act No. 71 of 1997). The definition is as follows: 'NPI is a trust, company or other association of persons established for a public purpose, and the income and property of which are not distributable to its members or office-bearers, except as reasonable compensation for services rendered'7.
The NPISA inter-institutional working group reviewed the structural-operational definition of the NPI. During the financial year 2012/2013, the NPISA inter-institutional working group agreed that the following structural-operational definition will be used for the purpose of the compilation of the NPISA for South Africa:
NPI should be legal entity created by process of law whose existence is recognised independently of the persons, corporations, or government units that establish, finance, control or manage them. An NPI should be not-for-profit. NPI is organisation that does not exist primarily to generate profit, either directly or indirectly and is not primarily guided by commercial goals and considerations. The NPI may accumulate a surplus, but any such surplus must be ploughed back into the basic mission of the NPI and not distributed to its members or owners.
An NPI should also be self-governing. An NPI is able to control its own activities and is not under the effective control of any other entity. An NPI should be institutionally separate from government. This means that an NPI is not part of the apparatus of government and does not exercise governmental authority in its own right. The NPI may receive significant financial support from government and it may have public officials on its board; however, it has sufficient discretion with regard to the management of both its production and its use of funds that its operating and financing activities cannot be fully integrated with government finances in practice.
An NPI should be non-compulsory. An NPI's membership and contributions of time and money are not required or enforced by law or otherwise made a condition of citizenship8.
6 Source: Handbook on Non-Profit Institutions in the System of National Accounts
7 Source: The size and scope of the non-profit sector in South Africa
Statistics South Africa 4
There are certain types of organisations that are likely to occupy a grey area between the non-profit sector and either the corporation or government sectors. Some of those entities will properly belong within the non-profit sector for the purpose of a satellite account, while others will not. The Handbook illustrates the following guidelines to be applied to those types of organisations:
• Cooperatives are autonomous associations of persons who voluntarily cooperate for their mutual social, economic and cultural benefit. A cooperative includes non-profit communities and businesses that are owned and managed by the people who use its services and/or by the people who work there. The basic principles of cooperatives include:
o Democratic control – that is, one person, one vote;
o Shared identity – that is, members are both owners and customers; and o Orientation – to provide services to members 'at cost'.
If the Articles of Association of a cooperative prevents it from distributing its profit, it will be treated as an NPI, and if it can distribute its profit to its members, it will not be treated as an NPI:
• Mutual societies include organisations such as mutual savings banks, savings and loan associations, mutual insurance companies, and sickness and burial funds. Mutual societies, like cooperatives, are organised by individuals seeking to improve their economic situation through collective activity. They differ from cooperatives, however, in that they are mechanisms for sharing risk, either personal or property, through periodic contributions to a common fund. Normally the depositors in mutual societies formally control their operations. Because mutual societies operate in a commercial sphere, they fall in the financial corporation sector. Only if their Articles of Association prevent them from distributing profits to their owners are they treated as NPIs;
• Self-help groups are similar to both cooperatives and mutual societies in that individuals join to accomplish goals of mutual support that would be unattainable on an individual level. They differ from the above-mentioned in that they are not principally engaged in commercial activities. Therefore, self-help groups are treated as membership organisations and included within the non-profit sector;
• Social ventures are enterprises organised for the purpose of employing, training or otherwise assisting disadvantaged individuals (for example the handicapped, released prisoners, recovering addicts, or other long-term unemployed persons) through the operation of a business. This enterprise is considered an NPI unless it generates and distributes its surplus to the owners;
• Quasi-non-governmental organisations are designed to function at arm's length from government departments, thus avoiding direct political control. To the extent that they are truly self-governing entities, they are appropriately considered part of the non-profit sector, even if they exercise the limited authority delegated to them by government agencies;
• Universities and hospitals, like other institutions, can be NPIs, public institutions or for-profit corporations. Differentiating NPIs from public institutions is especially difficult since both may receive significant amounts of government support, either directly or indirectly, and even public institutions may have a significant degree of autonomy. The key, therefore, is whether the institution is clearly self-governing and not part of the government's administrative system. Educational or health institutions that are NPIs will have their own self-perpetuating boards that can determine all facets of organisational operations, without approval by government officials, and that can cease their operations without the approval of government authorities;
• Indigenous or territorial groups are organised around either cultural or ethnic groupings or a particular geographic area, mainly with the purpose of improving the welfare of their members. The difficulty arises when such groups essentially operate as local governments, often making and enforcing their own laws. When that is the case, the group would not meet the institutionally separate from government criterion and would fall outside the boundaries of the NPI.
Chapter 2: Progress on the development of the non-profit
institutions satellite account for South Africa
This chapter discusses the progress on the development of the non-profit institutions satellite account (NPISA) for South Africa for the financial year 2014/2015. More detailed information about the progress on the development of the NPISA that has taken place in previous years can be found in the discussion document number D0407.2 ‘The statistics of the non-profit sector for South Africa, 2011’ on the Stats SA website www.statssa.gov.za.
2.1: The approval of the South African non-profit institutions classification
The South African non-profit institutions classification (SANPIC) was developed because the level of detail available in the South African Standard Industrial Classification (SIC) was not sufficient to differentiate important types of NPIs. The SANPIC is a classification system used for NPIs, that is, for organisations that are not-for-profit and, by law or custom, do not distribute any surplus they may generate to those who own or control them, are institutionally separate from government, are self-governing, and are non-compulsory.
SANPIC serves as a systematic basis for the classification of data on NPIs, obtained from, inter alia, NPIs that are registered with the Department of Social Development (DSD) as voluntary associations and trusts as well as NPIs that are registered with the Companies and Intellectual Property Commission (CIPC) as non-profit companies (NPCs) according to the Companies Act of 2008. More detailed information about the SANPIC manual can be found in the discussion document number D0407.2 ‘The statistics of the non-profit sector for South Africa, 2011’ on the Stats SA website www.statssa.gov.za.
The process of developing the SANPIC classicifation system was started in the financial year 2010/2011. SANPIC has gone through different stages of approval. It was approved by the following Statistic South Africa (Stats SA) structures and officials:
• NPISA inter-institutional working group;
• Executive Manager of Survey Standards;
• Deputy Director-General (DDG) of Methodology and Standards;
• Standard Approval Committee (SAC);
• Executive Managers' Forum (EMF);
• Executive Committee (Exco); and
• Statistician-General (SG).
The SANPIC manual was approved and certified as an official standard by the SG in the financial year 2014/2015. The SANPIC manual is available on the Stats SA website and it is used as an additional official classification system by Stats SA employees, other government departments as well as private institutions.
2.2: Testing of the administrative data
The Non-profit Organisations (NPO) Directorate within the DSD was established in terms of the NPO Act, 1997 (Act No.71 of 1997) to essentially administer the registration of NPOs in South Africa. The primary purpose of this Act is to encourage and support organisations in a wide range of work they do by:
• Creating an enabling environment for NPIs to flourish; and
• Setting and maintaining adequate standards of governance, accountability and transparency9.
Statistics South Africa 6
To register an NPI is free of charge. It would take about two months to process the entire registration. Immediately upon receipt of the application, an acknowledgement letter is sent to the organisation; thereafter, a registration certificate follows if the application meets the requirements of the NPO Act.
Before an organisation can register with the DSD, they are required to have a written constitution. The constitution should indicate what the organisation does, how it will be structured and how it will be run. It does not cost the organisation anything to register as an NPI at the DSD. The registration is also voluntary.
The DSD has records of all the registered NPIs (NGOs and CBOs), and they are required to submit their latest annual financial statements to the DSD, which must include a balance sheet and income and expenditure reports. The NPIs are also requested to indicate how they raised their funds during a specified period of time.
2.2.1: South African Statistical Quality Assessment Framework
The South African Statistical Quality Assessment Framework (SASQAF) is a framework for assessing the quality of statistics intended for public consumption in South Africa. The main purpose of SASQAF is to provide data quality criteria and clear procedures for the designation of data as official statistics as prescribed by the Statistics Act (Act No. 6 of 1999). SASQAF provides lists of indicators and levels of satisfaction against which to judge the quality of a given dataset. It thus identifies and describes what needs to be done; it does not identify or describe how it should be done. SASQAF can also be utilised by producers of statistics to self-evaluate the quality of their data and it provides quality declarations procedures to guide users of their data. SASQAF as a framework is in line with the United Nations Fundamental Principles of Official Statistics, which means that there is a broad coherence with international best practice10.
2.2.1.1: Structure of the South African Statistical Quality Assessment Framework
SASQAF data assessment certifies statistical information on four levels:
Level 4, quality statistics: These are statistics that meet all quality requirements as set out in SASQAF. They are designated as quality to the extent that deductions can be made from them, and they are ‘fit for use’ for the purpose for which they were designed. Level 4 applies to highly-developed statistical activities with respect to the corresponding indicator11.
Level 3, acceptable statistics: These are statistics that meet most but not all the quality requirements as stipulated in SASQAF. They are designated as acceptable to the extent that, despite their limitations, deductions can be made, and they are ‘fit for use’ for the purpose for which they were designed. Level 3 refers to moderately well-developed activities with reference to a particular indicator12.
Level 2, questionable statistics: These are statistics that meet few of the quality requirements as stipulated in SASQAF. They are designated as questionable to the extent that very limited deductions can be made, and they are therefore not ‘fit for use’ for the purpose for which they were designed. Level 2 refers to activities that are developing but still have many deficiencies13.
Level 1, poor statistics: These are statistics that meet almost none of the quality requirements as stipulated in SASQAF. They are designated as poor statistics to the extent that no deductions can be made from them, and they are not ‘fit for use’ for the purpose for which they were designed. Level 1 refers to activities that are underdeveloped14.
10 Source: Statistics South Africa – South African Statistical Quality Assessment Framework manual
11 Source: Statistics South Africa – South African Statistical Quality Assessment Framework manual
12 Source: Statistics South Africa – South African Statistical Quality Assessment Framework manual
13 Source: Statistics South Africa – South African Statistical Quality Assessment Framework manual
2.2.1.2: Data quality dimensions
There are certain standards that need to be adhered to by institutions or organisations to produce quality statistics. For the statistical information to be certified as official statistics, it must meet the prerequisites of quality.
Prerequisites of quality refers to the institutional and organisational conditions that have an impact on data quality, it defines the minimum set of necessary conditions that have to be met in order to produce good quality statistics; and it therefore serves as the foundation on which all other dimensions of data quality should be premised. In addition, statistical information must be assessed on the following eight dimensions of SASQAF:
• Relevance of the statistical information reflects the degree to which the data meet the real needs of clients. It is concerned with whether the available information sheds light on the issues of most importance to users.
• Accurancy of the statistical information is the degree to which the output correctly describes the phenomena it was designed to measure. Source data available provide an adequate basis to compile statistics.
• Timeliness of the statistical information refers to the delay between the period to which the information pertains and the date on which the information becomes available. Timeliness also addresses aspects of periodicity and punctuality of production activities within the statistical value chain.
• Accessibility of statistical information and metadata refers to the ease with which it can be obtained from the agency. This includes the ease with which the existence of information can be ascertained, as well as the suitability of the form or medium through which the information can be accessed. The cost of the information may also be an aspect of accessibility for some users.
• Interpretability of statistical information refers to the ease with which users understand statistical information through the provision of metadata.
• Comparability of statistical information is the ability to compare statistics on the same characteristics between different points in time, geographical areas or statistical domains. Coherence of statistical information reflects the degree to which it can be successfully brought together with other similar statistical information from different sources within a broad analytic framework and over time. It is the extent to which differences between two sets of statistics are attributable to differences between the estimates and the true value of the statistics.
• Methodological soundness refers to the application of international, national, or peer-agreed standards, guidelines and practices to produce statistical outputs. Application of such standards fosters national and international comparability.
• Integrity of statistical information refers to values and related practices that maintain users’ confindence in the agency producing statistics and ultimately in the statistical product. This includes, among others, the need for the statistical system to be based on the United Nations (UN) principles of official statistics and includes principles of objectivity in collection, compilation and dissemination of data to ensure unbiased statistics which are not subject to confidentiality breaches or premature releases15.
2.2.1.3: Methods of data quality assessment
Stats SA uses three methods to assess the quality of data, namely diagnostic or process evaluation SASQAF assessment, lite SASQAF assessment and full SASQAF assessment.
Process evaluation or diagnostic assessment is the foundation phase of the SASQAF assessment. There are certain minimum sets of conditions that have to be met in order for an institution or organisation to produce quality statistics. The main focus of the diagnostic data assessment is to understand the flow of statistical information from the beginning of the statistical value chain to the end of it. This process is aligned to both SASQAF and the statistical value chain of the statistical products produced. Diagnostic data assessment enables the data assessors to identify any
Statistics South Africa 8
bottlenecks, gaps or limitations associated with the entire statistical value chain. The data assessors will then make the recommendations based on any flaws identified.
SASQAF lite assessment is also the foundation phase of the SASQAF assessment. SASQAF lite comprises four SASQAF quality dimensions, namely accuracy, comparability and coherence, methodological soundness, and integrity. This data assessment gives a glimpse of the state of quality of a particular statistical product in a short period of time as opposed to the full SASQAF assessment. This method of data assessment will enable the agency producing the statistics to identify the measures that need to be put in place in order to address accuracy, comparability and coherence. The agency producing the statistics will then see if the data can be benchmarked or interrogated using alternative data sources. The SASQAF lite assessment also shows that the methodology adopted (or adapted) is scientifically sound. With regard to integrity, the SASQAF lite assessment will identify whether the institutional arrangements may have a significant influence on the effectiveness and credibility of the agency producing the statistics, and on the quality of statistics in general. For example, the statistical information may be manipulated by other stakeholders such as political principals to achieve their own agendas.
Full SASQAF assessment is the process of assessing statistical information on all eight quality dimensions. This process is vigorous and time-consuming as it seeks to ascertain that all the standards outlined in the SASQAF are met. If all the standards outlined in the eight quality dimensions of the SASQAF are met, then the statistical information will be certified as official statistics. If not met, an improvement plan on the areas that do not meet the necessary quality standard will be developed. The agency producing the statistics will then address all the comments made by the data assessors before their statistical information can be certified as official statistics.
2.2.1.4: Data quality assessment of the Department of Social Development administrative data
The data quality assessment of the DSD administrative data source took place in the 2014/2015 financial year. The method that was used to assess the DSD administrative data is the diagnostic assessment as it is the foundation of the data quality assessment.
The diagnostic assessment evaluates whether the data derived from the DSD’s non-profit organisation (NPO) database will be ‘fit-for-use’ as an input for the compilation of the South African NPISA. The process is critical as it contributes towards improving the quality of the data derived from the NPO database. There is a high risk of compromising quality of the data if the NPI registration and reporting prescripts as outlined in the NPO Act and Standard Operational Procedures (SOPs) are not adhered to by staff members of the DSD in the management of the process from the initial phase of registering the NPI to the compliance of the NPI with the reporting obligations.
The diagnostic assessment seeks to establish whether there are:
• deviations in the statistical value chain process;
• gaps and areas that require improvement; and
• bottlenecks as well as limitations associated with the implementation of prescripts.
The process of evaluation covers the entire value chain of the NPO database, which starts from registration of the NPI and ends with the printing of the NPI certificate upon approval. The process of evaluating the DSD administrative data source was done in two phases, namely the interview and the walkthrough phases.
The interview phase was done through semi-structured interviews with DSD officials. The interview process covered 10 officials selected within the entire value chain of the NPI registration process. The walkthrough phase was done through physical observation of the DSD officials doing their daily normal routine work. This phase afforded the data assessment team an opportunity to compare the information gathered during the interview phase with the actual implementation.
The data assessors then made recommendations to the DSD for the improvement of their administrative data. If the DSD need their data to be certified as official statistics they will need to do the full SASQAF assessment, which takes a longer period of time than the SASQAF lite and diagnostic assessment.
2.2.2: Testing of administrative data by the South African Reserve Bank
The South African Reserve Bank (SARB) compiles the full sequence of accounts for the South African economy, representing four institutional sectors, namely financial corporations, non-financial corporations, general government, and households. The household sector comprises households as consumers, unincorporated businesses and non-profit institutions serving households (NPISH). Creating a separate NPISH sector will provide an understanding of the economic contribution of NPIs to the production of goods and services in South Africa, and its value added to the living standards of consumers points to the importance of NPIs within the South African economy.
During the 2013/2014 financial year, the NPISA inter-institutional committee requested the SARB to test the DSD administrative data to compile the NPISH sector. The SARB requested access to view all variables that are captured and not captured by DSD officials. Some of the variables not captured by the DSD officials may form an important part in the compilation of integrated economic accounts (IEA), which is the core data source for the compilation of the NPISA.
2.3: Voluntary activity survey
The International Labour Organization (ILO) defines voluntary work as all persons of working age who, during short reference periods, performed any unpaid, non-compulsory activity to produce goods or provide services for others, where:
• Any activity refers to work for at least one hour;
• Unpaid is interpreted as the absence of remuneration in cash or in kind for work done or hours worked; nevertheless, volunteer workers may receive some small form of support or stipend in cash, when below one third of local market wages (e.g. for out-of-pocket expenses or to cover living expenses incurred for the activity), or in kind (e.g. meals, transportation, symbolic gifts);
• Non-compulsory is interpreted as work carried out without civil, legal or administrative requirement, and that is different from the fulfilment of social responsibilities of a communal, cultural or religious nature; and
• Production for others refers to work performed:
o For organisations that are producing market and non-market units (i.e. organisation-based
volunteering) including self-help, mutual aid or community-based groups of which the volunteer is a member; and
o For households other than the household of the volunteer worker or the households of
related family members (i.e. direct volunteering). The definition of volunteer work excludes the following:
• Community service and work by prisoners ordered by a court or similar authority, and compulsory military or alternative civilian services;
• Unpaid work required as part of education or training programmes (i.e. unpaid trainees); and
• Work for others performed during the working time associated with employment, or during paid time off from an employee job granted by the employer.
An NPI has two types of workers, namely paid and volunteer workers. Many NPIs rely heavily on the work of volunteers. They need these volunteers because, in most cases, even paying minimum wages is prohibitive because their operating budget is low. The organisations often express their thanks to volunteers in terms of a 'gift' monetary payment.
The information of volunteer workers is collected from the Voluntary Activity Survey (VAS). The VAS is a household-based sample survey that collects data on the volunteer activities of individuals aged 15 years and older who live in South Africa. This information is gathered from respondents who are members of households living in dwellings that have been selected to take part in the Quarterly
Statistics South Africa 10
Labour Force survey (QLFS). The VAS covers activities willingly performed for little or no payment to provide assistance or promote a cause in the four weeks preceding the survey interview. These activities can be performed either through an organisation or directly for someone outside one's own household16.
Stats SA conducted the first VAS for the reference year 2010. The second VAS was conducted for the reference year 2014 and the results are scheduled to be published in the financial year 2015/2016.
Chapter 3: Financial and non-financial indicators of non-profit
institutions in South Africa
This section will discuss the financial and non-financial statistics of the non-profit sector in South Africa for the reference year 2012.
Based on the existing data, the following financial and non-financial information for the year 2012 could be compiled:
• Types of NPI by legal entity;
• Cross-classification of institutional sectors (CCIS);
• Total income and its components (membership subscription, donations, grants, government subsidies);
• Total expenditure and its components (compensation of employees, donations, telephone and faxes, utilities); and
• Final consumption expenditure of the NPIs controlled by government.
3.1: Types of non-profit institution by legal entity
In South Africa, the NPIs are divided into three types of legal entity, namely voluntary associations, non-profit companies (NPCs), and non-profit trusts.
Voluntary associations are traditionally informal types of organisations that are rooted in the communities they serve. They are mostly small community-based organisations (CBOs) that do not need to own or manage substantial amounts of money or valuable property and equipment in order to carry out their activities. The income and property of the voluntary association are used to promote its objectives and it will not distribute profits to its members or office-bearers, except as reasonable payment for their work. The members and office-bearers of the voluntary association have no personal right to the property of the voluntary association. This principle applies not only during the lifetime of the organisation but also when it closes down ('dissolution' in legal language). In case of dissolution of the voluntary association, its property will be given to an organisation with similar objectives17.
Non-profit trusts are registered in terms of the Trust Property Control Act, and the Master of the High Court is responsible for the registration of trusts. A non-profit trust exists when the founder of the trust has handed over, or is bound to hand over, to another trustee or trustees control of property (including money) which, or the proceeds of which, is to be administered for the benefit of some person or for some impersonal object or purpose. A non-profit trust is flexible in that it can be used to serve an indefinite variety of purposes. For example, non-profit trusts may be created whereby the trustees are obliged to use the property entrusted to them for a specified, limited purpose and only in certain clearly defined circumstances (for example, for the education of a minor until he or she becomes an adult). However, non-profit trusts may also be created whereby the trustees have a wide discretion to use the trust property for a general purpose (for example, for the provision of health care services to disadvantaged persons)18.
The Companies and Intellectual Property Commission (CIPC) is responsible for the incorporation of non-profit companies (NPCs). An NPC exists in law as a separate entity, distinct from its members or officers or any third party. It is capable of owning assets and liabilities (and its profits and losses). Changes in its membership or in its board of directors do not affect its continuing existence. An NPC does not have share capital, which means that it cannot issue shares or pay dividends to its members; instead it is ’limited by guarantee’, which means that its members undertake to pay a purely nominal amount (usually only a few rand) in the event of the NPC failing or being placed in liquidation.
17 Source: Nyapotsa Attorneys
Statistics South Africa 12
The NPO Act therefore provides a much needed registration facility for all these types of NPIs, thus creating a central depository of all registered NPIs that is accessible to the public. The NPIs were further classified into 11 NPI categories (which are informed by the founding document's mission and objectives of the NPI), according to the South African Non-profit Institutions Classification (SANPIC).
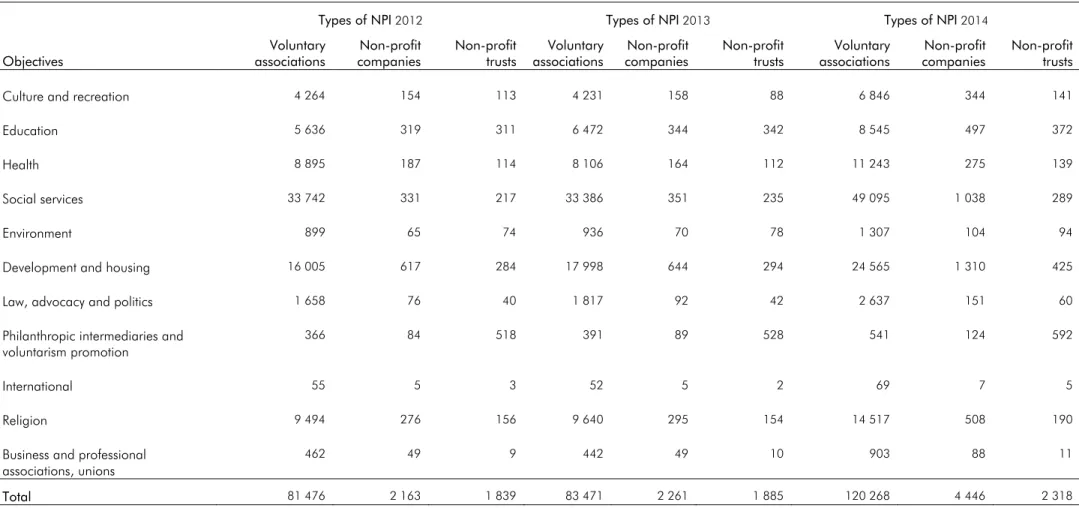
Table 1 shows the types of NPI by legal entity from 2012 to 2014. The NPI can be registered as either voluntary associations, NPCs or non-profit trusts. The number of registered NPIs increased from 85 478 in 2012 to 127 032 in 2014. From 2012 to 2014, the majority of NPIs were registered as voluntary associations, followed by NPCs and non-profit trusts. In 2014 there were 120 268 voluntary associations (by far the majority), 4 446 NPCs and 2 318 non-profit trusts.
Table 1: Types of non-profit institution by legal entity and objectives, 2012, 2013 and 2014 (number)
Objectives
Types of NPI 2012 Types of NPI 2013 Types of NPI 2014
Voluntary
associations companiesNon-profit Non-profit trusts associationsVoluntary companiesNon-profit Non-profit trusts associationsVoluntary companiesNon-profit Non-profit trusts
Culture and recreation 4 264 154 113 4 231 158 88 6 846 344 141
Education 5 636 319 311 6 472 344 342 8 545 497 372
Health 8 895 187 114 8 106 164 112 11 243 275 139
Social services 33 742 331 217 33 386 351 235 49 095 1 038 289
Environment 899 65 74 936 70 78 1 307 104 94
Development and housing 16 005 617 284 17 998 644 294 24 565 1 310 425
Law, advocacy and politics 1 658 76 40 1 817 92 42 2 637 151 60
Philanthropic intermediaries and voluntarism promotion
366 84 518 391 89 528 541 124 592
International 55 5 3 52 5 2 69 7 5
Religion 9 494 276 156 9 640 295 154 14 517 508 190
Business and professional associations, unions
462 49 9 442 49 10 903 88 11
Total 81 476 2 163 1 839 83 471 2 261 1 885 120 268 4 446 2 318
Statistics South Africa 14
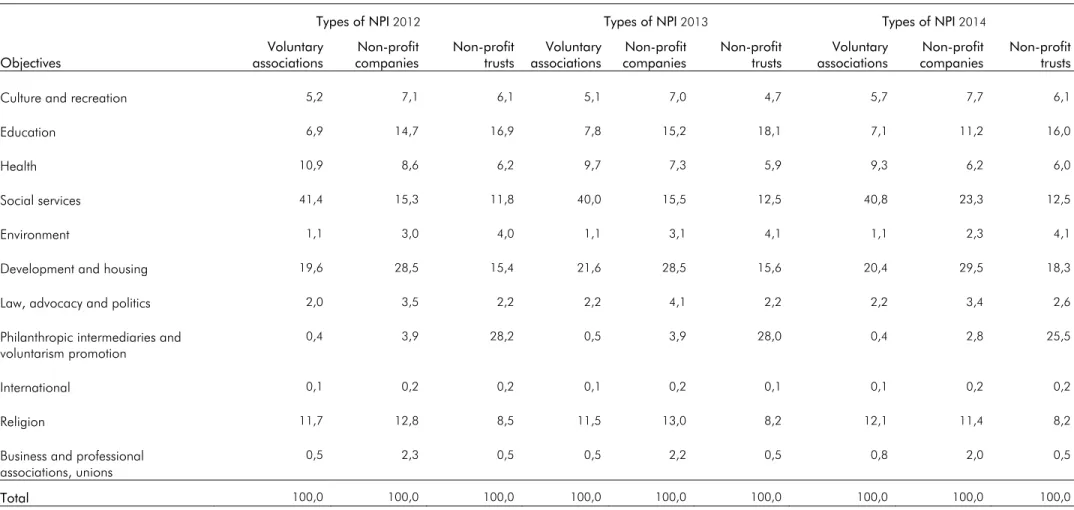
Table 2 shows types of NPI by legal entity and objectives for the reference years 2012, 2013 and 2014. Registered NPIs are grouped by 11 objectives according to SANPIC. During 2012 to 2014, more than 40,0% of the registered voluntary associations NPIs were classified as social services, followed by development and housing (19,6%, 21,6% and 20,4% respectively) and religion (11,7%, 11,5% and 12,1% respectively). This is in contrast to the registered non-profit trusts NPIs where the majority of NPIs were classified as philanthropic intermediaries and voluntarism (28,2%, 28,0% and 25,5% respectively), followed by education (16,9%, 18,1% and 16,0% respectively), development and housing (15,4%, 15,6% and 18,3% respectively) and social services (11,8%, 12,5% and 12,5% respectively).
Table 2: Types of non-profit institution by legal entity and objectives, 2012, 2013 and 2014 (%)
Objectives
Types of NPI 2012 Types of NPI 2013 Types of NPI 2014
Voluntary
associations companiesNon-profit Non-profit trusts associationsVoluntary companiesNon-profit Non-profit trusts associationsVoluntary companiesNon-profit Non-profit trusts
Culture and recreation 5,2 7,1 6,1 5,1 7,0 4,7 5,7 7,7 6,1
Education 6,9 14,7 16,9 7,8 15,2 18,1 7,1 11,2 16,0
Health 10,9 8,6 6,2 9,7 7,3 5,9 9,3 6,2 6,0
Social services 41,4 15,3 11,8 40,0 15,5 12,5 40,8 23,3 12,5
Environment 1,1 3,0 4,0 1,1 3,1 4,1 1,1 2,3 4,1
Development and housing 19,6 28,5 15,4 21,6 28,5 15,6 20,4 29,5 18,3
Law, advocacy and politics 2,0 3,5 2,2 2,2 4,1 2,2 2,2 3,4 2,6
Philanthropic intermediaries and voluntarism promotion
0,4 3,9 28,2 0,5 3,9 28,0 0,4 2,8 25,5
International 0,1 0,2 0,2 0,1 0,2 0,1 0,1 0,2 0,2
Religion 11,7 12,8 8,5 11,5 13,0 8,2 12,1 11,4 8,2
Business and professional associations, unions
0,5 2,3 0,5 0,5 2,2 0,5 0,8 2,0 0,5
Total 100,0 100,0 100,0 100,0 100,0 100,0 100,0 100,0 100,0
Statistics South Africa 16
3.2: Cross-classification of institutional sectors
Institutional units are aggregated into institutional sectors. Institutional sectors are classified on the basis of their principal functions, behaviour and objectives. Institutional sectors comprise the following:
• Financial corporations;
• Non-financial corporations;
• General government;
• Households; and
• Non-profit institutions serving households (NPISHs).
The financial corporation sector consists of all resident corporations engaged in financial intermediation or in auxiliary financial activities which are closely related to financial intermediation. The non-financial corporation sector includes corporations principally engaged in the production of market goods and non-financial services.
The general government sector consists mainly of government units financed and controlled by government, e.g. the different levels of government. The household sector includes unincorporated business enterprises owned and controlled by households, whether market producers or producing for own final use, i.e. sole proprietors and partnerships. The NPISH includes legal social entities that provide goods and services to their members or to households without price or at prices that are not economically significant, e.g. aid organisations and religious societies19.
The production and generation of income accounts can be developed either by estimating their underlying variables according to a classification of economic activity or by a classification according to type of ownership (institutional sector).
Table 3: Cross-classification of production account items by institutional sector, 2012 (R million)
Production account corporations Financial Non-financial corporations government General Households NPISH
Output 451 711 4 252 781 803 703 915 469 37 422
Intermediate consumption 188 804 2 671 775 279 570 365 645 15 649 Gross value added 262 907 1 581 006 524 133 549 824 21 773 Compensation of employees 126 413 771 128 442 209 115 889 18 213
Other taxes on production 3 961 28 354 5 196 17 525 -
Other subsidies 936 6 353 1 255 414 -
Gross operating surplus 133 469 787 877 77 263 416 824 3 560
Source: Statistics South Africa – Supply and use tables, 2012
The production accounts emphasise the concept of value added or gross domestic product (GDP) as one of the main balancing items in the SNA. The SNA recommends the calculation of GDP for the entire economy and the calculation of value added for various industries or institutional sectors. GDP is essentially a production measure as it is obtained through the sum of the gross value added (GVA) of all resident institutional units, in their capacities as producers, plus the values of any taxes, less subsidies, on production or imports not already included in the values of the outputs and value added by producers. Table 3 shows the cross-classification of production account items by institutional sector for the year 2012. The non-financial corporation institutional sector was the largest contributor to the total economy, while NPISH was the smallest contributor.
3.3: Income of South African non-profit institutions
Voluntary work is the most significant contributor to NPIs in South Africa, while many in-kind goods and personal resources are donated to NPIs. The value of free time donated to NPIs may be more than the size of cash donations from households, and represents a very significant component of NPI income. NPIs are expressions of voluntary actions, and in addition involve a substantial percentage of volunteer contributions. The majority of the income of South African NPIs is derived from three core sources:
• Government subsidies;
• Local donations; and
• Membership subscriptions.
Government subsidies are the largest provider of transfer income to NPIs in the form of either donations or sponsorships, which may be in cash or in kind. The extent to which the in-kind transfers are captured in the NPISA donations figure will depend upon the accounting practices of the individual NPI.
Local donations are the second largest provider of income for NPIs. A number of central and provincial governments make grants to NPIs directly. However, other government transfers such as subsidies and a number of health contracts could be classified as either grants or contract sales. Local government also makes a number of grants to NPIs, funded from both their own sources and from central government.
Membership subscriptions are also a major contributor to the transfer of income to NPIs in South Africa. Households make monetary donations in a variety of settings – from street appeals to collection plates at churches and bequests. In addition, their participation in institutions may include a contribution via a subscription or membership fee, both of which are considered transfers because the actual service that members may receive from the NPI is unlikely to bear a strong relationship to the amount paid.
Statistics South Africa 18
Figure 1 shows the total income of South African NPIs for the years 2010 to 2012. In 2010 and 2012, government subsidies was the highest source of income (39,8% and 39,2% respectively) and this was followed by local donations (19,5% and 28,5% respectively). In 2011 local donations were the highest source of income (30,9%), followed by government subsidies (28,9%) and membership subscriptions (24,6%). From 2010 to 2012, the smallest contributors to the total income of South African NPIs were service income (3,5%, 8,8% and 12,0% respectively) and income sales (5,5%, 6,8% and 2,7% respectively).
Figure 1: Income of South African non-profit institutions, 2010, 2011 and 2012
Source: Department of Social Development
0,0 5,0 10,0 15,0 20,0 25,0 30,0 35,0 40,0 45,0
Government subsidies Service income Local donations Membership
subscriptions
Income sales Fund raising %
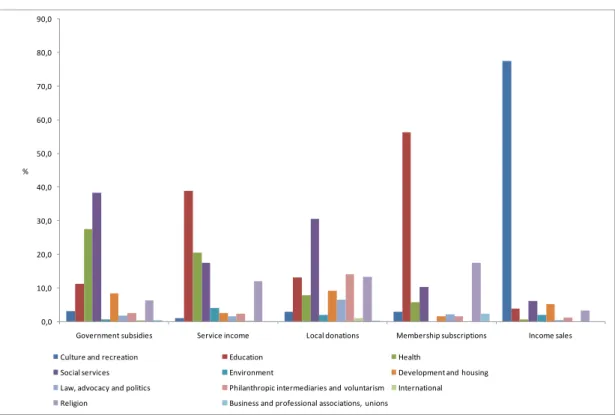
Figure 2 shows the category of income by types of NPI in 2012. The majority of income in the form of government subsidies was received by social services NPIs (38,3%), followed by health NPIs (27,4%) and education NPIs (11,1%). The largest portion of income in the form of local donations was received by social services NPIs (30,5%), followed by philanthropic intermediaries and voluntarism NPIs (14,0%), religion NPIs (13,2%) and education NPIs (13,1%). The majority of income in the form of membership subscriptions was received by education NPIs (56,3%), followed by religion NPIs (17,4%) and social services NPIs (10,2%).
Figure 2: Category of income by types of non-profit institution, 2012
Source: Department of Social Development, 2014
0,0 10,0 20,0 30,0 40,0 50,0 60,0 70,0 80,0 90,0
Government subsidies Service income Local donations Membership subscriptions Income sales %
Culture and recreation Education Health
Social services Environment Development and housing Law, advocacy and politics Philanthropic intermediaries and voluntarism International Religion Business and professional associations, unions
Statistics South Africa 20
3.4: Expenditure of South African non-profit institutions
Most NPIs have to rely on government grants and donations from fundraising because NPIs usually serve sections of the community that could not afford to pay the full cost of the service. NPIs do not usually choose their target groups according to who can pay for the service, but according to who needs the service most.
NPIs and general government often provide goods and services to households for their individual consumption free of charge or at reduced prices. Examples are health services provided by government or reimbursed by a social security fund, education services, the part of service provided by public museums, concert halls that are not financed by entrance fees, aid for social housing, etc. The actual final consumption expenditure of households is the sum of general government and individual consumption expenditure of households.
Figure 3 shows the expenditure incurred by South African NPIs for the years 2010 to 2012. From 2010 to 2012 the highest expenditure incurred by South African NPIs was compensation of employees. In 2012, the highest expenditure incurred by South Afircan NPIs was the compensation of employees (73,6%), followed by maintenance and repairs (19,0%) and telephone and faxes (6,7%).
Figure 3: Expenditure of South African non-profit institutions, 2010, 2011 and 2012
Source: Department of Social Development, 2014
0,0 10,0 20,0 30,0 40,0 50,0 60,0 70,0 80,0 90,0 100,0 Compensation of employees
Stationery Sundry Maintenance and
repairs
Transport Telephone and faxes Utilities %
Figure 4 shows the category of expenditure by types of NPI in 2012. In the category ‘compensation of employees’, 28,0% of expenditure came from social services NPIs, followed by education NPIs (25,3%), health NPIs (15,7%) and religion NPIs (11,2%). In the category ‘transport’, 47,2% of expenditure came from social services NPIs, followed by health NPIs (15,3%) and education NPIs (14,0%). In the category ‘utilities’, 55,9% of expenditure came from social services NPIs, followed by education NPIs (16,7%), religion NPIs (8,3%) and health NPIs (8,0%).
Figure 4: Category of expenditure by types of non-profit institution, 2012
Source: Department of Social Development, 2014
0,0 10,0 20,0 30,0 40,0 50,0 60,0 70,0 80,0 90,0 100,0 Compensation of employees
Stationery Maintenance and repairs Transport Telephone and faxes Utilities %
Culture and recreation Education Health
Social services Environment Development and housing Law, advocacy and politics Philanthropic intermediaries and voluntarism International Religion Business and professional associations, unions
Statistics South Africa 22
3.5: Final consumption expenditure of non-profit institutions controlled
by government
The general government sector in South Africa comprises national, provincial and local governments, including national and provincial extra-budgetary accounts and funds, higher education institutions and the non-trading services of municipalities. This section will focus on the national and provincial extra-budgetary accounts and funds20. The economic classification of final
consumption expenditure is a measure of the nature and economic effect of government operations on the economy of the country. Six main economically classified cash payments for operating activities categories are identified. These are purchases of goods and services; interest; subsidies; grants; social benefits; and other payments21. Extra-budgetary accounts keep their accounts on an
accrual basis, i.e. the payments are recorded in the period to which the transactions relate, and surpluses, deficits, assets and liabilities resulting from these transactions are carried over to the next fiscal year.
Figure 5 shows the breakdown of final consumption expenditure of NPIs controlled by government in 2010, 201122 and 2012. In 2011 and 2012, social protection (27,1% and 29,7% respectively)
accounted for the largest share of the total final consumption expenditure of NPIs controlled by government, followed by economic affairs (20,7% and 19,1% respectively) and general public services (19,8% and 19,1% respectively). This is in contrast with 2010 where economic affairs (37,5%) accounted for the largest share of the total final consumption expenditure of NPIs controlled by government, followed by social protection (25,1%) and general public services (13,5%).
Figure 5: Final consumption expenditure of South African non-profit institutions controlled by government, 2010, 2011 and 2012
Source: Statistics South Africa – Financial statistics of extra-budgetary accounts and funds
20 The extra-budgetary accounts are non-profit institutions controlled by government.
21 Source: Statistics South Africa – Financial statistics of extra-budgetary accounts and funds, 2012/2013
22 Please note that the 2011 figures were revised.
0,0 5,0 10,0 15,0 20,0 25,0 30,0 35,0 40,0 General public services
Defence Public order and
safety
Economic affairs Environmental
protection
Housing and
community
amenities
Health Recreation, culture
and religion
Education Social protection
%
Purchases of goods and services include the total value of goods and services purchased by the NPI government sector for use in a production process or acquired for resale. Interest includes interest payments mainly to residents. Subsidies include cash payments to non-financial public corporations, financial public corporations, non-financial private enterprises and financial private enterprises. Grants are capital or current cash payments to foreign governments and international organisations. Social benefits include cash payments for social security benefits, social assistance benefits and employer social benefits. Other payments include property expenses other than interest (mainly rent), and miscellaneous other current and capital cash payments (non-profit institutions serving households, surrender of donor funds to foreign donors, injuries and damages, households, non-life insurance premiums, purchases of goods and services for distribution to households, exchange rate losses, and capital payments to public corporations and private enterprises)23.
Figure 6 shows the category of final consumption expenditure by types of NPI controlled by government in 2012. In the category ‘compensation of employees’, 35,3% of expenditure came from general public services, followed by economic affairs (20,5%) and social protection (14,5%) NPIs. In the category ‘subsidies’, 54,0% of expenditure came from recreation, culture and religion, followed by defence (43,7%) and economic affairs (2,3%) NPIs. In the category ‘purchases of goods and services’, 28,7% of expenditure came from economic affairs, followed by general public services (22,1%), social protection (11,6%) and health (10,4%) NPIs.
Figure 6: Category of final consumption expenditure by types of non-profit institution controlled by government, 2012
Source: Statistics South Africa – Financial statistics of extra-budgetary accounts and funds, 2012/2013
23 Source: Statistics South Africa – Financial statistics of extra-budgetary accounts and funds, 2012/2013
0,0 10,0 20,0 30,0 40,0 50,0 60,0 70,0 80,0 90,0 100,0 Compensation of employees Purchases of goods and services
Interest Subsidies Grants Social benefits Other payments %
General public services Defence Public order and safety Economic affairs Environmental protection Housing and community amenities Health Recreation, culture and religion Education Social protection
Statistics South Africa 24
Chapter 4: Conclusion
The development of the NPISA for South Africa will be very useful because it will provide a means by which the economic aspects of NPIs can be drawn out and analysed separately within the structure of the main accounts. One major feature of an NPISA is to set it within the context of the whole economy, so that an NPI's contribution to major national accounting aggregates can be determined. The NPISA will also reveal the contribution of volunteer work to total employment and economic growth.
SANPIC is based on the ICNPO classification system for NPIs. The main advantage of the SANPIC is that it details certain 'catch all' categories or 'other service activities' categories in the SIC in ways that capture more precisely the activities of NPIs. SANPIC is classified according to economic objectives that allow organisations involved in similar economic activities or serving a similar purpose to be grouped together. This provides a basis for meaningful international comparative analysis.
NPIs make a significant contribution to the economic and social well-being of South Africans. NPIs include cultural and sports clubs, social services NPIs, schools, hospitals and clinics, churches, environmental NPIs, trade unions, political parties, non-governmental organisations (NGOs), fund-raising organisations, charitable trusts, etc.
The data from the DSD database will play a pivotal role in the development of the NPISA for South Africa. The DSD administrative data is the identified data source that can be used to compile the core tables of the NPISA. The main purpose of the DSD administrative data is to create an environment within which the public may have access to information concerning registered NPIs; and to promote a spirit of co-operation and shared responsibility within government, donors and amongst other interested persons in their dealings with NPIs. For this reason, the administrative data must go through the SASQAF assessment to ensure the quality of the data before they can be used as the main data source for the compilation of the NPISA for South Africa.
In 2014 a large number of South African NPIs were registered as voluntary associations, with more than 40,0% of these organisations classified as social services NPIs. The South African NPIs derived most of their income from government subsidies, local donations and membership subscriptions. While transfers from households remain the area of the core segment, they obtain significant income from membership subscriptions. Government provides income to NPIs through grants (which are classified as subsidies). Income in the social services and education NPIs grew faster than income in the other NPI groups. South African NPIs spent most of their income on the compensation of employees.
Stats SA values your feedback on this discussion document. If you have any comments and/or suggestions, please contact Membrey Mogapi at MembreyM@statssa.gov.za by 29 May 2015.
Glossary
Compensation of employees Compensation of employees is defined as the total remuneration, in cash or in kind, payable by an employer to an employee in return for work done by the latter during the accounting period. It is recorded on a gross basis, i.e. before any deduction for income taxes, pensions, unemployment insurance and other social insurance schemes. It also includes other forms of compensation, namely commissions, tips, bonuses, directors' fees and allowances such as those for holidays and sick leave, as well as military pay and allowances. It excludes employers' social contributions.
Employees Employees are the people employed by the business/organisation who received pay (in salaries, wages, commission, piece rates or payments in kind) for any part of the reference period (excluding independent contractors).
Employment Employment refers to the number of persons employed in the labour force framework. It includes persons at work, even if only for one hour during the reference period, and also persons temporarily absent from work.
Gross domestic product GDP is a measure of the total value of production of all resident institutional units in the economic territory of a country in a specific period.
Full-time equivalent FTE employment is the number of full-time equivalent jobs, defined as total hours worked divided by average annual hours worked in full-time jobs.
Household Group of people who live together and provide themselves jointly with food and/or other essentials for living, or a single person who lives alone.
Institutional unit An institutional unit is an economic entity that is capable, in its own right, of owning assets, incurring liabilities and engaging in economic activities and in transactions with other entities.
Non-profit institution An NPI is a trust, company or other association of persons established for a public purpose and the income and the property of which are not distributable to its members or office-bearers except as reasonable compensation for services rendered. Non-profit institutions engaged in
market production NPIs which charge fees determined by their costs of production and which are sufficiently high to have a significant influence on the demand for their services. Any surpluses that such institutions make must be retained within those institutions as their status as NPIs prevents them from distributing them to others.