Fachgebiet: Bioinformatik
Prof. Dr. H.
-
P. Piepho
Evaluation of alternative statistical methods
for genomic selection for quantitative traits
in hybrid maize
Dissertation
zur Erlangung des Grades eines Doktors
der Agrarwissenschaften
vorgelegt
der Fakultät Agrarwissenschaften
von
Master of Science
Torben Schulz-Streeck
aus Kiel
Die vorliegende Arbeit wurde am 24.07.2012 von der Fakultät Agrarwissenschaften der Universität Hohenheim als "Dissertation zur Erlangung des Grades eines Doktors der Agrarwissenschaften" angenommen.
Tag der mündlichen Prüfung: 27.09.2012
1. Prodekan: Prof. Dr. A. Fangmeier
Berichterstatter, 1. Prüfer: Prof. Dr. H.-P. Piepho Mitberichterstatter, 2. Prüfer: Prof. Dr. A. E. Melchinger
Table of contents
1. General introduction ... 1
1.1. Genomic selection for breeding value estimation ... 3
1.2. Statistical methods for genomic selection ... 4
1.3. Mixed models for genomic selection ... 7
1.4. Extensions and refinements of genomic selection methods ... 9
1.5. Aims and objectives ... 10
2. Genome-wide selection by mixed model ridge regression and extensions based on geostatistical models1 ... 17
3. Pre-selection of markers for genomic selection2 ... 18
4. Comparisons of single-stage and two-stage approaches to genomic selection3 ... 19
5. Genomic selection allowing for marker-by-environment interaction4 ... 20
6. Genomic selection using multiple populations5 ... 21
7. General discussion ... 22
7.1. Analyses preceding the marker-based prediction stage of GS ... 22
7.2. Statistical methods for marker-based prediction in GS ... 25
7.2.1. Ridge Regression Best Linear Unbiased Prediction (RR-BLUP) ... 25
7.2.2. Extensions of the RR-BLUP model ... 27
7.2.3. Machine learning and regularized regression methods ... 29
7.3. Approaches for reliably evaluating and comparing methods for GS ... 30
7.4. Conclusions ... 32 8. Summary ... 38 9. Zusammenfassung ... 41 10. Appendix ... 45 Acknowledgments Curriculum vitae List of publications
List of conference contributions
1
Schulz-Streeck T, Piepho HP (2010) BMC Proceedings 4 (Suppl 1):S8
2
Schulz-Streeck T, Ogutu JO, Piepho HP ( 2011) BMC Proceedings 5(Suppl 3):S12
3
Schulz-Streeck T, Ogutu JO, Piepho HP (2013) Theor Appl Genet 126(1):69-82
4
Schulz-Streeck T, Ogutu JO, Gordillo A, Karaman Z, Knaak C, Piepho HP (2013) Submitted to Plant Breeding
5
Abbreviations
AIC Akaike information criterion AICC corrected AIC
BLUP best linear unbiased predictions BVN bivariate-normal
cAIC conditional AIC CV cross-validation
GCV generalized cross-validation
GEBV genomic estimated breeding values GEI genotype-by-environment interaction GS genomic selection
LD linkage disequilibrium
LS-SVM least squares support vector machine MAS marker-assisted selection
MEI marker-by-environment interaction MME mixed model equations
QTL quantitative trait locus/loci
RCBD randomized complete block design REML restricted maximum likelihood RMSE root mean squared error
RR ridge regression RR-BLUP ridge regression BLUP
SNP single nucleotide polymorphism TBV true breeding values
VTGUL validation set for tested genotypes in untested locations VUGTL validation set for untested genotypes in tested locations VUGUL validation set for untested genotypes in untested locations
1.
General introduction
Maize (Zea mays L.) is one of the most important crop species with an annual production of about 844,358,253 tonnes (FAO, 2011). It is therefore of great economic interest to develop and deploy new techniques that can enhance the efficiency and cost-effectiveness of maize breeding programs. One such technique, genomic selection (GS), also known as genome-wide selection, is a relatively new approach that involves using genome-wide molecular marker information to improve plant and animal breeding. Recent and continuing advances in molecular marker technology have greatly reduced the cost of molecular marker information for plant and animal breeders alike and thereby enabled widespread use of genomic selection in breeding programs. The maize breeding sector was one of the first plant breeding sectors to implement genomic selection in industrial breeding programs. The importance of maize makes the improvement and implementation of GS in maize breeding programs of significant economic interest and importance worldwide.
Genomic selection was first proposed by Meuwissen et al. (2001) to improve the efficiency and cost-effectiveness of plant and animal breeding programs. In contrast to the traditional marker-assisted selection (MAS) methods, where only selected subsets of markers are used, GS uses all the available marker information to predict breeding values. The aim of GS is to predict breeding values instead of detecting single quantitative trait loci (QTL). Thus, no significant tests to identify markers linked to QTL with large effects on a trait are used (Meuwissen et al., 2001). Traditional marker-assisted selection methods are best suited for traits controlled by a few QTL with large effects (Lande and Thompson, 1990; Holland, 2004; Xu and Crouch, 2008; Bernado, 2008), and perform poorly when used to estimate effects of QTL with small effect sizes (Lande and Thompson, 1990; Xu and Crouch, 2008; Bernado, 2008). However, quantitative traits are mainly controlled by many QTL with small effects (Kearsey and Farquhar, 1998; Bernardo, 2002). To accurately predict a quantitative trait it is crucial to use all the QTL affecting the trait in a marker-assisted selection exercise and not only the particular subset of markers which are in high linkage disequilibrium with QTL having large effects (Meuwissen et al., 2001). GS therefore achieves high accuracy by simultaneously estimating the effects of all the available markers without first prescreening the markers using significance tests to identify the most important and relevant markers. To ensure that at least one marker is in high linkage with a QTL the
markers must cover the entire genome. Recent advances in single nucleotide polymorphism (SNP) marker genotyping technologies ensure this requirement (Syvänen, 2005; Li et al., 2008). Currently, thousands of SNP markers are available for most livestock species while for maize it is common to use 50,000 SNP markers. The cost of genotyping of these markers is currently reasonably low and will almost certainly continue to decline further as the genotyping technology platforms become increasingly more efficient.
Several studies have demonstrated the importance of GS in maize breeding (Lorenzana and Bernardo, 2009; Piepho, 2009; Crossa et al., 2010; Albrecht et al., 2011; Heslot et al., 2012; Riedelsheimer et al., 2012). GS has also been shown to improve the gain per unit time over traditional marker-assisted selection methods (Heffner et al., 2010). Moreover, GS is advantageous over the classic approach of using only the pedigree information (Crossa et al., 2010; Albrecht et al., 2011). These studies and others have proposed various statistical methods for GS. However, interest in increasing the predictive accuracy and applicability of the methods used for GS argues for the need to develop novel approaches or extensions of existing approaches to enhance their accuracy in GS. In this thesis a few commonly used methods are extended and new approaches are proposed to improve the accuracy of GS in particular in maize breeding.
1.1.
Genomic selection for breeding value estimation
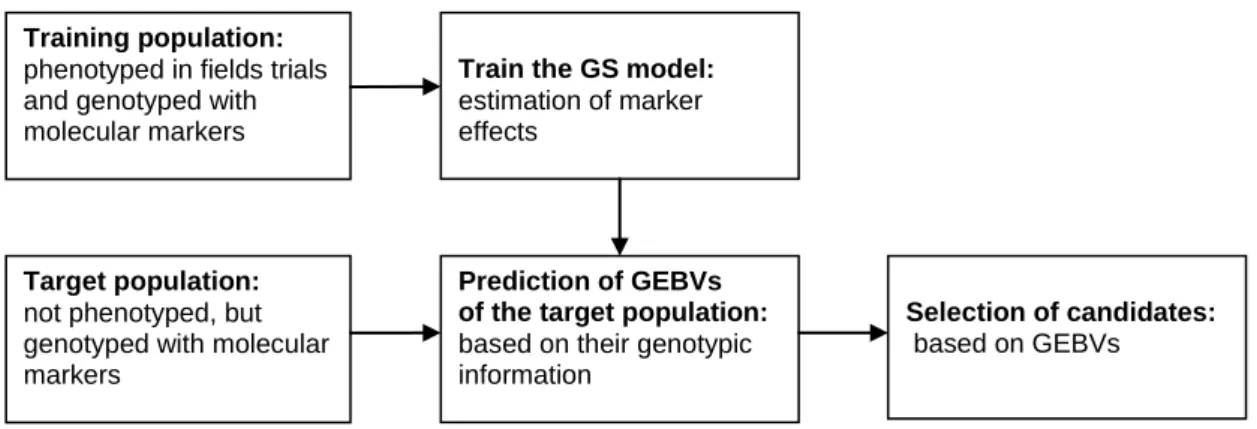
Genomic selection is based on using regression models relating phenotypic data to molecular marker information to predict expected genomic breeding values. The statistical models are fitted to a training population consisting of individuals with both phenotypic and genotypic data to estimate the effects of all the markers. The estimated marker effects can then be used to predict genotypic values for target populations with individuals that have been genotyped with the same markers as the training population but which are lacking phenotypic information (Figure 1). The methods commonly assume additive marker effects. Therefore predicted values for the untested genotypes are computed as the sum of all the additive marker effects, called genomic estimated breeding values (GEBV). These GEBVs are then used to guide selection decisions. The GS approach therefore both expedites and increases the cost-effectiveness of the plant breeding program because not all genotypes have to be tested in field trials (Bernado and Yu, 2007; Mayor and Bernado, 2009; Heffner et al., 2010; Jannink et al., 2010). Thus, the gain per unit time is increased (Heffner et al., 2009; 2010).
Figure 1: A schematic diagram illustrating genomic selection, starting from the training and target populations through prediction of genomic estimated breeding values (GEBV) to select candidates. It is important to note that while only a single instance of model training is depicted here, training can be performed continually as new phenotype and marker data become available (modified from Heffner et al., 2009).
The phenotypic data used for GS in plant breeding experiments are normally adjusted means derived from a statistical model fitted to the raw plot data in a step called phenotypic analysis. The whole process of obtaining GEBVs consists of at least two stages, namely the phenotypic analysis and the genomic analysis stages. The splitting of GS into two or more steps proceeds in the same spirit of stage-wise approaches used in
Training population:
phenotyped in fields trials and genotyped with molecular markers
Prediction of GEBVs
of the target population: based on their genotypic information
Selection of candidates: based on GEBVs
Train the GS model:
estimation of marker effects
Target population:
not phenotyped, but genotyped with molecular markers
analysis of a series of plant breeding experiments (Smith et al., 2001; Möhring and Piepho, 2009; Welham et al., 2010; Piepho et al., 2011). For a series of plant breeding experiments, a single-stage analysis is regarded as the gold standard because it can fully account for the entire variance-covariance structure of the observed data (Smith et al., 2001). Therefore, if the whole GS analysis is split into different steps, the different steps should collectively be able to approximately recover a single-stage analysis (Piepho, 2009).
1.2.
Statistical methods for genomic selection
Using high density markers presents a general problem for GS, because the number of markers (p) can far exceed the number of observations (n), thus precluding the use of the standard multiple linear regression methods without first performing variable selection to appropriately reduce the number of markers. Many different methods have been proposed to overcome this limitation and used for GS to simultaneously estimate all the marker effects without having to first do significant tests to select a subset of markers. The proposed approaches include, but are not restricted to mixed models (Meuwissen et al., 2001; Piepho, 2009), Bayesian procedures (Meuwissen et al., 2001; Habier et al., 2011), machine learning methods (Long et al., 2007; Ogutu et al., 2011) and regularized regression methods (Heslot et al., 2012; Ogutu et al., 2012).
Meuwissen et al. (2001) were the first to propose a mixed model for GS, where the marker effects or chromosomal segments are taken as random effects, so that the best linear unbiased predictions (BLUP) of the marker effects can be generated. The model assumes that the marker effects are independent random draws from a common normal distribution. All the marker effects are drawn from the same distribution. Therefore each marker has the same variance and all estimated marker effects are shrunken equally towards zero. The marker variance can be estimated as a function of the total genetic variance and used as fixed variance in the GS analysis (Meuwissen et al., 2001; Bernardo and Yu, 2007; Habier et al., 2007). Alternatively, the restrictive assumption of a common fixed marker variance can be lifted by directly estimating the marker variance by restricted maximum likelihood (REML) in the GS analysis (Piepho, 2009). This method is commonly known as ridge regression BLUP (RR-BLUP).
A variety of Bayesian approaches have also been proposed to overcome the restrictive assumption of a homogenous marker variance, because it can lead to an underestimation of QTL with large effects (Meuwissen et al., 2001). In a first approach, called BayesA, each marker effect is drawn from its own normal distribution, allowing the variances to differ among the markers. The prior distribution of variances of the markers is a scaled, inverted chi-square distribution. Thus each marker effect is shrunken toward zero differently. In a second Bayesian approach, called BayesB, the possibility that some markers can have zero variances is explicitly accounted for (Meuwissen et al., 2001). BayesB uses a prior distribution for the marker variance that assumes that the marker variance is zero with a known probability () but non-zero otherwise. Similar to BayesA each no-zero marker effect is drawn from its own normal distribution. Several refinements have been undertaken to address problems related to the impact of prior distributions assumed for BayesA and BayesB on genomic predictions, including BayesC. In BayesC, the prior probability () that a marker has a zero effect is treated as an unknown to be estimated. For all the other markers with a
1
probability of having a non-zero effect, a single variance is assumed, similarly to RR-BLUP, instead of a marker-specific variance, as assumed for BayesA and BayesB (Habier et al., 2011).Despite the different assumptions made by the different Bayesian methods, the predictive accuracies for quantitative traits are often similar to each other (Habier et al. 2011) and to RR-BLUP based on real datasets for animal and plant breeding populations (e.g. Hayes et al., 2009a; VanRaden et al., 2009; Verbyla et al., 2009; Crossa et al., 2010; Heslot et al., 2012). The difference in performance between BayesB and RR-BLUP on real datasets is actually much lower than has been suggested by some simulation studies (Hayes et al., 2009a; VanRaden et al., 2009). Moreover, no method has emerged as clearly the best based on a wide variety of tested traits and species (e.g. Heslot et al., 2012). However, at least in theory, the different methods are best suited to predict different types of traits. Thus, using a method that shrinks the marker effects equally can lead to an underestimation of large effect QTL (Meuwissen et al., 2001; Xu, 2003; Verbyla et al., 2009), whereas BayesA and BayesB can better fit data with a few QTL each with large effects (Hayes et al., 2009b; Verbyla et al., 2009). This can be advantageous when estimating some traits, such as the fat percentage of milk in dairy cattle, which is controlled primarily by a polymorphism in the DGAT1 gene (Grisart et
al., 2002). Models allowing for individual marker variances, such as BayesA, can fit such large effects better than models assuming a homogenous marker variance, such as BLUP methods (Hayes et al., 2009b; Verbyla et al., 2009). However, for traits controlled by many genes with small effects, differences between Bayes and BLUP methods are typically negligible (e.g. Hayes et al., 2009b; Verbyla et al., 2009).
The most relevant traits in maize breeding are mostly complex quantitative traits. Thus, it is assumed that an infinitesimal genetic model, which assumes a large number of QTL with small effects, would be reasonable for most relevant traits in maize breeding (Schön et al., 2004; Riedelsheimer et al., 2012). The assumption underling RR-BLUP is thus consistent with the infinitesimal genetic model. Thus, the prediction accuracy of RR-BLUP can be relatively high for quantitative traits from maize breeding populations (Lorenzana and Bernardo, 2009; Albrecht et al., 2011; Heslot et al., 2012; Zhao et al., 2012). Moreover, it is feasible to extend RR-BLUP to allow for heterogeneous marker variances (Meuwissen, 2009: Piepho, 2009) and to exclude markers with estimated zero variances in the spirit of BayesB (Piepho, 2009).
The regularized regression methods can be used even if the number of predictors far exceeds the number of observations, through the use of appropriate penalty functions. The regularized regression methods are intimately related to RR-BLUP (Ruppert et al., 2003). RR-BLUP is a mixed model which can be viewed as a ridge regression model, in which the penalty term is estimated by the quotient of the residual and the marker variance components (Ruppert et al., 2003; Piepho, 2009). The penalty term can be chosen by different data-driven methods, for example by cross-validation (Ruppert et al., 2003). The close connection between regularized regression and mixed models implies that both types of methods may be expected to have similar predictive accuracies for GS. This was recently demonstrated by simulation and empirical studies for several regularized regression methods, including the elastic net, LASSO and ridge regression models (Heslot et al., 2012; Ogutu et al., 2012).
Other machine learning methods with demonstrated high performances in many application domains have also recently been tried for GS, including random forest, boosting, support vector machines and artificial neural networks (González-Recio and Forni, 2011; Ogutu et al., 2011; Heslot et al., 2012). These methods efficiently handle the problem of far more markers than the number of observations and are not only
restricted to regression problems involving quantitative traits alone but can also be used for classification problems (Drucker et al., 1997; Bühlmann and Hothorn, 2007; Hastie et al., 2009). Random forest is potentially attractive for GS because it can accommodate complex interactions between markers, nonlinear effects of markers and makes no distributional assumptions about the predictor variables (Breiman, 2001). Nonetheless, evidence available so far suggests similar performance of these machine learning methods and RR-BLUP (Ougtu et al., 2011; Heslot et al., 2012).
Overall, predictive accuracies of statistical methods tested for GS are broadly comparable, even though particular types of methods may be preferable for specific traits. Mixed models possess the appealing property that they can readily be extended by adding more fixed and random effect terms to account for extra sources of variation, such as design and genotype-environment interaction effects, and to accommodate heterogeneous variance components (Piepho, 2009). Therefore, mixed models are of special interest for GS, because they are flexible and competitive with other methods. Consequently, mixed models form the central focus of this thesis.
1.3.
Mixed models for genomic selection
The following mixed model for adjusted means of genotypes is commonly used for GS (Piepho, 2009):
e Zu
y1n , (1)
where y is an n-vector of adjusted means per genotype, 1 is an n n-vector of ones, is a common intercept, Z is an np covariate matrix of p markers for n genotypes, where biallelic markers with alleles A1 andA2 are commonly coded as 1 forA1A1, as -1
for A2A2and coded as 0 forA1A2, A2A1 and missing values, u is a vector of random
marker effects with
2
, 0 ~N Ip u
u ,
where the variance-covariance matrix of u is the product of the p-dimensional identity
matrix (Ip), and the variance of marker effects (
2
u
). The residual error associated withy, e is assumed to follow
2
, 0 ~ N In e
e
where In is an n-dimensional identity matrix and e2 is the residual variance. Estimates of marker effects can be obtained by
Z Z D
Z yu~ ~T~ˆ2 1~T , where Z
1n Z
~
, D
0Ip
with denoting the direct sum (Searle et al., 1992),2 2 2 ˆ ˆ ˆ u e , and u~T
,uT
.This expression is commonly known as the “ridge regression” formulation of BLUP (Ruppert et al., 2003), and is called ridge regression BLUP (RR-BLUP).
Model (1) can be re-written to estimate genotypic instead of marker effects by specifying the variance-covariance of the genotypes in terms of the marker information (Piepho, 2009), which is a useful strategy if the number of markers exceeds the number of genotypes (VanRaden, 2008; Piepho et al., 2012).
e g
y1n , (2)
where gZu, var(g)Gu2 and
T
ZZ
, ZTdenotes the transpose of Z and e is defined as in (1). BLUPs of u can be obtained, if is positive-definite, and hence invertible as (Henderson, 1977)
g Z
uˆ T1ˆ.
In the case is not positive-definite random effects of u can be predicted by
ˆ ˆ 1 ˆ ˆ 2 1 n T uZ V y u ,because the estimated variance-covariance matrix of y (Vˆ ) is generally positive-definite even when is not.
In model (2) the covariance between two genotypes is modelled as a function of the distance between their marker profiles, similarly to the idea of modelling the covariances between pairs of observations made at different spatial locations as functions of their separation distances in geostatistics (Schabenberger and Gotway, 2005). The spatial distances are replaced here by genetic distances, calculated as multidimensional Euclidean distances between the markers for all possible pairs of genotypes (Piepho, 2009).
f(dii')
where dii' is the Euclidean distance between genotypes i and i', defined as ||
|| '
' i i
ii z z
d , with zi equal to the i-th row of Z, and f(d) is some monotonically decreasing function of d. It has been shown that the RR-BLUP model is equivalent to a quadratic spatial model, where f(d) has a quadratic function (Piepho, 2009). There are many other different options available for the f(d) function (Schabenberger and
Gotway, 2005; Piepho, 2009; Ober et al., 2011). A different but equivalent formulation of this geostatistical model for GS in terms of simple and universal kriging was recently proposed by Ober et al. (2011). These geostatistical models are closely related to the reproducing kernel Hilbert spaces regression model, a regularized regression model that uses kernel functions, such as the Gaussian kernel, to compute the distances between marker profiles for pairs of genotypes for the function f(d) and that can therefore
allow for possibly nonlinear marker effects on quantitative traits (Gianola and van Kaam, 2008).
1.4.
Extensions and refinements of genomic selection methods
The basic models for GS can be extended or refined in several different ways. For the mixed models, the residual variance can be fixed through an independent estimate made at the phenotypic analysis stage when adjusted means are calculated. Fixing the residual variance can avoid overfitting, because it prevents the markers from capturing the non-genetic error variance (Piepho, 2009). Moreover, polynon-genetic effects can be included in mixed models to account for genetic variance not captured by the markers. This is commonly done in animal breeding studies using a random genotype effect, where the variance-covariance structure depends on the pedigree information (e.g. Calus and
Veerkamp, 2007). It is also possible to use independent random genotype effects, even if pedigree information is unavailable (Piepho, 2009).
Accurate prediction of GEBVs requires numerous markers; if many markers actually have zero effects and the effects are estimated by BLUP as non-zero, then their cumulative effect adds noise to the estimated marker effects (Goddard and Hayes, 2007). As a consequence predictive accuracy can be enhanced by excluding subsets of markers with no effects that otherwise would compromise the accuracy of prediction of genomic breeding values (Hayes et al. 2009a; Macciotta et al., 2009). Alternatively, some methods automatically select the most significant and pertinent markers, e.g. BayesB, lasso-type models, componentwise and twin boosting algorithms (Meuwissen et al., 2001; Bühlmann and Hothorn, 2007, 2010; Ougtu et al., 2012).
In general, the prediction of GEBVs is influenced by both the phenotypic analysis preceding the marker-based analysis plus non-marker information included in the marker-based methods. Clearly, genomic selection is not necessarily restricted to marker-based prediction but rather is a general approach for accurately predicting GEBVs based on the raw phenotypic data, marker information and non-marker effects using various statistical models applied in several stages.
1.5.
Aims and objectives
The overall goal of this study was to develop and comparatively evaluate different approaches for accurately predicting genomic breeding values in GS, with GS viewed as a general approach, incorporating all the different stages from phenotypic analysis of the raw data to the marker-based prediction of the breeding values. In particular, the specific objectives were the following.
(1) Develop different approaches for using information from analyses preceding the marker-based prediction of breeding values for GS. Normally, adjusted means obtained from an analysis of the raw phenotypic data are used for GS leading to a stage-wise analysis. From the phenotypic analysis stage an estimate of the error variance can be obtained and used as a fixed residual variance component in the subsequent stage of GS (Chapter 2). Since the adjusted means are often correlated, in particular when trial designs are unbalanced, it may be crucial to preserve and carry forward the information contained in the variance-covariance matrix from the phenotypic analysis stage to the
marker-based prediction stage of GS (Chapter 4). Furthermore, excluding markers with no effects, or with inconsistent effects among crosses, environments or generations can increase predictive accuracy (Chapters 3 and 5). The predictive accuracy of GS may still be further improved by conducting residual diagnostics at the phenotypic analysis stage of field trials to identify and eliminate outlying observations (Chapter 6).
(2) Extend and/or suggest efficient implementations of statistical methods used at the marker-based prediction stage of GS, with a special focus on improving the predictive accuracy of GS in maize breeding. The basic RR-BLUP methods were modified in several different ways in an attempt to enhance their predictive accuracies and/or accommodate non-marker effects. To this end different strategies for modeling polygenic effects were explored and tested (Chapter 2). The models were also modified to accommodate the main marker effects only, as well as the main plus specific marker effects for a variety of environments (Chapters 5). This was achieved by testing if it is necessary to account for marker effects in phenotypic analysis across different environments or if the marker information can be omitted until the very last stage of the stage-wise analysis (Chapter 5). Moreover, GS using multiple populations was compared to analysing each population separately and to an analysis, where both the main and populations-specific marker effects are simultaneously estimated (Chapter 6). Also considered was a modification of the RR-BLUP model allowing different subsets of markers to have different variances (Chapter 3). Beside these modifications of the RR-BLUP method, different spatial models and machine learning methods, including regularized regression methods, namely component-wise boosting, ridge regression, LASSO and the elastic net were also used for GS and their performances compared with those of RR-BLUP (Chapters 2, 3, 4 and 6).
(3) Compare different approaches to reliably evaluate and compare methods for GS. Several cross-validation (CV) schemes were proposed and used to evaluate and compare the different GS approaches (Chapters 3 to 6). One of the proposed schemes attempted to satisfy the fundamental assumption underlying the proper use of CV, namely that the training and validation sets are independent (Chapter 4). Because CV can sometimes be computationally too demanding to implement for certain large problems, several different alternative model selection criteria are proposed and evaluated (Chapter 2 and 5).
References
Albrecht, T., V.Wimmer, H.J. Auinger, M. Erbe, C. Knaak, M. Ouzunova, H. Simianer, and C.C. Schön. 2011. Genome-based prediction of testcross values in maize. Theor. Appl. Genet. 123:339–350.
Bernardo, R. 2002. Breeding for quantitative traits in plants. Stemma Press, Woodbury, MN.
Bernardo, R., and J. Yu. 2007. Prospects for genomewide selection for quantitative traits in maize. Crop Sci. 47:1082–1090.
Bernardo, R. 2008. Molecular markers and selection for complex traits in plants: learning from the last 20 years. Crop Sci. 48:1649–64.
Bühlmann, P., and T. Hothorn. 2007. Boosting algorithms: regularization, prediction and model fitting. Statist. Sci. 22: 477-505.
Bühlmann, P. and T. Hothorn. 2010. Twin Boosting: Improved feature selection and prediction. Statistics and Computing 20(2):119–138.
Breiman, L. 2001. Random forests. Machine Learning 45:5-32.
Calus, M.P.L., and R.F. Veerkamp. 2007. Accuracy of breeding values when using and ignoring the polygenic effect in genomic breeding value estimation with a marker density of one SNP per cM. J. Anim. Breed. Genet. 124:362–368.
Crossa, J., G. de los Campos, P. Pérez, D. Gianola, G. Atlin, J. Burgueño, J.L. Araus, D. Makumbi, J. Yan, V. Arief, M. Banziger, and H.J. Braun. 2010. Prediction of genetic values of quantitative traits in plant breeding using pedigree and molecular markers. Genetics 186: 713–724.
Drucker, H., C.J.C. Burges, L. Kaufman, A. Smola, and V. Vapnik. 1997. Support vector regression machines. Advances in Neural Information Processing Systems 9:155–161.
FAOSTAT. 2011. Available at http://faostat.fao.org/?PageID=567#ancor (verified 26 Feb. 2011).
Gianola, D., and J.B.C.H.M. van Kaam. 2008. Reproducing kernel Hilbert spaces regression methods for genomic assisted prediction of quantitative traits. Genetics 178:2305-2313.
Goddard, M.E., and B.J. Hayes. 2007. Genomic selection. J. Anim. Breed. Genet. 124:323-330.
González-Recio, O., and S. Forni. 2011. Genome-wide prediction of discrete traits using Bayesian regressions and machine learning. Genet. Sel. Evol. 43:7.
Grisart, B., W. Coppieters, F. Farnir, L. Karim, C. Ford, N. Cambisano, M. Mni, S. Reid, R. Spelman, M. Georges, and R. Snell. 2002. Positional candidate cloning of a QTL in dairy cattle: identification of a missense mutation in the bovine DGAT1 gene with major effect on milk yield and composition. Genome Res. 12:222–231. Habier, D., R.L. Fernando, and J.C.M. Dekkers. 2007. The impact of genetic
relationship information on genome-assisted breeding values. Genetics 177:2389-2397.
Habier, D., R.L. Fernando, K. Kizilkaya, and D.J. Garrick. 2011. Extension of the Bayesian alphabet for genomic selection. BMC Bioinformatics 12:186.
Hastie, T.J., R. Tibshirani, and J. Friedman. 2009. The elements of statistical learning. Springer, New York, USA.
Hayes, B.J., P.J. Bowman, A.J. Chamberlain, and M.E. Goddard. 2009a. Invited review: Genomic selection in dairy cattle: Progress and challenges. J. Dairy. Sci. 92: 433-443.
Hayes, B., P. Bowman, A. Chamberlain, K. Verbyla, and M.E. Goddard. 2009b. Accuracy of genomic breeding values in multi-breed dairy cattle populations. Genet. Sel. Evol. 41:51.
Heffner, E.L., A.J. Lorenz, J.L. Jannink, and M.E. Sorrells. 2010. Plant breeding with genomic selection: potential gain per unit time and cost. Crop Sci. 50:1681–1690. Heffner, E.L., M.E. Sorrells, and J.L. Jannink. 2009. Genomic selection for crop
improvement. Crop Sci. 49: 1–12.
Henderson, C.R. 1977. Best linear unbiased prediction of breeding values not in the model for records. J. Dairy Sci. 60:783-787.
Heslot, N., H.P. Yang, M.E. Sorrels, and J.L. Jannink. 2012. Genomic selection in plant breeding: a comparison of models. Crop Sci. 52:146-160.
Holland, J.B. 2004. Implementation of molecular markers for quantitative traits in breeding programs: Challenges and opportunities. p. 26. In T. Fischer et al. (ed.) New Directions for a Diverse Planet: Proc. for the 4th Int. Crop Science Congress, Brisbane, Australia. 26 Sept.–1 Oct. 2004. Regional Institute, Gosford, Australia. Jannink, J.L., A.J. Lorenz, and H. Iwata. 2010. Genomic selection in plant breeding:
from theory to practice. Brief Funct Genomic Proteomic 9: 166–177.
Kearsey, M., and A. Farquhar. 1998. QTL analysis in plants: Where are we now? Heredity 80:137–142.
Lande, R., and R. Thompson. 1990. Efficiency of marker-assisted selection in the improvement of quantitative traits. Genetics 124:743–56.
Li, C., M. Li, J.R. Long, Q. Cai, and W. Zheng. 2008. Evaluating cost efficiency of SNP chips in genome-wide association studies. Genet. Epidemiol. 32:387–395.
Long, N., D. Gianola, G.J.M. Rosa, K.A. Weigel, and S. Avendan Machine learning classification procedure for selecting SNPs in genomic selection: application to early mortality in broilers. J. Anim. Breed. Genet. 124:377–89.
Lorenzana, R., and R. Bernardo. 2009. Accuracy of genotypic value predictions for marker-based selection in biparental plant populations. Theor. Appl. Genet. 120:151–161.
Macciotta, N.P.P., G. Gaspa, R. Steri, C. Pieramati, P. Carnier, and C. Dimauro. 2009. Preselection of most significant SNPS for the estimation of genomic breeding values. BMC Proc. 3 (Suppl 1):S14.
Mayor, P.J., and R. Bernardo. 2009. Genome-wide selection and marker-assisted recurrent selection in double haploid versus F2 population. Crop Sci. 49: 1719– 1725.
Meuwissen, T.H.E., B.J. Hayes, and M.E. Goddard. 2001. Prediction of total genetic value using genome-wide dense marker maps. Genetics 157:1819-1829.
Meuwissen, T.H.E. 2009. Accuracy of breeding values of ‘unrelated’ individuals predicted by dense SNP genotyping. Genet. Sel. Evol. 41:35.
Möhring, J., and H.P. Piepho. 2009. Comparison of weighting in two-stage analyses of series of experiments. Crop Sci. 49:1977-1988.
Ober, U., M. Erbe, N. Long, E. Porcu, M. Schlather, and H. Simianer. 2011. Predicting genetic values: a kernel-based best linear unbiased prediction with genomic data. Genetics 188:695-708.
Ogutu, J.O., H.P. Piepho, and T. Schulz-Streeck. 2011. A comparison of random forests, boosting and support vector machines for genomic selection using SNP markers. BMC Proc. 5 (Suppl 3):S11.
Ogutu, J.O., T. Schulz-Streeck, and H.P. Piepho. 2012. Genomic selection using regularized linear regression models: ridge regression, lasso, elastic net and their extensions (accepted).
Piepho, H.P. 2009. Ridge regression and extensions for genome-wide selection in maize. Crop Sci. 49:1165-1176.
Piepho, H.P., J.O. Ogutu, T. Schulz-Streeck, B. Estaghvirou, A. Gordillo, and F. Technow. 2012. Efficient computation of ridge-regression BLUP in genomic selection in plant breeding. Crop Sci. doi: 10.2135/cropsci2011.11.0592.
Piepho, H.P., T. Schulz-Streeck, and J.O. Ogutu. 2011. A stage-wise approach for analysis of multi-environment trials. Biuletyn Oceny Odmian 33:7-20.
Riedelsheimer, C., A. Czedik-Eysenberg, C. Grieder, J. Lisec, F. Technow, R. Sulpice, T. Altmann, M. Stitt, L. Willmitzer, and A.E. Melchinger. 2012. Genomic and metabolic prediction of complex heterotic traits in hybrid maize. Nat. Genet. doi:10.1038/ng.1033.
Ruppert, D., M.P. Wand, and R.J. Carroll. 2003. Semiparametric regression. Cambridge Univ. Press. Cambridge, UK.
Schabenberger, O., and C.A. Gotway. 2005. Statistical methods for spatial data analysis. CRC Press Boca Raton, FL.
Schön, C.C., H.F. Utz, S. Groh, B. Truberg, S. Openshaw, and A.E. Melchinger. 2004. Quantitative trait locus mapping based on resampling in a vast maize testcross experiment and its relevance to quantitative genetics for complex traits. Genetics 167:485–498.
Searle, S.R., G. Casella, and C.E. McCulloch. 1992. Variance components. Wiley, New York.
Smith, A., B. Cullis, and R. Thompson. 2001. Analyzing variety by environment data using multiplicative mixed models and adjustments for spatial field trend. Biometrics 57:1138-1147.
Syvänen, A.C. 2005. Toward genome-wide SNP genotyping. Nat. Genet. 37:S5–S10. VanRaden, P.M. 2008. Efficient methods to compute genomic predictions. J. Dairy Sci.
91:4414-4423.
Verbyla, K.L., B.J. Hayes, P.J. Bowman, and M.E. Goddard. 2009. Accuracy of genomic selection using stochastic search variable selection in Australian Holstein Friesian dairy cattle. Genetics Research 91(05):307-311.
Welham, S., B.J. Gogel, A.B. Smith, R. Thompson, and B.R. Cullis. 2010. A comparison of analysis methods for late-stage evaluation trials, Australian and New Zealand Journal of Statistics 52:125-149.
Xu, S. 2003. Estimating polygenic effects using markers of the entire genome. Genetics 163:789–801.
Xu, Y., and J.H. Crouch. 2008. Marker-assisted selection in plant breeding: from publications to practice. Crop Sci. 48: 391–407.
Zhao, Y., M. Gowda, W. Liu, T. Würschum, H.P. Maurer, F.H. Longin, N. Ranc, and J.C. Reif. 2011. Accuracy of genomic selection in European maize elite breeding Populations. Theor. Appl. Genet. 124:769–776.
2.
Genome-wide selection by mixed model ridge regression
and extensions based on geostatistical models
Torben Schulz-Streeck, Hans-Peter Piepho
Bioinformatics Unit, Institute for Crop Production and Grassland Research, Universität Hohenheim, Fruwirthstrasse 23, 70599 Stuttgart, Germany
BMC Proceedings 4 (Suppl 1):S8
The original publication is available at http://www.biomedcentral.com/bmcproc/
Abstract
Genome-wide selection (GS) involves estimating breeding values using molecular markers spanning the entire genome. The success of GS approaches will depend crucially on the availability of efficient and easy-to-use computational tools. Therefore, approaches that can be implemented using mixed models hold particular promise and deserve detailed study. A particular class of mixed models suitable for GS is given by geostatistical mixed models, when genetic distance is treated analogously to spatial distance in geostatistics.
We consider various geostatistical mixed models for use in GS. The analyses presented for the QTL-MAS 2009 dataset pay particular attention to the modelling of residual errors as well as of polygenetic effects.
It is shown that geostatistical models are viable alternatives to ridge regression best linear unbiased prediction, one of the common approaches to GS. Correlations between genome-wide estimated breeding values and true breeding values were between 0.879 and 0.889. In the example considered, we did not find a large effect of the residual error variance modelling, largely because error variances were very small. A variance components model reflecting the pedigree of the crosses did not provide an improved fit. Therefore geostatistical models deserve further study as a tool to GS that is easily implemented in a mixed model package.
3.
Pre-selection of markers for genomic selection
Torben Schulz-Streeck, Joseph O Ogutu, Hans-Peter Piepho
Bioinformatics Unit, Institute of Crop Science, University of Hohenheim, Fruwirthstrasse 23, 70599 Stuttgart, Germany
BMC Proceedings 2011, 5(Suppl 3):S12.
The original publication is available at http://www.biomedcentral.com/bmcproc/
Abstract
Accurate prediction of genomic breeding values (GEBVs) requires numerous markers. However, predictive accuracy can be enhanced by excluding markers with no effects or with inconsistent effects among crosses that can adversely affect the prediction of GEBVs.
Therefore we present three different approaches for pre-selecting markers prior to predicting GEBVs and assess the extent to which pre-selection of markers improves prediction accuracy. Four different best linear unbiased prediction (BLUP) methods, including ridge regression and three geostatistical models were used and the performances of the models were evaluated using 5-fold cross-validation.
Ridge regression BLUP and the geostatistical models gave almost similar fits. Pre-selecting markers was beneficial. Thus excluding markers with inconsistent effects among crosses increased the correlation between GEBVs and true breeding values of the non-phenotyped individuals from 0.607 (using all markers) to 0.625 (using pre-selected markers). Moreover, extension of the ridge regression model to allow for heterogeneous variances between the n (n =5, 10, 50, 100, 250) most significant markers and the remaining markers only marginally increased the accuracy of prediction (from 0.625 to 0.648) for the simulated dataset for the QTL-MAS 2010 workshop.
4.
Comparisons of single-stage and two-stage approaches to
genomic selection
Torben Schulz-Streeck, Joseph O Ogutu, Hans-Peter Piepho
Bioinformatics Unit, Institute of Crop Science, University of Hohenheim, Fruwirthstrasse 23, 70599 Stuttgart, Germany
Theoretical and Applied Genetics 126(1):69-82.
The original publication is available at http://link.springer.com/journal/122
Abstract
Genomic selection (GS) is a method for predicting breeding values for plants or animals using many molecular markers that is commonly implemented in two stages. In plant breeding the first stage usually involves computation of adjusted means for genotypes which are then used to predict genomic breeding values (GEBVs) in the second stage. Classical stage-wise approaches to GS suffer from either approximating, or ignoring correlations among the adjusted means by assuming that the means are independent. We comparatively evaluated the performance of a new stage-wise method for GS, which uses rotation to ensure the means are approximately independent, and that is fully efficient relative to a single-stage approach given known variance components. Specifically, we compared two classical stage-wise approaches, which either ignore or approximate correlations among the means by a diagonal matrix, and the new method to a single-stage analysis for GS. We further evaluated the predictive performance of the new method when implemented by ridge regression best linear unbiased prediction (RR-BLUP) and componentwise linear least squares boosting using 5-fold cross-validation. The new stage-wise approach with rotated means was more similar to the single-stage analysis than the classical two-stage approaches based on non-rotated means for two unbalanced datasets. This suggests that rotation is a worthwhile pre-processing step in GS for the two-stage approaches for unbalanced datasets. Moreover, the predictive accuracy of stage-wise RR-BLUP was higher (5.0 to 6.1%) than that of boosting.
5.
Genomic selection allowing for marker-by-environment
interaction
Torben Schulz-Streeck1,2, Joseph O Ogutu1, Andrés Gordillo3,4, Zivan Karaman5, Carsten Knaak2,Hans-Peter Piepho1
1
Bioinformatics Unit, Institute of Crop Science, University of Hohenheim, Fruwirthstrasse 23, 70599 Stuttgart, Germany
2
KWS SAAT AG, Grimsehlstraße 31, 37555 Einbeck, Germany
3
AgReliant Genetics, LLC, 4640 East State Road 32, Lebanon, Indiana 46052, USA
4
KWS LOCHOW GMBH, Ferdinand-von-Lochow-Strasse 5, 29303 Bergen, Germany
5
Limagrain Europe, CS 3911, 63720 Chappes, France
Manuscript has been submitted to Plant Breeding
Abstract
Genomic selection (GS) is a method used to predict the effects of molecular markers. The predicted marker effects are then summed to derive genomic breeding values for genotypes. GS has been routinely implemented in plant breeding in two stages. The first stage usually omits the marker information and estimates adjusted means of genotypes across environments. The second stage then uses the adjusted means to predict genomic breeding values. However, if the effects of markers vary substantially between different environments, it may important to account for this variation in genomic prediction for varieties adapted to different environments. Using two maize datasets, we investigated if modelling the marker-by-environment interaction can improve the predictive ability of GS relative to modelling genotype-by-environment interaction alone. Modelling the marker-by-environment interaction only slightly increased the predictive ability of GS relative to modelling only the genotype-by-environment interaction based on two different datasets. Moreover, predictive ability did not reduce substantially even when the number of markers with consistent effects across environments used for genomic prediction was reduced to about 50. Overall, accounting for environment-specific marker effects had a relatively minor influence on predictive ability for the tested datasets. Thus, GS carried out in a stagewise fashion, as is currently commonly done in plant breeding such that the marker information is omitted until the very last stage of the process, may suffice for most practical purposes.
6.
Genomic selection using multiple populations
T. Schulz-Streeck1,2, J. O. Ogutu1, Z. Karaman3, C. Knaak2, and H. P. Piepho1 1
Bioinformatics Unit, Institute of Crop Science, University of Hohenheim, Fruwirthstrasse 23, 70599 Stuttgart, Germany
2
KWS SAAT AG, Grimsehlstraße 31, 37555 Einbeck, Germany
3
Limagrain Europe, CS 3911, 63720 Chappes, France
Crop Science 52:2453–2461
The original publication is available at https://www.crops.org/publications/cs
Abstract
Genomic selection (GS) is a marker-based method for predicting genomic breeding values that involves simultaneous estimation of the effects of many markers or chromosomal segments. Using different populations in GS studies raises the possibility that the marker effects may vary substantially across populations. Models for analysing datasets consisting of multiple populations need to include population-specific marker effects to account for such inter-population variation. However, common models for GS only account for the main marker effects, assuming that they are consistent across populations. Here, we present an approach in which the main plus population-specific marker effects are simultaneously estimated in a single mixed model. The predictive ability of the model were evaluated using 5-fold cross-validation and compared to that of ridge regression best linear unbiased prediction (RR-BLUP) method, involving only either the main marker effects or the population-specific marker effects. We used a maize breeding dataset with 312 testcross genotypes derived from five different biparental populations which were genotyped with a 50k SNP chip. A combined analysis incorporating all the populations was better than separate analyses for each population. Modelling the main plus the population-specific marker effects simultaneously only slightly improved predictive ability compared to modelling only the main marker effects, especially when the number of markers was reduced. The performance of the RR-BLUP method was comparable to that of two popular regularization methods, namely the ridge regression and the elastic net and was more accurate than that of the LASSO. Overall, combining information from related populations improved predictive ability, but further allowing for population-specific marker effects made minor improvement.
7.
General discussion
This chapter discusses the key results of this thesis research and anchors them within the broad context of the current literature on genomic selection (GS). The chapter is organized around the following three major thematic areas. First the analyses preceding the marker-based prediction stage of genomic selection are discussed. This is followed by the statistical methods for marker-based prediction in GS and the discussion of the approaches for reliably evaluating and comparing methods for GS. The chapter ends with a summary of the key findings from this research.
Genomic selection is a method that uses molecular markers to predict genomic breeding values. Different methods have been proposed and implemented in an effort to get accurate predictions for GS. This thesis focuses on the use of mixed models, a popular class of models for GS, in particular ridge regression best linear unbiased prediction (RR-BLUP) and its various extensions. Comparative evaluations of the performances of RR-BLUP and its variants for GS using quantitative traits in maize breeding revealed only minor differences in accuracy. Regularized regression and machine learning methods, moreover, did not substantially improve predictive accuracy of GS relative to RR-BLUP or of its different variants. It is demonstrated, furthermore, that the accuracy of genomic prediction using molecular markers is influenced at different stages of the prediction process. This emphasizes the fact that, besides optimizing the marker-based prediction, the decisions made in the analyses preceding the marker-based prediction stage can significantly affect the quality of genomic predictions.
7.1.
Analyses preceding the marker-based prediction stage of GS
The quality and reliability of phenotypic data are important to the accuracy of GS and should be enhanced as much as practicable using efficient field trial designs and phenotypic data analyses (Chapter 6). Recommended field trial designs should strive to test genotypes using replicated genotypes distributed over several representative locations and years (Kempton and Fox, 1997). Phenotypic analyses should attempt to identify and exclude potential outlying observations from datasets, as is routinely done in plant breeding studies (Fox et al., 1997). The analysed empirical datasets were based on augmented designs where the genotypes of interest were not replicated within a location and the dataset contained observations from one year only. Due to the lack of
replicate observations on genotypes within locations, using the genotypes as fixed effects makes residual diagnostics for outlier detection impossible. However, the use of marker information makes additional diagnostic methods for the phenotypic data available for unreplicated field trials (Chapter 6). Alternative ways of improving the quality of phenotypic data include using designs with replicated genotypes, such as the -design, or designs where certain proportions of the genotypes are replicated within each location (Piepho, 2006; Smith et al., 2006; Cullis et al., 2006; Williams et al., 2011) or testing in more locations.
The phenotypic analysis can be used to obtain an independent estimate of the residual error variance, which can be used as a fixed variance component at the GS stage to minimize overfitting (Piepho, 2009). If this is done, the markers do not capture the non-genetic portion of the error variance. Adopting such a strategy did not, however, evidently improve predictive accuracy for a simulated dataset prepared for the QTLMAS Workshop 2009 (Chapter 2). This may partly reflect the specific design used in the simulation, which did not include replicated genotypes. Hence only the within-genotype error variance could be estimated and not the between-within-genotype error variance. For most real plant breeding datasets, replicates are available, so that the non-genetic between-genotype error variance can be estimated and separated from the genetic effects. Another strategy to get an independent estimate for the error variance in GS is to combine the phenotypic and marker-based prediction stages into one analysis (Chapter 4). The error variance can then be estimated simultaneously with the variances of the other random effects in the model as part of the full variance-covariance structure of the observed data. The single-stage strategy produces an independent estimate of the error variance and avoids the need to fix the error variance at the GS stage but is computationally inefficient. A novel and computationally more efficient approach is to split the analysis into several stages, while minimizing the loss of information relative to a single-stage analysis (Chapter 4; Piepho et al., 2011). As expected, this produces results that are slightly more similar to those for the single-stage analysis than results for several other stage-wise methods that use less efficient weighting schemes to transfer the information contained in the variance-covariance matrix of the adjusted means between stages (Chapter 4).
High-quality genotypic data, besides high-quality phenotypic data, will also enhance predictive accuracy of GS. There are several strategies for improving the quality of
genotypic data. Firstly, genotypes and markers with missing marker information and markers with too low minor allele frequencies can be identified and excluded from the dataset (e.g. Hayes et al., 2009a). Secondly, markers and genotypes with too many heterozygous loci can also be identified and deleted when using double haploid genotypes which are expected to be completely homozygous in maize breeding experiments. Thirdly, subsets of the most important markers that are most likely to be in high linkage disequilibrium (LD) with QTL and hence to affect the target quantitative trait can be pre-selected and used in GS. Pre-selection of markers can improve predictive accuracy (Hayes et al., 2009a), especially if the selected subset of markers have consistent effects across different populations (Chapter 3) but not necessarily in all circumstances (Weigel et al., 2009; Zhao et al., 2012). Indeed, even when a subset of markers with consistent effects across environments is selected, this may not always guarantee improved predictive ability, in particular when accuracy is assessed separately for individual locations using empirical maize datasets (Chapter 5). Therefore, it is always useful to carefully weight whether pre-selection of markers is warranted because it may not only improve the prediction accuracy, but may even reduce it (Zhao et al., 2012). These studies thus provide evidence that improvements in accuracy due to pre-selection of markers may vary with the dataset and analytical methods used, besides the particulars of the trait of interest. An important and practical limitation of pre-selection of markers is that there is no accepted objective threshold for deciding when to stop marker selection, nor is deciding the desirable threshold straightforward. A further limitation of strategies that set the effects of some markers to zero is the existence of a long-range LD for commercial maize breeding populations (Albrecht et al., 2011; Ching et al., 2002; Riedelsheimer et al., 2012). The existence of a long-range LD makes almost all markers to be in LD with at least one QTL and many markers to be coupled with the same QTL. Thus, it is most likely that each marker has an effect on the trait as discussed by Iwata and Jannink (2011). Due to the long-range LD even randomly selecting a small subset of markers for GS with maize datasets does not necessarily reduce prediction accuracy compared to using many markers (Chapter 6; Zhao et al., 2012). Therefore, for most practical applications in maize breeding, a small number of markers, often less than 1000, may suffice for GS, especially if biparental populations are used (Chapter 4; 5; 6; Lorenzana and Bernardo, 2009; Zhao et al., 2012).
Yet, another important consideration at this stage of GS is to carefully select an appropriate model for the variance-covariance matrix of the markers. Geostatistical models that are now widely used in plant breeding to analyze spatial trends in field trials offer a convenient and flexible means of doing this. Schabenberger and Gotway (2005) present several examples of theoretical semivariograms used in geostatistical models. These models carry over directly to GS and can be used to summarize the information contained in the empirical marker variance-covariance matrix as a function of genomic distances between pairs of genotypes (Chapter 2; 3; Piepho, 2009). Several theoretical models were first fitted to empirical semivariograms and graphical inspection used to select the model with the greatest strength of support in the data (Chapter 3). However, no model was selected as being clearly the best for the tested dataset using the semivariograms and hence all models produced similar marker-based prediction (Chapter 3).
7.2.
Statistical methods for marker-based prediction in GS
7.2.1. Ridge Regression Best Linear Unbiased Prediction (RR-BLUP)
The basic RR-BLUP model yields the mixed model equations (MME) for the random marker effects and thus directly provides predictions for the random marker effects. However, if the number of markers is very large, solving the MME can become computationally too demanding or even impossible. Therefore, the basic RR-BLUP model can be rewritten in terms of random genotype effects and the genomic relationship matrix calculated from the markers (e.g. VanRaden, 2008; Hayes et al., 2009b; Piepho, 2009; Piepho et al., 2012). For the basic RR-BLUP method only a single variance component has to be estimated besides the residual error. Fast restricted maximum-likelihood (REML) algorithms for fitting the mixed models which replace complex matrix computations in REML estimation of variance components with arithmetic operations on scalars instead of matrices are now readily available (Kang et al., 2008; Endelman, 2011; Piepho et al., 2012).
In plant breeding experiments an independent estimate of the residual variance or the variance-covariance of the residual error is often available from the analysis that yielded adjusted means. This can be used as a fixed term in the RR-BLUP model (Chapter 2; 4; Piepho, 2009; Piepho et al., 2011). The computationally efficient algorithm for fitting the mixed model of Kang et al. (2008) can be extended for the case of a known residual
variance (Piepho et al., 2012). This approach is restricted to the case of independent residual errors. However, the assumption of independent errors can be restrictive, in particular for plant breeding experiments. In plant breeding experiments the error variances are often heterogeneous or experimental designs are unbalanced and hence the variance-covariance matrix of the adjusted genotype means can be complex. The restriction of independent residual errors can be lifted by rotating (orthogonalizing) the adjusted means to ensure independence of the rotated residual errors (Chapter 4). Thus, the mixed model of Kang et al. (2008) can now be generally used with residual errors with arbitrary variance-covariance structures (Chapter 4; Piepho et al., 2012). The implementation of the rotation approach for the mixed model of Kang et al. (2008), extended to apply to the special case with fixed residual error variance, is available as an R package rrBlupMethod6 in the Comprehensive R Archive Network (Piepho et al., 2012; Schulz-Streeck et al., 2012).
Computationally efficient methods for GS are especially important when cross-validation is used for the evaluation of methods. However, when using a very large number of markers the computation of the genomic relationship matrix dominates the computing time compared to solving the mixed model equations. The matrix multiplications can be optimized for computing time using optimized ‘do’ loops, within specific matrix multiplication subroutines and parallel processing (Aguilar et al., 2011). Additionally, the matrix multiplications can be accelerated by processing the matrix with the marker information in parts (Piepho et al., 2012). Given the efficient algorithms available for implementing it and its relatively high predictive accuracy on many empirical maize breeding datasets (Chapter 4; 5; Crossa et al., 2010; Albrecht et al., 2011; Zhao et al., 2012; Heslot et al., 2012; Riedelsheimer et al., 2012). RR-BLUP would seem an attractive and well-known and tested method for GS in maize breeding. However, the performance of RR-BLUP may vary considerably between populations (Chapter 4; 5; 6; Albrecht et al., 2011; Heslot et al., 2012) and some populations may show relatively low prediction accuracies (Chapter 6). It is yet not definitively known whether this variation in accuracy across populations reflects intrinsic differences between the populations themselves or is an inherent shortcoming of RR-BLUP. Comparisons of the performance of RR-BLUP with those of other methods on the same populations suggest that the former is the likelier of the two possibilities.
7.2.2. Extensions of the RR-BLUP model
The basic mixed model used for GS assumes homogenous variance for the markers (Meuwissen et al., 2001). Different methods have been proposed for GS to relax this strong and restrictive assumption, including BayesA and BayesB. However, different variance components for the markers can also be fitted in a mixed model framework to account for variance heterogeneity (Chapter 3; Meuwissen, 2009, Piepho, 2009). The effect of accounting for variance heterogeneity on predictive accuracy of GS has ranged from slight (Chapter 3; Pszczola et al., 2011) to substantial improvement in accuracy using simulated datasets (Meuwissen et al., 2001; Habier et al., 2007). Using empirical data the differences are negligible in maize breeding (Albrecht et al., 2011; Crossa et al., 2010; Heslot et al., 2012) and animal breeding in the majority of cases (Hayes et al., 2009c; Verbyla et al., 2009; Habier et al., 2011). If large-effect QTL are known to exist for a certain trait, markers linked to these QTL may be modelled with a different variance. In animal breeding using traits with known large effect QTL models allowing individual marker variances, like BayesA, fit these large effects better than models assuming homogenous marker variance, like BLUP methods, where all marker effects are shrunk equally (Verbyla et al., 2009). However, doing so will also not guarantee improvement in predictive accuracy using other traits (Hayes et al., 2009c; Verbyla et al., 2009). Additionally, the markers linked to QTL with known larger effects can be modelled as fixed effects using a mixed model in the spirit of association mapping methods. Moreover, proposals have been made to use the trait-specific relationship matrix in RR-BLUP models based on a small number of simulated QTL to improve accuracy of GS, but this improvement typically decreases as the number of simulated QTL increases (Zhang et al., 2011).
The estimated marker effects can differ between environments in maize breeding (Crossa et al., 2010). However, accounting for environment-specific marker effects had a relatively minor influence on predictive ability for the tested datasets in this thesis. Thus, GS carried out in a stagewise fashion may suffice for most practical purposes, such that the marker information can be omitted until the very last stage of the process. In the case where substantial differences between environments are known the focus of a breeder may shift to predicting the performance of a genotype in a specific subregion. This subregion should be represented by a sample of environments. In this case allowing for subregion-specific marker effects in different environments may enhance accuracy. Moreover, estimated marker effects can differ between populations in maize
breeding (Lui et al., 2011). In contrast, analyzing each population separately can be less accurate than a combined analysis that exploits information from related populations (Chapter 6; Albrecht et al., 2011; Jannink et al., 2010; Riedelsheimer et al., 2012; Zhao et al., 2012). It is feasible to account for the main and population-specific marker effects in the same model, but the improvement from using this model compared to modelling only main marker effects was negligible (Chapter 6). Using multiple populations and evaluating the accuracy of GS separately for each population yielded prediction accuracies that differed substantially among the populations, with some populations showing notably low predictive accuracies, similarly to findings of Heslot et al. (2012) and Albrecht et al. (2011). If only some of the populations have high predictive accuracies, this may lead to preferential selection of those populations and loss of diversity represented by the other populations as discussed by Heslot et al. (2012). Weighting the overall selection over the between and within-population selection may remedy this shortcoming (Jannink et al., 2010).
Polygenetic effects can be added to the RR-BLUP model to capture genetic variance not captured by the markers (Chapter 2; Calus and Veerkamp, 2007; Piepho, 2009; Albrecht et al., 2011). Polygenic effects are often modeled by the relationship matrix but can also be estimated using independent effects (Chapter 2; Piepho, 2009). The resulting model can be further extended to include simple random effects of the male and female parent and the crosses themselves (Chapter 2). Modeling polygenic effects is especially useful when using a small number of markers (Calus and Veerkamp, 2007), but merits caution as it may decrease accuracy (Legarra et al., 2008).
The RR-BLUP model is equivalent to a quadratic spatial model (Piepho, 2009). Different other spatial mixed models have been tested on simulated and real datasets but the differences in prediction accuracy among these models and with RR-BLUP have been minor (Chapters 2; 3; Piepho, 2009; Ober et al., 2011). Ober et al. (2011) found that using the Matérn function to model the covariance as a function of the genomic distance between pairs of genotypes can improve accuracy compared to a particular variant of RR-BLUP, called G-BLUP. However, RR-BLUP and its different spatial variants showed higher accuracies than the spatial Matérn model for empirical maize datasets (Appendix A). Thus, the Matérn model does not always perform better than the standard RR-BLUP model. Moreover, the Matérn model is a generalization of several