CROP NUTRIENT
DEFICIENCIES
& TOXICITIES
Plant Protection Programs
College of Agriculture, Food
and Natural Resources
Integrated
Pest
Management
Archive version
--
See
extension.missouri.edu
Archive
version
--
See
extension.missouri.edu
CONTENTS
How nutrient disorders develop . . . .3
Visual symptoms . . . .4
Sulfur-nitrogen . . . .5
Zinc-magnesium-iron-manganese . . . .5
Others . . . .5
Nutrient deficiency in corn . . . .6
Nutrient deficiency and toxicity in soybeans . . . .7
Nutrient deficiency in rice . . . .8
Nutrient deficiency in cotton . . . .9
Nutrient deficiency in wheat . . . .10
Nutrient deficiency in alfalfa . . . .11
Plant tissue testing . . . .12
Five steps in plant tissue testing . . . .12
Sampling plant tissue . . . .12
Submitting samples for testing . . . .14
Interpreting the test report . . . .14
Diagnosing nitrogen need from plant color .15 Measuring greenness . . . .15
Radiometry . . . .16
Aerial imagery . . . .16
Other field quick tests . . . .17
Table 1. Essential plant nutrients . . . .3
Table 2. Environmental conditions associated with crop nutrient deficiency .12 Table 3. Guide for plant sampling of selected agronomic crops . . . .13
Table 4. Guide for plant sampling of selected vegetables, fruits and trees . . .13
Plant analysis submission form . . . .18 Authors
Gene Stevens, Department of Agronomy, University of Missouri-Delta Center Peter Motavalli, Soil Science Program,
University of Missouri-Columbia Peter Scharf, Department of Agronomy,
University of Missouri-Columbia
Manjula Nathan, Department of Agronomy, University of Missouri-Columbia
David Dunn, Soil Test Laboratory, University of Missouri-Delta Center
Credits
Unless otherwise credited in the captions, the photographs were provided by the authors. Many of the symptom descriptions were taken from MU publication G9132, Signs of Crop Hunger, by Marshall Christy.
On the World Wide Web
Updates to this publication will be posted on the World Wide Web at:
http://muextension.missouri.edu/xplor/agguides/ pests/ipm1016.htm
Production
MU Extension and Agricultural Infomation Dale Langford, editor
Dennis Murphy, designer and illustrator
© 2002 University of Missouri
This publication is part of a series of IPM Manuals prepared by the Plant Protection Programs of the University of Missouri. Topics covered in the series include an introduction to scouting, weed identification and management, plant diseases, and insects of field and horticul-tural crops. These IPM Manuals are available from MU Extension at the following address:
Extension Publications 2800 Maguire Blvd. Columbia, MO 65211 1-800-292-0969 College of Agriculture Food and Natural Resources
the largest amounts. Micronutrients(iron, copper, manganese, zinc, boron, molybdenum, chlorine and nickel) are required in relatively smaller amounts in plants. Other mineral elements that are beneficial to some plants but are not consid-ered essential include sodium, cobalt, vanadium, selenium, aluminum and silicon.
A deficiency occurs when an essential element is not available in sufficient quantity to meet the needs of the growing plant. Nutrient toxicity occurs when an element is in excess of plant needs and decreases plant growth or qual-ity. Nutrient deficiency or toxicity symptoms often differ among species and varieties of plants.
HOW NUTRIENT
DISORDERS
DEVELOP
T
he occurrence of nutrient deficien-cies or toxicities is a result of soil, crop, climatic, and cultural factors. These factors interact to influence the availabil-ity of nutrients to crop plants over the course of a growing season.Soil properties influence the form, amount, retention and movement of soil nutrients. The effects of soil properties on water availability also influence nutrient availability, because water is essential for chemical reactions, biological activ-ity, and the transport and absorption of nutrients by roots. Among the critical soil chemical prop-erties affecting soil nutrient availability are soil pH (a measure of the acidity or alkalinity of a soil) and soil cation exchange capacity (a measure of the capacity of the soil to retain positively charged nutrient ions). Some important physical proper-ties affecting nutrient availability are soil texture (the proportion of sand, silt and clay-sized parti-cles in a soil), clay mineralogy (the type of soil clay), and soil structure (the physical arrange-ment of soil particles).
The soils of Missouri vary widely in their inherent soil fertility and suitability for crop production. Information about the specific soil resources on your farm can be obtained by consulting your regional extension specialist or your county Farm Service Agency office or by using the Center for Agricultural Resource and
S
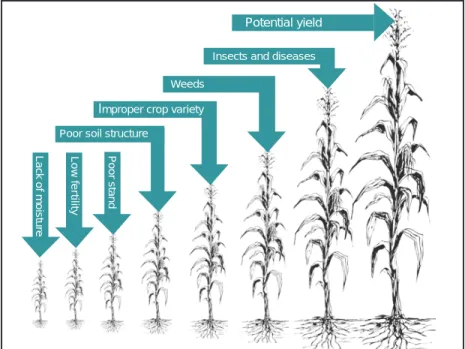
oil fertility is one of several factors,including light, moisture, weeds, insects, and diseases, that affect crop yield (Figure 1). An important part of crop farming is being able to identify and prevent plant nutrient deficiencies and toxicities. This publication provides background information on the nature and development of crop nutrient disorders under the growing conditions commonly encountered in Missouri. It is a guide to identifying crop nutrient problems through observable symptoms on crop plants. Information is provided on effects of climatic conditions on plant nutrient availability, and the results of soil and plant tissue testing.
Plants require 14 mineral elements for normal growth and reproduction. Each of these nutrients has a function in plants and is required in varying amounts in plant tissue (see Table 1). Macronutrients(nitrogen, phosphorus, potassium, calcium, magnesium and sulfur) are required in
CROP NUTRIENT
DEFICIENCIES
AND TOXICITIES
Table 1. Essential plant nutrients.
Name
Chemical symbol
Relative %
in plant* Function in plant Nutrient category
Nitrogen N 100 Proteins, amino acids
Primary macronutrients Phosphorus P 6 Nucleic acids, ATP
Potassium K 25 Catalyst, ion transport Calcium Ca 12.5 Cell wall component
Secondary macronutrients Magnesium Mg 8 Part of chlorophyll
Sulfur S 3 Amino acids Boron B 0.2 Cell wall component
Micronutrients Chlorine Cl 0.3 Photosynthesis reactions
Copper Cu 0.01 Component of enzymes Iron Fe 0.2 Chlorophyll synthesis Manganese Mn 0.1 Activates enzymes Molybdenum Mo 0.0001 Involved in N fixation Nickel Ni 0.001 Component of enzymes Zinc Zn 0.03 Activates enzymes
*Relative amounts of mineral elements compared to nitrogen in dry shoot tissue. May vary depending on plant species.
VISUAL
SYMPTOMS
N
utrient disorders may appear in many ways in a plant, including stunting or reduced growth, off-colored leaves (often white, yellow or purple); abnormally shaped leaves, stems, and roots; and a breakdown of certain parts of the plant, includ-ing the root system. “Chlorosis” is a type of defi-ciency or toxicity symptom characterized by yellowing that can be generalized over the whole plant, localized over individual leaves or isolated between some leaf veins (interveinal chlorosis). “Necrosis” is a type of deficiency or toxicity symp-tom characterized by death of plant tissue some-times in spots. Yield and quality of grain or fiber may suffer when nutrition is inadequate.When inspecting plants for symptoms of nutrient disorders, compare plants displaying symptoms with normal ones and examine new and older leaves. Nutrient deficiencies generally appear first in the oldest leaves when nitrogen, phosphorus, potassium, and magnesium are limit-ing. These nutrients move from one part of the plant to another as needed.
Younger leaves and terminal buds show a deficiency when sulfur, iron, calcium, zinc copper, boron, manganese or chlorine are limiting. These nutrients do not readily move about in the plant. As a deficiency becomes more severe, visual symptoms may spread to the whole plant, leaves may become more chlorotic or bleached in appear-ance, or stunting, deformity and death of plant parts may become more extensive. Deficiencies of certain nutrients, such as sulfur and phosphorus in corn, may also be visible only early in the growing season because of immature root development or cold weather, and then become less apparent as the plant matures and the weather warms up.
Symptoms of nutrient toxicity vary, depend-ing on the element and the crop. Essential nutri-ents that can be toxic to plants include manganese, copper, boron and chlorine. Excessive quantities of other nutrients in the soil may cause nutrient imbalances in plants, resulting in poor growth and crop quality.
Visual symptoms of nutrient deficiency or toxicity can be confusing because of problems with more than one nutrient. Symptoms associ-Environmental Systems (CARES) Web site
(www.cares.missouri.edu).The parent material of some soils may contain a large amount of certain plant nutrients (e.g., potassium, calcium and magnesium) and, therefore, the possibility of a plant response to additional fertilizer sources of those nutrients may be reduced. In addition, certain soils have natural soil physical and chem-ical restrictions that can limit potential crop productivity. A prior knowledge of your soil resources will help you to develop a successful nutrient management program.
Primary and secondary macronutrients are often limiting factors for crop production in Missouri depending on soil conditions and prior management. Most soils in Missouri have suffi-cient amounts of micronutrients to supply plant needs for crop production, but individual crop species may have special micronutrient require-ments, and soil properties may vary.
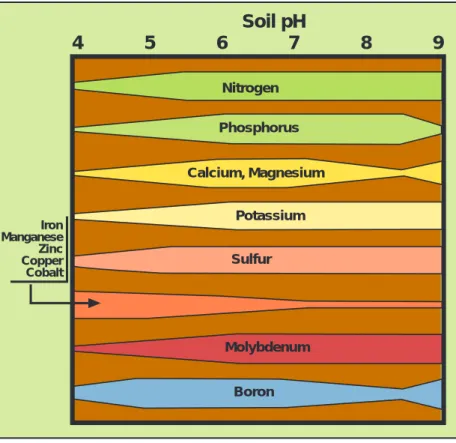
Factors such as soil pH and moisture can affect the solubility of nutrients or interfere with the ability of plant roots to absorb nutrients (Figure 2). Deficiencies of micronutrients occur most often in soils with high pH (with the excep-tion of molybdenum). Phosphorus availability is reduced by soil acidity and alkalinity. Low soil pH increases the availability of aluminum and manganese, which can result in toxic levels of these elements.
Potential yield
Insects and diseases Weeds P oor stand Lo w f e rtility Lac k of moisture
Poor soil structure
Improper crop variety
ears or grain. Split the stalks and study the inter-nal circulation system. If you observe potassium deficiency symptoms in cotton, always check inside the stalks for discoloration fromVerticillium or Fusarium wilt. Likewise, check for soybean cyst nematodes on soybean plants with potas-sium deficiency symptoms. Do not overlook possible contributing causes: disease, insects, herbicides, temperature, physical soil conditions and moisture conditions. Plants stressed from lack of nutrients are often more susceptible to diseases and some insects.
The following pages depict nutrient defi-ciency and toxicity symptoms in corn, soybeans, rice, cotton, wheat and alfalfa.
ated with different nutrients may resemble crop injury caused by herbicide damage, insect damage, or the effects of plant diseases. Listed below are nutrient deficiencies that may be diffi-cult to determine without laboratory tests.
Sulfur–Nitrogen
Symptoms of sulfur deficiency in crops are similar to those of nitrogen deficiency. The main difference is that sulfur deficiency may cause leaf yellowing, beginning in the younger leaves, whereas nitrogen deficiency starts in the older leaves and then spreads to the whole plant. In some environments, sulfur and nitrogen deficien-cies can cause yellowing between the leaf veins. Without tissue testing, these similarities may cause misdiagnosis of the problem. Tissue testing effec-tively determines whether nitrogen or sulfur is in short supply.
Zinc–Magnesium–Iron–Manganese
Deficiencies of zinc, magnesium, iron, and manganese all typically cause yellowing of the tissue between leaf veins. Deficiencies of iron and manganese usually occur in high-pH soils, but these are rare in Missouri. Zinc deficiency is most common in corn, and the bleached area can spread to include the veins, but the midrib and leaf edges usually stay green. With magnesium defi-ciency, yellowing between veins will be seen mainly on older (lower) leaves, while zinc, iron and manganese deficiency symptoms will be seen mainly on younger (upper) leaves. Magnesium deficiency is best diagnosed with a soil test.
Others
Use care to distinguish among various under-lying causes of crop deficiency symptoms. Insect damage may look like a nutrient deficiency. Herbicides sometimes affect root, stem and leaf development, thereby impairing nutrient uptake. Diseases also can impair nutrient uptake by roots or the translocation of nutrients in the plant. Examine stems and stalks, root systems and the
Potassium Iron Manganese Zinc Copper Cobalt
Soil pH
Boron Molybdenum Sulfur Phosphorus Calcium, Magnesium Nitrogen4
5
6
7
8
9
Figure 2. The relative availability of nutrients to plant roots depends on the pH level of the soil.
Cor
n
Figure 5. Corn with potassium deficiency is stunted and easily lodged. Photo: Gerald Bryan.
Figure 6. Potassium deficiency in corn causes bronzing and yellowing along edes of lower leaves.
Figure 7. Phosphorus-deficient corn plants sometimes have purple leaves.
Figure 4. Nitrogen-deficient corn plants have pale green or yellow leaves.
Figure 8. Zinc deficiency causes yellow stripes in the upper corn leaves.
Firing or drying at tips and along leaf edges (oldest leaves affected first); leaf edges ragged; iron accumu-lation in joints; weak stalks and excessive lodging; short internodes; poorly filled ear tips; chaffy nubbins (starchy, dull-colored kernels); roots weak (rot off); slow maturity (Figures 5 and 6).
Stunted, slow early growth; purplish stalks and leaf tips of young plants (may be characteristics of some varieties); weak stalks; shallow root system; delayed emergence of silks; imperfect pollination and barren stalks; missing rows of kernels on ears: small twisted or curved ears; retarded maturity (Figure 7).
Yellowing from leaf tip and along midrib while edges remain green (oldest leaves affected first); spindly stalks; stunted growth; small ears (fail to fill at tip); ear tip pinched off: kernels have glossy luster (low in protein, but high in fats); light brown stover at maturity; poor yields (Figures 3 and 4).
Narrow yellow or white stripes between veins of upper leaves (Figure 8). Stripes may join together to form a bleached area between midrib and leaf margins, which remain green.
Potassium deficiency Nitrogen deficiency
Zinc deficiency
White or yellowish streaking or bleaching between leaf veins; mainly on lower leaves. When rubbed, the affected tissue may reveal a distinctive slickness (Figure 9).
Magnesium deficiency Phosphorus deficiency
Figure 9. Magnesium-deficient corn will have white or yellow stripes on the lower leaves.
Figure 3. Yellow or brown midribs indicate nitrogen deficiency.
Soybeans
Figure 10. Leaves on right are from manganese-deficient plants. Manganese toxicity is common on low-pH soils.
Figure 11. Manganese deficiency causes yellowing between veins.
Irregular yellow mottling on leaflet edges, drying and curling downward (older leaves affected first); dead leaf tissue falls away from leaf edges leaving ragged appearance; shriveled, poorly shaped seed; delayed maturity and poor yields (Figure 13).
Potassium deficiency
Figure 13. Potassium deficiency in soybeans causes yellow areas along leaf margins between veins.
Seasonal changes in soil moisture affect salt tolerance; plants may be healthy in spring; as soil becomes dry, salt causes plants to wilt and die; soil may have a white or light gray-colored crust on the surface (Figures 14 and 15).
Salt toxicity
Leaves have scorched appearance and eventually fall off the plants (Figure 12).
Boron toxicity
Figure 12. Boron toxicity causes brown areas on soybean leaves.
Leaves are mostly yellow, gradually becoming dark green next to veins; deficient plants are usually on dark sandy soils that tie up manganese. Foliar or banded applications of manganese fertilizer are used to mini-mize fixation (Figures 10 and 11).
Manganese deficiency
Figure 15. White crystals on soil surface usually indicate toxic levels of sodium for soybeans. Photo: Steve Hefner.
Figure 14. Dead areas in this soybean field were caused by sodium toxicity.
Rice
Red or brown discoloration on tips and margins of leaves; severity of condition varies by variety; leaf symp-toms usually develop after internode elongation (Figure 16).
Potassium deficiency
Figure 16. Potassium-deficient rice will have yellow or brown areas on leaf tips and edges.
Slow, dwarfed growth; may not be noticeable until sick plants are compared with healthy plants of the same age; abnormal bluish green color of foliage; slow matu-rity; poor yield and milling (Figure 21).
Phosphorus deficiency
Figure 21. Rice plants on the right did not receive preplant phosphorus fertilizer.
Poor tillering; leaves and stalks pale yellowish green with extreme yellowing of lower leaves on young plants; spindly stems and short heads; yellowing starts at leaf tip of older leaves; plants do not form a complete canopy over water; poor yields (Figures 17 and 18).
Nitrogen deficiency
Figure 17. Nitrogen-deficient rice is pale green in color and does not form a full canopy.
Figure 18. Tools such as the plant area board (above) and the cholorphyll meter can be used to monitor the nitrogen status of rice.
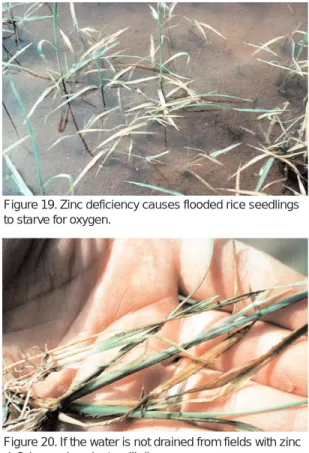
Leaves begin to turn brown after flooding fields; plants float limply on the water surface instead of standing erect. If well water has calcium carbonate, the problem is most acute at the water inlet or other high pH loca-tions in fields; if the field is not drained quickly, rice plants will die (Figures 19 and 20).
Zinc deficiency
Figure 19. Zinc deficiency causes flooded rice seedlings to starve for oxygen.
Figure 20. If the water is not drained from fields with zinc deficiency, rice plants will die.
Cotton
Magnesium deficiency causes purplish red leaves withgreen veins; symptoms late in season can be easily mistaken for normal aging; appears first in lower leaves (Figure 23).
“Rust” starts with yellowish white mottling of leaves; tip and margin of leaves scorch and curl downward; whole leaves turn reddish brown, die and shed prema-turely; dwarfed immature bolls; plants are more suscep-tible to wilt diseases (Figures 26 and 27).
Potassium deficiency Magnesium deficiency
Figure 26. Cotton leaves with potassium deficiency have yellow or bronze edges.
Figure 27. Potassium deficiency in cotton at midbloom.
Poor germination and emergence; death of seedling plants; new leaves are “crinkled” as in thrips insect damage; yellowish green foliage color; limited and delayed fruiting; bending and collapse of leaf petioles; underdeveloped root system; delayed maturity (Figure 24).
Low soil pH
Figure 24. Cotton grown on acid soil can have aluminum and manganese toxicity. The crinkle leaf symptom is often mistaken for insect damage. Photo: Mike Milam.
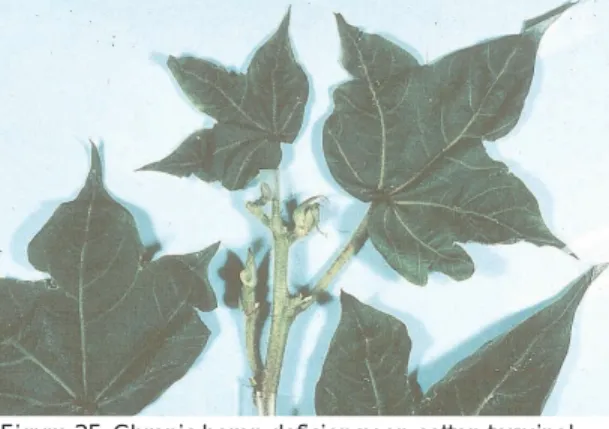
First symptom is usually dark rings on leaf petioles; as the season progresses, some leaves may become deformed (Figure 25).
Boron deficiency
Figure 25. Chronic boron deficiency on cotton terminal. Photo: Woody Miley, Arkansas Cooperative Extension Service.
Yellowish green foliage; older leaves dry up and shed prematurely; stunted growth; fruiting branches fail to develop (Figures 22 and 23).
Nitrogen deficiency
Figure 22. Light green strips in this cotton field indicate poor distribution of nitrogen fertilizer.
Figure 23. Magnesium deficiency causes purplish leaves in cotton.
Wheat
Mild phosphorus deficiency in wheat can only be char-acterized by stunted growth with no distinct leaf symp-toms. In severe cases, phosphorus-deficient plants become purple or brown (Figure 32).
Phosphorus deficiency
Figure 32. Stunted wheat plants with purple leaves and dead leaf tips are signs of phosphorus deficiency.
Sulfur deficiency in wheat usually occurs on sandy soils with low organic matter. Wheat plants with low sulfur have pale green leaves and fail to “green-up” when more nitrogen fertilizer is applied. Tissue testing is usually needed to distinguish between nitrogen and sulfur deficiency (Figure 30).
Sulfur deficiency
Figure 30. Wheat leaves with pale green or yellow color indicate sulfur deficiency.
Wheat plants with nitrogen deficiency have reduced plant height and produce fewer tillers than healthy plan. Leaf color in nitrogen-deficient plants is pale green or yellow, resembling the symptoms of sulfur deficiency (Figure 31).
Nitrogen deficiency
Figure 31. Nitrogen-deficient wheat is stunted with yellow leaves.
The leaves of wheat with potassium deficiency are yellow or brown along the tips (Figure 28). Potassium deficiency in wheat is difficult to diagnose without supporting tissue test results. Symptoms from K defi-ciency are similar to symptoms caused by disease and injury from blowing sand (Figure 29).
Potassium deficiency
Figure 28. Leaves with yellow tips becoming scorched along the edges indicate potassium deficiency.
Figure 29. Blowing sand can cause scorched leaf tips resembling potassium deficiency, but the rest of the plant will usually be of normal size and color.
Alfalfa
Yellow leaf color in alfalfa may be caused by potassiumdeficiency. This deficiency begins at the bottom of the plants with small white spots on leaf edges. As potas-sium deficiency progresses, the tissue between the spots turns yellow or brown and the leaves become ragged. Second and third cuttings are usually affected the most by potassium deficiency (Figure 33).
Potassium deficiency
Figure 33. White spots on edges of lower alfalfa leaves are caused by potassium deficiency; as plants get older leaves turn yellow.
Alfalfa plants with phosphorus deficiency have retarded growth and small leaves (Figure 34).
Phosphorus deficiency
Figure 34. Stunted alfalfa growth caused by phosphorus deficiency.
The deficiency of boron is more common in alfalfa than in other legumes. The upper leaves develop a reddish yellow rosette appearance (Figures 35 and 36). Injury from potato leafhopper is often confused for boron or potassium deficiency (Figure 37).
Boron deficiency
Figure 35. Boron deficiency causes yellow areas in alfalfa fields.
Figure 36. Closeup of boron-deficient alfalfa.
Figure 37. Leafhopper injury can be confused with boron deficiency but causes a yellow “V” at the tip of a leaf.
Sampling plant tissue
Nutrient analysis of plant tissue at different growth stages is a major tool for determining which nutrients are limiting growth. Plant moni-toring with tissue testing is especially important with high value crops. Plant nutrient content will vary depending on the type of plant being sampled, the specific plant part sampled, and the stage of growth of the plant.
Tables 3 and 4 provide guides for suggested stages of growth and plant parts to sample for
S
oil testing is the foundation of a soundnutrient management program and will help prevent the development of crop nutrient deficiencies. Soil and plant testing are also valuable diagnostic tools when possible nutri-ent deficiency symptoms are seen. Similar visual symptoms may be caused by different nutrient deficiencies or toxicities and by herbicide injury, diseases, insect damage or environmental condi-tions. As a result, diagnosis based on symptoms alone is much less reliable than diagnosis based on symptoms plus additional evidence, which may include soil test results, plant tissue test results or knowledge of other factors that are associated with deficiencies of particular nutrients (see Table 2).
Plant tissue testing is the most accurate of all diagnostic tools for nutrient deficiencies, partic-ularly when paired samples are taken. Plants with possible deficiency symptoms should be compared with nearby plants that appear to be healthy.
Tissue testing is also the only way to detect "hidden hunger." Mild nutrient deficiencies may not produce obvious visual symptoms, such as leaf yellowing or chlorosis. However, significant reductions in crop yields can occur with these deficiencies. Steps for successfully using tissue tests are shown in the box below.
PLANT TISSUE TESTING
Figure 38. “Hidden hunger,” caused by mild nutrient deficiencies, can be detected only by soil or tissue analysis.
Table 2. Environmental conditions associated with selected crop nutrient deficiencies.
Nutrient Conditions favoring deficiency M a c r o n u t r i e n t s
Nitrogen • Wet currently, or wet since fertilizer application
• Surface application of urea
• Broadcast N solution on high-residue surface
Phosphorus • High or low soil pH • High soil clay content Potassium • Dry or wet soil
• Compacted soil
Sulfur • Sandy soil low in organic matter • Cool, wet weather
M i c r o n u t r i e n t s
Zinc • Very low soil organic matter (terrace channels, cut areas in leveled fields) • Cool, wet weather
• High soil pH Iron • High soil pH Manganese • High soil pH
Five steps in plant tissue testing
1. Determine correct plant part to sample and how many plants to sample (see Table 3). Collect samples from affected plants and from nearby healthy plants.
2. Handle samples prop-erly after collection to avoid contamination and potential molding.
3. Clearly label all sample bags and maintain records of sampling date, field name or number and any other identifying information.
4. Complete plant sample information forms for submission of samples to your regional soil and plant testing laboratory.
5. Maintain records of plant tissue test results and consult regional and local extension agents if you have questions about the results and the test interpretations.
Table 3. Guide for plant sampling of selected agronomic crops.
Plant Stage of growth Plant part Number of plants to sample
Corn
Seedling (<4 inches in height) Whole aboveground plant 20–30 Early growth (>4 inches in height
to tasseling) Entire leaf fully developed below the whorl 15–25 Tasseling/bloom Earleaf 15–25
Maturity Earleaf 15–25
Soybean Seedling Whole aboveground plant 20–30 Early growth and flowering Most recently matured trifoliate leaves 20–30 Small grains Seedling to tillering Whole plant 50–60
Before heading Upper 1/3rd of plant 50–60 Alfalfa Before bloom (1/10th bloom) Top 6 inches or top 1/3 40–50 Harvest Top 6 inches or top 1/3 40–50 Sorghum Head fully emerged but before
pollination Most recently matured and fully expanded leaves 15–25 Cotton First square to midbloom Fourth petiole from the top of plant 30–40 Rice First tiller (preflood) Whole aboveground plant 25–35
Sources:
Campbell, C.Ray (ed.) 2000. Reference sufficiency ranges for plant analysis in the Southern Region of the United States. Southern Cooperative Series Bulletin #394, Raleigh, N.C.
Mills, Harry A., and J. Benton Jones, Jr. 1996. Plant Analysis Handbook II, MicroMacro Publishing, Inc., Jefferson City, Mo.
Table 4. Guide for plant sampling of selected vegetables, fruits and trees.
Plant Stage of growth Plant part
Number of plants to sample
Apples July 15 to August 15 Leaf from middle of current terminal shoot 60 Asparagus Mature fern (August) Fern from 17 to 35 inches up 20 Beans, snap Initial flowering Young mature trifoliate 50 Beans, table Mature Young mature leaf 20 Blueberries First week of harvest Young mature leaf 50 Broccoli Heading Young mature leaf 15 Cabbage Heads, 1/2 grown Young wrapper leaf 15 Cantaloupe Early fruiting Fifth leaf from tip 25 Carrots Midgrowth Young mature leaf 25 Cauliflower Buttoning Young mature leaf 15 Celery Half-grown Young mature leaf 20 Cherry Summer Mature leaves from new growth 50 Cucumbers Early fruiting Fifth leaf from tip 20 Grapes Flowering Petiole from young mature leaf 75 Lettuce Heads, 1/2 size Wrapper leaf 20 Onions Midgrowth Top, no white portions 25 Peaches/nectarines Spring at fruit set Midshoot leaf 20 Peas First bloom Recently matured leaflet 50 Pecan 56–84 days after terminal bud set Leaflet pairs from new growth 25 Peppers Early fruiting Young mature leaf 20 Plum Summer Whole leaf from midshoot growth 25 Potatoes 40–50 days after emergence Young mature leaf 20 Pumpkin/squash Early fruiting Young mature leaf 15 Radishes Midgrowth to harvest Young mature leaf 40 Raspberries First week in August Leaf 18 inches from tip 50 Spinach 30–50 days old Young mature leaf 35 Strawberries At flowering Young mature leaf 20 Sweet corn Tasseling to silk Ear leaf 10 Tomatoes First mature fruit Young mature leaf 20 Walnut (black) Summer Mature leaf from new growth 5 Walnut (English) Summer Center leaflet from mature leaf 25 Watermelons Midgrowth Young mature leaf 15
growing well and from another area in which the plants are affected by a suspected nutrient disor-der. This comparison can assist in diagnosing specific nutrient problems, especially when nutri-ent sufficiency ranges are not available for a specific crop, growth stage or plant part. Plant tissue samples from one plant may not be repre-sentative of all the plants in a field with a similar problem. To obtain a representative sample, avoid collecting plants that have insect damage, are infested with disease, are covered with dust or soil or foliar-applied sprays, or are border row plants. If possible, take random plant samples from several plants distributed throughout the affected area of the field.
Submitting samples for testing
Remove any soil or foreign matter on the collected plant material by wiping with a clean damp cloth or rinsing directly with water while the material is still fresh. Place the collected plant tissue samples in a clearly labeled paper bag. If the plant part is collected and stored in plastic bags for more than several hours, be sure to refriger-ate it to prevent the plant mrefriger-aterial from molding. Air dry the plant sample for 12 to 24 hours before mailing it in an envelope or dropping it off at your regional soil and plant testing laboratory or exten-sion office.
Maintain records of the sampling date, field location, submission date to the soil and plant testing laboratory and any prior results of tissue or soil testing. These records will help you to keep track of your samples and assist you in moni-toring the effectiveness of your fertility manage-ment program over time.
Your regional soil and plant testing laboratory will have forms for submission of samples for plant tissue testing (see the Plant Analysis Information Form for the University of Missouri Soil and Plant Testing Laboratory, page 18). Providing the requested information on the forms is crucial for interpreting analytical results from plant tissue testing. You may wish to consult your local or regional extension agent or the soil and plant testing laboratory as to the appropriate analytical tests for your situation.
Interpreting the test report
You will be sent your plant sample test results within about five working days after the MU soil and plant testing laboratory receives your plant samples (times may vary for other labs). An inter-common agronomic and horticultural crops in
Missouri. When the recommended plant part is sampled at the designated stage of growth, the soil and plant testing laboratory can compare the results of the tissue test with established nutrient sufficiency ranges for the crop.
If specific sampling instructions are not found in the selected crops, the rule of thumb is to sample upper, recently matured leaves. The recommended time to sample is just before the beginning of the reproductive stage for many plants. More specific information on plant tissue sampling procedures and available nutrient suffi-ciency ranges can be obtained by consulting your regional soil and plant testing laboratory.
In sampling plants for tissue testing, it is crit-ical to obtain a representative sample. Take sepa-rate plant samples from an area in which plants are
Crop color can also be measured using instruments designed for this purpose. This approach may allow greater sensitivity to small differences in color, as well as making it easier to collect enough color information to get a good field average. It can also be used to characterize the spatial variability of crop color in support of variable-rate nitrogen applications. Several
differ-N
itrogen is one of the mostcommonly deficient plant nutrients because large amounts of this element are required to produce amino acids and proteins in the tissue and because nitrogen is easily lost from the soil during wet conditions. Nitrogen-deficient crops are lighter green in color than healthy crops. The lighter the green, the more severe the deficiency and the more nitrogen fertilizer will be required to correct the deficiency. Crop color can be used as a guide to how much fertilizer to apply to correct deficiencies.
There is also pressure, for environmental reasons, to reduce overapplication of nitrogen fertilizer. Diagnosing nitrogen need from plant color has the potential to give accurate nitrogen rate recommendations that will ensure optimal crop yield while reducing overapplication of N.
Measuring greenness
The simplest way to measure plant color is by visual comparison to a color scale. The University of California has developed a leaf color chart to measure the “greenness” of crops (Figure 39), and has developed interpretations of the color chart to guide midseason nitrogen applications for rice.
pretation of the results will also be included based on crop and management information, available nutrient sufficiency ranges, available soil test information, and (when paired samples are submitted) comparison of test results from affected and healthy areas (see the example of a plant tissue test report on page 14).
The sufficiency level for a particular nutrient may depend on genetic and environmental factors. The sample from the healthy area of your field establishes the tissue nutrient levels needed for healthy plants, given the genetics, soil type, and weather specific to your field.
Only nutrients with substantially different test levels between the affected and healthy areas should be considered as possibly deficient and contributing to the observed symptoms. If the observed symptoms are typical for a particular nutrient deficiency, and if the tissue levels are
higher for that nutrient in the healthy area than in the affected area, then deficiency of that nutri-ent is strongly indicated. For example, if brown-ing of the edges of older (lower) leaves is observed, and tissue potassium levels are higher in healthy plants than in affected plants, then potassium deficiency is a solid and convincing diagnosis.
If you do not submit healthy plants, the results from your affected plants will instead be compared with a large database of tissue test results for your crop to determine which nutrients may be deficient or excessive. Once a diagnosis of nutrient deficiency is made, the appropriate nutri-ent may be applied immediately or for the next growing season. Your local or regional extension specialist can assist you in understanding the report and determining its significance for your future management.
DIAGNOSING NITROGEN NEED
FROM PLANT COLOR
Figure 39. Visual rating of "greenness" of corn plants with leaf color chart (scale 1 to 8). The row on the right did not receive nitrogen fertilizer. Preplant nitrogen fertilizer was applied in the left row.
Aerial imagery
Aerial images acquired with film or with digi-tal image capture from satellites or airplanes provide another way to measure crop color (Figure 43). This approach is particularly well suited for detecting for nitrogen deficiencies, because large areas can be examined quickly. Images are also well suited for detecting spatial patterns of nitrogen deficiency and producing variable-rate nitrogen recommendations. Experiments in Missouri have produced methods for interpreting images to produce nitrogen rate recommendations for corn, but capabilities for ent types of instruments can be used in
measur-ing crop color. One of the simplest is the Minolta SPAD chlorophyll meter, a portable hand-held device that clamps over a leaf (Figures 40 and 41). This meter measures transmittance of red and infrared light through the leaf and displays a number that is proportional to the nitrogen and chlorophyll concentrations in the leaf. As with soil or tissue samples, numerous measurements spread out evenly over the sample area must be taken to get a reliable average. Several states have devel-oped or are developing interpretations to convert meter readings to nitrogen fertilizer recommen-dations.
Radiometry
A spectral radiometer can also be used to measure crop color. Most spectral radiometers measure light intensity over a range of visible and near-infrared light wavelengths. One advantage of spectral radiometers, relative to the chlorophyll meter, is that they can be mounted on nitrogen applicators (Figure 42). The color measurements then represent a much larger amount of plant tissue, can capture spatial patterns in crop color, and can be used to guide variable-rate nitrogen applications. Norsk Hydro manufactures a system based on this concept for variable-rate nitrogen applications to small grains.
The disadvantage of spectral radiometers is that their readings are sensitive to sunlight inten-sity, sun angle, cloud cover and interaction of sun angle with plant geometry. A radiometer posi-tioned to measure the intensity of incoming light, as well as the light reflected from the crop, helps to correct for these variations. Additional advances in these areas will improve the quality of the nitrogen recommendations from spectral radiometers.
Figure 41. Hand-held devices such as a SPAD chlorophyll meter can be used to monitor the nitrogen status of crops. Figure 40. SPAD
chlorophyll meter.
Figure 42. A spectral radiometer mounted on a variable-rate applicator can reduce overapplication while deliver-ing nitrogen fertilizer where it is needed.
Figure 43. Aerial images can assist in detecting crop stresses, including nutrient deficiency. In Missouri, nitrogen deficiency and waterlogging are the main causes of yellow-green corn.
Among the disadvantages of quick test kits is their sensitivity to differences in types of plants, sample handling, and the time of day when samples are taken. For example, time of day, temperature and cloudiness can affect the concen-tration of nitrate in plant sap and the calibration of the instrument. For consistent results, samples should be collected at a standard time of day (10 am to 2 pm) and taken indoors for analysis or in a shady area away from direct sunlight and wind. For woody plants, such as cotton, collecting suffi-cient sap to test can be a problem. Often it helps to freeze the sample briefly because freezing breaks down the cell walls and releases a larger volume of sap.
The usefulness of quick tests for plant nutri-ent managemnutri-ent depends on the availability of research-based information for interpreting nutrient concentrations in plant sap for specific crops. In Misssouri, research is being conducted for developing interpretation information for nitrogen and potassium readings from the Cardy® meter for cotton. Interpretation tables should provide information that shows the ranges of deficient and sufficient nutrient concentra-tions for plant sap for the specific plant part and growth stage of the sampled crop.
Other disadvantages of many quick test kits are a lack of quality control (e.g., use of standards and blanks to ensure the test procedure is work-ing), dependence on a single supplier for new reagents and replacement parts for the kit, and the effects of improper storage on the viability of chemicals or strips used in the procedures. acquiring and processing images and delivering
results to producers in a timely manner remain limited. It may be difficult to detect nitrogen deficiencies from aerial images before the crop has a high percentage of ground cover.
Factors other than nitrogen deficiency can cause light-green or yellow-green coloration of crops. These factors include disease, insect damage, herbicide damage, and deficiencies of other nutrients. Automated sensors probably cannot detect the other features that allow the human eye to distinguish between these causes. Thus, these sensors are most suited to production systems in which nitrogen deficiency is by far the most common cause of light-green foliage. This would be the case when a main part of the crop’s nitrogen fertilizer requirement is to be applied based on color measurements. Humid regions, with greater potential for nitrogen loss and defi-ciencies, will be more suited to these tools than semiarid regions. Soils with high pH may be less suited for these types of color measurements because of relatively common micronutrient (iron, manganese, zinc) deficiencies that cause a light green or yellow-green color in the crop.
Other field quick tests
New technology and the need for rapid in-field plant testing results have stimulated an inter-est in “quick tinter-est kits” for determining plant nutri-ent deficiencies. These kits often have the advantages of being portable, less expensive than standard laboratory methods, and suitable for use by growers and consultants without extensive laboratory training.
Extensive research has been conducted, espe-cially among horticultural crops, on several quick test procedures, including the measurement of nitrate and potassium in plant sap as indicators of plant nitrogen and potassium nutrition. Concentrations of nitrate and potassium are usually measured with an ion-selective electrode (for example, the Horiba Cardy® nitrate or potas-sium meters, Figure 44) or by use of colorimet-ric test strips (for example, Merckoquant® nitrate test strips). With the ion-selective electrode, nitrate or potassium concentrations are deter-mined based on readings from standard solutions of known concentrations. For test strips, a cali-brated color chart or a strip color reader can be used to estimate the color intensity, which is then converted to nutrient concentrations based on information supplied with the kit.
Figure 44. Using a Cardy® meter to test nitrate in cotton plants begins with extracting sap from cotton petioles with a garlic press.
Plant Analysis
Soil and Plant Testing Laboratory 23 Mumford Hall, University of Missouri Columbia, MO 65211
573-882-0623 Fax: 573-884-4288
(Please type or print) Lab # Lab Use Only
Date Sampled _______/_______/_______ Date Received
Name Firm submitting Address Address (City) (State) (zip code) (City) (State) (zip code) Tel: Fax: Tel: Fax: e-mail address e-mail address County to be billed & Code___________________ Firm # Outlet #
Sample identification Crop
Field I.D. PreviousCrop
Stage of Growth Accompanied by soil sample? Yes_______ No_____
Moisture If Yes: Serial #
When last limed Soil Test Results
Position on landscape N P K Ca
Fertilizer applied Mg pH OM CEC Other:
Description of problem:
Check Tests Desired for this sample Analysis Cost Total Cost
Regular Analysis: Nitrogen, phosphorus, potassium,
calcium and magnesium + drying and/or grinding $17.00
Micronutrients: (with regular analysis)
Fe, Zn, Cu, Mn
$6.00
($1.50 per micro-nutrient)
Analysis Package: (Regular+Micronutrients+Boron)
N, P, K, Ca, Mg, Fe, Cu, Zn, Mn, B $25.00
Individual analyses (per nutrient)
Nitrogen (TKN) $10.00 Phosphorus (P) $5.00 Potassium (K) $5.00 Calcium (Ca) $4.00 Magnesium (Mg) $4.00 Iron (Fe) $4.00 Copper (Cu) $4.00 Manganese (Mn) $4.00 Zinc (Zn) $4.00 Sulfate-S $6.50 Nitrate-N $8.00 Boron (B) $5.00 Chloride $6.50 Sample Grinding $2.00
Total Due for this sample
We encourage a plant sample be taken from a poor growing area and compared to a sample from an adjacent normal area. The
testing fee for a good sample accompanying an abnormal sample will be analyzed at one-half the regular price. Samples will be
For further information
Available from Extension Publications 1-800-292-0969 XPLOR[Extension Publications Library on Request]
on the Web at http://muextension.missouri.edu/xplor/ EC929 – Micro and Secondary Nutrients in Missouri
G9110 – How to Get a Good Soil Sample G9112 – Interpreting Missouri Sil Test Reports G9174 – Nitrogen in Missouri Soils
G9175 – Nitrogen Management for Conservation Tillage in Missouri G9180 – Phosphorus in Missouri Soils
G9185 – Potassium in Missouri Soils G9804 – Nitrate in Soils and Plants
MP729 – Use of a Portable Chlorophyll Meter to Manage Crop Nitrogen in Rice NCR326 – Management of Urea Fertilizers
Other publications
American Phytopathological Society. Nutrient Deficiencies and Toxicities of Plants CD-ROM. Web address for ordering: http://www.scisoc.org/apspress/
Bennett, William F. 1993. Nutrient Deficiencies and Toxicities in Crop Plants. American Phytopathological Society (APS). Web address for ordering:
http://www.scisoc.org/apspress/.
Mills, Harry A., and J. Benton Jones, Jr. 1996. Plant Analysis Handbook II. Micro-Macro Publishing, Inc. Phone number for ordering: 1-800-500-4635, email for ordering: mmi@sockets.net.
Potash and Phosphate Institute. 1999. Nutrient Deficiency Symptoms CD-ROM. Phone number for ordering: (770) 447-0335, e-mail for ordering:
■Issued in furtherance of Cooperative Extension Work Acts of May 8 and June 30, 1914, in cooperation with the United States Department of Agriculture. Ronald J. Turner, Director, Cooperative Extension, University of Missouri and Lincoln University, Columbia, MO 65211. ■University Outreach and Extension does not discriminate on the basis of race, color, national origin, sex, religion, age, disability or status as a Vietnam era veteran in employment or programs. ■ If you have special needs as addressed by the Americans with Disabilities Act and need this publi-cation in an alternative format, write ADA Officer, Extension and Agricultural Information, 1-98 Agriculture Building, Columbia, MO 65211, or call (573) 882-7216. Reasonable efforts will be made to accommodate your special needs.
OUTREACH & EXTENSION
UNIVERSITY OF MISSOURI COLUMBIA