Data Mining Algorithm for Rock Magnetic Data Analysis
WANWU GUO
School of Computer and Information Science
Edith Cowan University
2 Bradford Street, Mount Lawley, WA 6050, AUSTRALIA
Abstract – The correlation between magnetic susceptibility and the content of magnetite is important in interpretation of magnetic anomalies, and understanding the basic magnetic behaviour of rocks in rock magnetism study. A few correlations were proposed in the 1950s-1960s and have been widely used. In the last a few decades, the adoption of new technologies in chemical analysis and magnetic measurements have led to the acquisition of more new rock magnetic data in a format different from the data obtained before. There is a need to establish new correlations between the susceptibility and magnetite content in rocks using the collection of data from both current and previous studies. The statistical analysis used in the previous studies was predominantly focused on seeking a sole linear or power correlation between susceptibility and magnetite content. This is because each study used the data collected from a confined area where the magnetite content in rocks was naturally concentrated within a certain range. Multiple correlations may be determined for different ranges of magnetite content if a database consisting of the data from various regions is used for the statistical analysis. In this study, data mining technique is introduced to rock magnetic data analysis. A data mining algorithm is designed to carry out data selection, pre-processing, transformation, and data analysis for rock magnetic data. This algorithm is able to search for linear, power, logarithmic, and exponential correlations that may exist between susceptibility and magnetite content contained in rocks. This algorithm is tested using a new magnetic database constructed by collecting the datasets from the previous studies. The results from this data mining process are then interpreted incorporating with the relevant knowledge in rock magnetism. Although strong linear, power, logarithmic, and exponential correlations are all revealed by this algorithm, only the power and exponential correlations are considered useful for different ranges of magnetite content in rock magnetism study.
Key-Words: - Data mining, Algorithm design, linear regression, Magnetic data, Rock magnetism
1
Introduction
Owing to the importance of the correlation between magnetic susceptibility and the content of magnetite in interpretation of magnetic anomalies, a few studies were conducted from the 1950s to 1960s resulting in some statistical relationships between susceptibility and magnetite content by volume [1][2][3]. These relationships have been widely used not only in interpretation of magnetic anomalies, but also in rock magnetism as fundamental knowledge for understanding the basic magnetic behaviour of rocks [4][5][6]. Currently, the more accurate X-ray diffraction (XRD) analysis is widely used to determine magnetite content. Therefore, to couple magnetic susceptibility with the outcome of the XRD analysis as weight percentage, there is a need to establish new correlations between the susceptibility and weight percentage of magnetite.
In practice, susceptibility data are relatively easier and cheaper to obtain in the laboratory, and thus a huge susceptibility database is relatively easier to construct. However, XRD analysis is more expensive and thus is usually applied to limited selected samples for rock magnetic studies. As a result, it is common that in a huge magnetic database some datasets may contain many values fields including both susceptibility and XRD data, whereas most datasets contain data items without XRD data. It is also possible that in the data collection a dataset may contain XRD data but no susceptibility result if the dataset is resulted from a pure palaeomagnetism study. Added to this complexity, the volume percentage of magnetite in the previous studies should be converted to its corresponding weigh percentage and its susceptibility value in csg should be converted to the standard SI unit so that the dataset can be reused.
The statistical analysis used in the previous studies was predominantly focused on seeking a sole linear or power correlation between susceptibility and magnetite content. This is because each study used the data collected from a confined area where the magnetite content in rocks was naturally concentrated within a certain range. It is possible that multiple correlations may be determined for different ranges of magnetite content if a database consisting of the data from various regions is used for the statistical analysis.
Considering the concerns from both the data collection and methods of statistical analysis, using data mining techniques to rock magnetic data analysis becomes a logical choice. This is because the data mining techniques not only provide a sequence of processing in data selection, pre-processing, transformation, and mining/analysis, but also leave the interpretation of the mined results to the researchers for making meaningful conclusions incorporating with other knowledge in the same domain [7][8].
In this study, a new magnetic database is firstly constructed by collecting the datasets from the previous studies [1][2][3][9][10]. Algorithms for carrying on data selection, data pre-processing and transformation, and data mining are designed. The results from this data mining process are then interpreted incorporating with the relevant knowledge in rock magnetism. Comparisons with the results of previous studies are also made.
2
Data Mining Algorithm for Rock
Magnetic Data Analysis
The data mining algorithm designed in this study for searching correlations between susceptibility and magnetite content in rocks consists of three components: data selection, data pre-processing and transformation, and data statistics.
Data selection algorithm (List 1) is a simple iterative procedure which selects all the datasets containing both susceptibility and magnetite values from magnetic database DataStore and then writes them one-by-one into a new data file SelectedData. Data pre-processing and transformation are combined into one algorithm (List 2). For each dataset of a pair <magnetite, Sus> in SelectedData, if
magnetite is in weight percentage (W), then this dataset is directly expanded to four fields <magnetite, Sus, ln(magnetite), ln(Sus)> which are written into a new data file MagnetiteData. If
magnetite is in volume percentage (V), it also means that Sus is in csg rather than SI. This dataset is firstly converted to the same format using Formulae (1) and (2) [10][11]. This converted dataset is expanded to four fields that are then written into MagnetiteData.
V 150 V 250 W + = (1) Sus (SI) = 4πκ(cgs) (2)
To select the datasets stored in DataStore: 1. Make SelectedData empty.
2. For each data entry dataset in DataStore (read in from first to last), repeat: 2.1 If (magnetite∩Sus) > 0:
2.1.1 Add dataset to SelectedData. 3. Terminate.
List 1. Algorithm for selecting datasets from magnetic database DataStore
To pre-process and transform the datasets stored in SelectedData: 1. Make MagnetiteData empty.
2. For each data entry dataset in SelectedData (read in from first to last), repeat: 2.1. If magnetite is in weight percentage (W):
2.1.1. Add <magnetite, Sus> and ln<magnetite, Sus> to MagnetiteData. 2.2. If magnetite is in volume percentage (V):
2.2.1. Convert magnetite and Sus using Formulae (1) and (2).
2.2.2. Add <magnetite, Sus> and ln<magnetite, Sus> to MagnetiteData. 3. Terminate.
The models used for conducting rock magnetic data mining in this study are based on general knowledge in rock magnetism. The more magnetite a rock contains, the higher its susceptibility is [4][11]. In other words, if there is a correlation between magnetite content and susceptibility in rocks, it should be a kind of positive relationship. Therefore, the commonly encountered positive relationships, such as linear, logarithmic, power, and exponential correlations, become the logical options for conducting data mining. For the purpose of data processing, all these correlations can be drawn and tested using a unique linear regression model [12][13]. To use the same linear regression model for data analysis, it is efficient to transform the data in their required format that is already stored in
MagnetiteData.
This linear-regression data mining algorithm is given in List 3. The algorithm first reads all data in four fields from MagnetiteData into four arrays, and then applies LinearRegression to four pairs of magnetite-susceptibility (x-s) combination one by one to search for potential correlation between any of the four pairs. The process may return none at worst to four correlations at most. However, whether a correlation has significance depends on firstly the strength of the relation, which is measured by its correlation coefficient (r), and secondly its consistency with the general knowledge of rock magnetism, which can only be determined by an expert in rock magnetism. The returned results contain not only the correlation and its correlation coefficient (r), but also the number (n) of datasets involved. This is because the correlation coefficient (r) is closely related to the number of datasets used. To analyse the datasets stored in MagnetiteData:
1. Read all datasets in MagnetiteData into SusArray (s), LnSusArray (lns), XrdMagArray (x), and
LnXrdMagArray (lnx).
2. Do LinearRegression on <x, s>: 2.1. If r > 0:
2.1.1. Return n, r and s = a + bx. 2.2. If r≤ 0:
2.2.1. Return “NO MEANINGFUL LINEAR CORRELATION EXISTS!”
3. Do LinearRegression on <lnx, s>: 3.1. If r > 0:
3.1.1. Return n, r and s = a + blnx. 3.2. If r≤ 0:
3.2.1. Return “NO MEANINGFUL LOGARITHMIC CORRELATION EXISTS!”
4. Do LinearRegression on <x, lns>: 4.1. If r > 0:
4.1.1. Return n, r and s = aebx. 4.2. If r≤ 0:
4.2.1. Return “NO MEANINGFUL EXPONENTIAL CORRELATION EXISTS!”
5. Do LinearRegression on <lnx, lns>: 5.1. If r > 0:
5.1.1. Return n, r and s = axb. 5.2. If r≤ 0:
5.2.1. Return “NO MEANINGFUL POWER CORRELATION EXISTS!”
6. Terminate.
List 3. Algorithm for data mining on data file MagnetiteData
3
Rock Magnetic Data Analysis Using
the Data Mining Algorithm
The designed algorithm is used to a magnetic database containing more than 1000 data entries collected from the previous studies [1][2][3][9][10]. There are only 37 datasets being selected after
applying the data selection algorithm to this database. These datasets are then processed using the data pre-processing and transforming algorithm, which generates a new data table with 10-4SI for
susceptibility (s) and weight percentage for magnetite content (x). These new datasets are plotted in Figure 1, along with the regression correlations
resulted from using the data mining algorithm. The details of these correlations are given in Table 1. Four positive correlations are revealed by this data mining algorithm. All four correlation coefficients are greater than the theoretical threshold value of correlation coefficient at a 99% confidence level that is 0.418 for the datasets of 37. This implies that in theory strong linear, power, logarithmic and exponential correlations can be drawn between susceptibility and magnetite content in rocks from this database. Knowledge in rock magnetism is needed to interpret these models and determine which model(s) should be more meaningful in rock magnetism.
The logarithmic correlation in Figure 1 shows the trend of saturation in susceptibility when magnetite content is higher than 10%. This is not consistent with general knowledge of rock magnetism which proves that susceptibility of a rock should have significant increase if its magnetite content increases. Therefore, the logarithmic model is not useful in rock magnetism even if this correlation is statistically strong.
The susceptibility and magnetite content also show a strong linear correlation. In Figure 1 this relation is actually deflects away for both middle and higher contents of magnetite. The higher the magnetite content is, the greater the deflection is. It may only fit to the rocks that contain magnetite
lower than 4%. In general, this correlation offers little assistance in rock magnetism study.
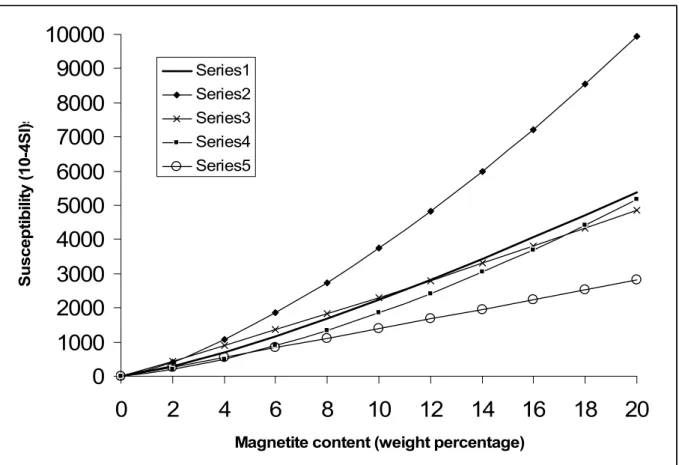
The power model has the strongest correlation (r
= 0.9349) and well fits the datasets in the range of 0.5% - 11% of magnetite (Figure 1). In fact, different forms of power model were also reported in previous studies [1][2][3][10]. It is shown in Figure 2 that the power correlation of this study is very similar to these proposed by Balsley and Buddington [1] and Mooney and R. Bleifuss [2]. All the three correlations are placed below the one proposed by Jahren [3] and above the other given in [10]. Although it is difficult to make judgment on which one would be more accurate in practice, this study at least proves that the power correlation is likely to be a good guide in interpreting rock magnetism data. On the other hand, it is interesting to note that the power model actually returns a very low estimate to susceptibility when magnetite content is higher than 12%. This indicates that adopting different correlations for different ranges of magnetite content may be a more sensible approach in dealing with rock magnetic data. In Figure 1, it is obvious that the exponential correlation fits better than the power model in the range of 8%-15% of magnetite content, even though its correlation coefficient (r = 0.9250) is slightly smaller than that of the power model. Therefore, exponential model is possibly another useful guide for the interpretation of rock magnetic data in a higher range of magnetite content.
s = 378.03x - 754.33 r = 0.7581 s = 1427.9ln(x) - 625.56 r = 0.6982 s = 160.74e0.2657x r = 0.9250 s = 121.56x1.2651 r = 0.9349 0 1000 2000 3000 4000 5000 6000 7000 8000 9000 10000 0 2 4 6 8 10 12 14 16
Magnetite (Weight percentage)
S us ce ptib ility (1 0-4S I) 4
Table 1. Correlations between magnetite content and susceptibility using the proposed data mining algorithm Relation n rα=0.01 r a b Correlation Linear 0.8707 -754.33 378.03 s = -754.33 + 378.03x logarithmic 0.6982 -625.56 1427.9 s = -625.56 + 1427.9lnx Power 0.9349 121.56 1.2651 s = 121.56x1.2651 Exponential 37 0.418 0.9250 160.74 0.2657 s = 160.74e0.2657x
Note: n – number of datasets; rα=0.01 – correlation coefficient at a 99% confidence level; x – magnetite content in weight percentage; s – magnetic susceptibility in 10-4SI.
0
1000
2000
3000
4000
5000
6000
7000
8000
9000
10000
0
2
4
6
8
10
12
14
16
18
20
Magnetite content (weight percentage)
S u sc ep ti bi lit y ( 1 0-4S I) s Series1 Series2 Series3 Series4 Series5
Series 1 – this study; Series 2 – [1]; Series 3 – [2]; Series 4 – [3]; Series 5 – [10] Figure 2. Power correlations proposed in different studies
4
Conclusion
Data mining technique is introduced to rock magnetic data analysis in this study. A data mining algorithm is designed to carry on data selection, pre-processing, transformation, and data mining for rock magnetic data. This algorithm is able to search for linear, power, logarithmic, and exponential correlations that may exist between susceptibility and magnetite content contained in rocks. This algorithm is tested using a new magnetic database containing more than 1000 datasets from previous studies. The results from this data mining process are then interpreted incorporating with the relevant knowledge in rock magnetism.
Although strong linear, power, logarithmic, and exponential correlations are all revealed by this algorithm, the linear and logarithmic models are judged having little significance in rock magnetism study. The reappearance of power correlation is consistent with the results of previous studies, but it may only be useful for rocks containing <11% of magnetite. The new finding of an exponential correlation indicates that adopting different correlations for different ranges of magnetite content may be a more sensible approach in dealing with rock magnetic data. All these speculations need to be proven by future studies.
References
[1] J.R. Balsley and A.F. Buddington, Iron-titanium oxide minerals, rocks and aeromagnetic anomalies of the Adirondack area, New York, Econ. Geol., Vol.53, pp.777–805, 1958.
[2] H.M. Mooney and R. Bleifuss, Magnetic susceptibility measurements in Minnesota: II, Analysis of field results, Geophysics, Vol.18, pp.383–393, 1953.
[3] C.E. h Magnetic susceptibility of bedded iron formation, Geophysics, Vol.28, pp.756–766, 1963. [4] D.H. Tarling and F. Hrouda, The magnetic anisotropy of rocks, Chapman & Hall, 1993.
[5] R.S. Carmichael, CRC handbook of physical properties of rocks, Vol.2, CRC Press Inc., 1982. [6] J.H. Schön, Physical properties of rocks: fundamentals and principles of petrophysics, Handbook of geophysical exploration – seismic exploration, Pergamon, 1996.
[7] M.H. Dunham, Data Mining, Prentice Hall, 2003. [8] G.M. Marakas, Modern data warehousing, mining, and visualization, Prentice Hall, 2003.
[9] D.A. Clark and P.W. Schmidt, Magnetic properties of the banded-iron formations of the Hamersley Group, W.A., AMIRA report 1638, CSIRO Division of Mineral Physics, 1986.
[10] W. Guo, Magnetic petrophysics and density investigations of the Hamersley Province, Western Australia: implications for magnetic and gravity interpretation, PhD thesis, The University of Western Australia, 1999.
[11] R.F. Butler, Paleomagnetism, Blackwell Scientific Publications, 1992.
[12] R.A. Johnson and G.K. Bhattacharyya,
Statistics, Wiley, 1996.
[13] G.A.F. Seber and A.J. Lee, Linear regression analysis, Wiley, 2003.