A Case Study of the Version Editor
David L. Atkins,
Thomas Ball,
Todd L. Graves
and Audris Mockus
University of Oregon
Microsoft Research
Los Alamos National Laboratory
Avaya Labs Research
October 9, 2001
ABSTRACT
Software tools can improve the quality and maintainability of software, but are expensive to acquire, deploy and main-tain, especially in large organizations. We explore how to quantify the effects of a software tool once it has been de-ployed in a development environment. We present an effort-analysis method that derives tool usage statistics and devel-oper actions from a project’s change history (version control system) and uses a novel effort estimation algorithm to quan-tify the effort savings attributable to tool usage.
We apply this method to assess the impact of a software tool called VE, a version-sensitive editor used in Bell Labs. VE aids software developers in coping with the rampant use of certain preprocessor directives (similar to #if/#endif in C source files). Our analysis found that developers were ap-proximately 40% more productive when using VE than when using standard text editors.
Keywords
software tools, version control system, effort analysis
1
Introduction
While software tools have the potential to improve the qual-ity and maintainabilqual-ity of software, acquiring, deploying and maintaining a tool in a large organization can be an expen-sive proposition. We explore how to quantify the effects of a software tool in an ongoing large-scale software project. We describe a case study of the impact of a version-sensitive text editor called VE. We assess the impact using a method that relates tool usage statistics with effort estimates based on analysis of the change history of a software project. The value in performing such an impact analysis is to create data
This work was done while all four authors were members of the Software Production Research Department in Lucent Technologies’ Bell Laboratories.
from which subsequent decisions about the tool use can be made more effectively (e.g., to keep a tool, to deploy it more widely, to reward its use, to publish results that would influ-ence other potential adopters, etc.)
Our work is based on two observations. The first obser-vation is that a major effect of a software tool, be it a docu-mentation tool, source code editor, code browser, slicer, bugger, or memory-leak detector, is to help a developer de-termine how to modify a software entity or directly to aid the developer in making modifications. The second observation is that the change history of a software entity (i.e., the ver-sion control data about the modifications to the entity) can be used to estimate the amount of effort a developer expended on a particular modification or set of modifications, as well as measures of the overall time (interval) taken to develop a software feature. To obtain accurate estimates of tool ef-fects it is often important to have effort estimates at a fine grained change level, however, it is unreasonable to expect that developers could always accurately and efficiently re-port effort for individual changes they commit to a version control system
.
These observations lead to a simple process for assessing the impact of a software tool:
1. Record the tools a developer uses in the course of soft-ware development and the softsoft-ware entities to which they were applied.
2. Relate the monitoring information recorded in step 1 to the modifications to software entities that are recorded by the version control system.
3. Using the data from the previous two steps and the change effort estimation algorithm described in Sec-tion 4, analyze “similar” developers and modificaSec-tions
In Section 4 we introduce an algorithm that estimates effort for individ-ual changes from information available in a version control system.
Section 5 qualifies and quantifies the notions of “similar” developers and modifications.
to estimate how the use/non-use of the tool affected de-veloper effort and overall interval.
We applied these ideas to a real-world example from Lu-cent Technologies. We present a case study of a software tool that provides an elegant solution to the problem of ram-pant use of certain kinds of preprocessor directives (such as
#if/#endifin C source files). These directives typically are used to create many different variants, or versions, from a single source file. A developer editing such files must be careful to make changes to the appropriate version, so as not to interfere with other versions [31]. The solution to this problem is a version-sensitive editor (VE) that hides the pre-processing directives from a developer. VE allows a devel-oper to edit a particular version of the source file (i.e., a view of the underlying ASCII file in which certain preprocessing directives have been “compiled” away). As the user edits this view of the source code, VE translates editing operations on the view back into the underlying source file.
Our primary hypothesis is that the VE tool reduces the effort needed to make changes involving preprocessor di-rectives. Our secondary hypothesis is that the usage of VE would lead to shorter development intervals. We test these hypotheses via a quantitative analysis of developer effort and development interval based on the change history of a very large software product in which both VE and other text ed-itors were used. For each change made to the software, we were able to determine whether or not VE was used to make the change. By combining this information with the devel-oper effort analysis, we found that develdevel-opers who used VE were on average 40% more productive than when using stan-dard text editors (when changing files containing preproces-sor directives). We also found a corresponding decrease in the development interval of new software features.
Through our case study, we illustrate a number of prob-lems that must be solved to arrive at an accurate estimate of how software tools impact developer effort. Primarily, these are problems of how to control for key sources of variation such as:
Developer work-style and experience;
Size of changes to software;
Type of changes (new feature, bug fix, code cleanup, code inspection).
Our work is complementary to the analysis of tools in controlled settings [17, 16, 23] and software tool assess-ment [25, 22, 7]. Controlled experiassess-ments on tool use can yield valuable insights about the utility of a tool on small scale examples; our work seeks to address the ongoing im-pact of a tool in an industrial development environment. Software tool assessment compares various tools to one an-other and attempts to predict the impact of a tool on a project before deployment. Our work complements such assess-ments by providing information on tool impact during de-ployment.
The paper is organized as follows. Section 2 provides background on version control systems and the problem of preprocessor directives in the particular project under study. Section 3 describes the version editor (VE) tool and how it addresses the problem of preprocessor directives. Section 4 summarizes our methodology and algorithm for analyzing version control data in order to estimate the effort expended by developers to make changes. Section 5 presents the re-sults of applying this algorithm to the version control data from a large software system in which VE and other text ed-itors were used. Section 6 describes analyses of VE’s effects on interval and quality. Section 7 considers possible ways to generalize the method. Section 8 discusses related work and Section 9 concludes the paper.
2
Background
The case study here revolves around a commercially suc-cessful multi-million line software product (a large telephone switching system) developed over two decades by more than 5,000 developers. We first present background material on the version control system used by the project and then de-scribe the project-specific versioning problems that led to the creation of the VE tool.
2.1
Version Control System and Data
The extended change management system (ECMS) [19], lay-ered on top of the source code control system (SCCS) [26], was used to manage the source code of the product.
We present a simplified description of the data collected by SCCS and ECMS that are relevant to our study. ECMS, like most version control systems, operates over a set of files containing the text lines of source code. An atomic change, or delta, to the program text consists of the lines that were deleted and those that were added in order to make a change. Deltas are usually computed by a file differencing algorithm (such as Unix diff), invoked by SCCS, which compares an older version of a file with the current version.
ECMS records the following attributes for each change: the file with which it is associated; the date and time the change was “checked in”; and the name and login of the developer who made it. Additionally, the SCCS database records each delta as a tuple including the actual source code that was changed (lines deleted and lines added), login of the developer, MR number (see below), and the date and time of change.
In order to make a change to a software system, a devel-oper may have to modify many files. ECMS groups deltas to the source code recorded by SCCS (over potentially many files) into logical changes referred to as Maintenance Re-quests (MRs). There is one developer per MR. An MR may have an English abstract associated with it that the developer provides, describing the purpose of the change. The open time of the MR is recorded in ECMS. We use the time of
the last delta of an MR as the MR close time. We performed textual analysis of the MR abstracts to infer the purpose of a change [20]. Upon taking out an MR, developers write a short description of the purpose for the change in English. The terms used in such abstracts are classified as pertain-ing to new feature development (NEW), corrective activity (BUG), restructuring/cleanup (CLEANUP), or code inspec-tion (INSPECT). For example, an MR whose abstract con-tains the term “uninitialized variable” is classified as BUG, whereas an abstract containing the term “new feature” is classified as NEW, and an abstract containing “remove old code” is classified as CLEANUP. We classified each MR depending on which terms appear in their abstracts, per the methodology in [20]. In the project, 5% of MRs were done to implement recommendations of code inspection meetings (INSPECT) (containing “code inspection” in their abstract.) The classification was validated in follow-up developer sur-veys.
The INSPECT MRs were separated from the other three types because they differed substantially from other MRs done in this project. First, they were done according to de-tailed prescriptions from code inspection meetings and volved little creativity on the part of the developer (code in-spections MRs are “busy work”, in the words of one devel-oper). Second, they had a large number of deltas (we use this parameter to model the effort in Section 5), but they were not difficult to implement, since the changes were prescribed by a team of developers preparing for and participating in the code inspection meeting. Third, inspection MRs included all recommendations of the code review meeting ranging from bug fixes to improving comments and variable names. Thus, INSPECT MRs are a mixture of bug fixing and cleanup ac-tivity. Consequently, it was essential to separate INSPECT MRs into a distinct class to improve the effort model for this product. Other products might contain few or no INSPECT MRs, thereby simplifying the classification.
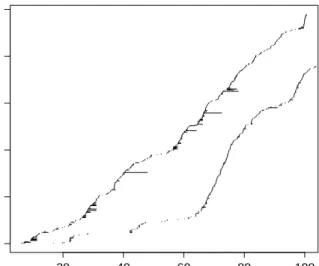
The way developers work on MRs might vary across orga-nizations. We illustrate the work patterns in the considered organization. Figure 1 shows MR intervals for two repre-sentative developers. Each horizontal dash represents one MR. The starting and ending positions of the dash represent the open and close time for the MR. The vertical axis rep-resents cumulative counts of MRs for each developer. Fig-ure 1 shows two distinct styles of work. One developer al-ways closes MRs quickly (curve to the bottom right). The other developer occasionally leaves MRs open up to several months. Most MRs are completed within a week for both developers, which means that the monthly time sheet reports of developers are of an appropriate granularity to track the amount of time developers spend on MRs.
2.2
The #version Problem
The software product in our case study requires the concur-rent development and maintenance of many sequential ver-sions as well as two main variants for domestic and
interna-Months MR number 20 40 60 80 100 0 100 200 300 400 500
Figure 1: MR intervals for two developers.
tional configurations of the product. From a version manage-ment point of view, source code may be common to as many as two dozen distinct releases of the code. Some of these re-leases correspond to deployed products for which only main-tenance changes are made, while others correspond to ver-sions under active development.
The software releases form a version hierarchy with two main variants and chronological release sequences within each of these. Several constraints on the project manage-ment are reflected in the way source changes are made to preserve this hierarchy. First, it is imperative that the new development or maintenance changes made for one software release not impact the previous release in the sequence or any release in the other main variant. Second, it is important that as much commonality of code be preserved as possible: changes made in an earlier release should automatically ap-pear in the later releases in that sequence. In the examples that follow, the two main variant lines are designated as ‘A’ and ‘B’, and the sequential releases within each main line are designated by ascending numbers, e.g., 1A, 2A, 1B, 2B, and so on. To achieve the second objective, most of the source files are shared among the releases, with release specific dif-ferences delineated as described in the following paragraphs. The industrial source code management technology of the early 1980’s did not have good support for branching. That is, there were no tools for maintaining source that was mostly common to many releases but contained some release spe-cific changes, and no tools for automatically merging sepa-rate changes to a common code base. To address the multiple release requirements of the project under study, a specialized directive #version was used to allow for release specific vari-ations in the code, as shown in Figure 2. The #version con-struct permits a single source file to be extracted to produce a different version for each software release. We can think of this construct as a C preprocessor #if directive where only
one Boolean variable is used for control, the variable may be negated, and the variable comes from a restricted set that contains one variable for each software release. Various tools are used to verify the consistent use of these constructs ac-cording to a release hierarchy maintained by the system. For example, the tools guarantee that a change checked in for 5A will not affect the source extraction for 4A or earlier or any of the ‘B’ releases. Tools are also provided to perform the extraction of the source code for building each software re-lease, again according to the version hierarchy. For example, extraction for release 4A implies that the version variables 4A, 3A, 2A, and 1A are true and all other version variables are false.
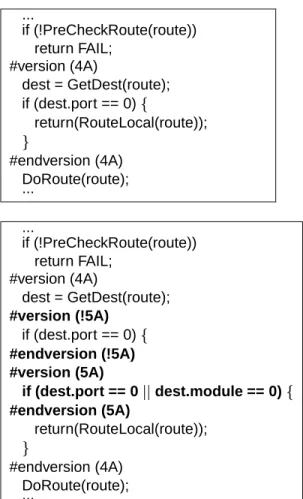
When a developer introduces new code for a release, the new code must be bracketed by a #version construct for the specific release for which the change is targeted. When a de-veloper changes existing code for a release, the existing code must be logically removed with a #version using the negation of the target release, and the change introduced with a #ver-sion for the target release. Figure 2 shows how #ver#ver-sion lines are used to change the expression in an if-then statement for Release 5A. The original if-then statement was code inserted for Release 4A.
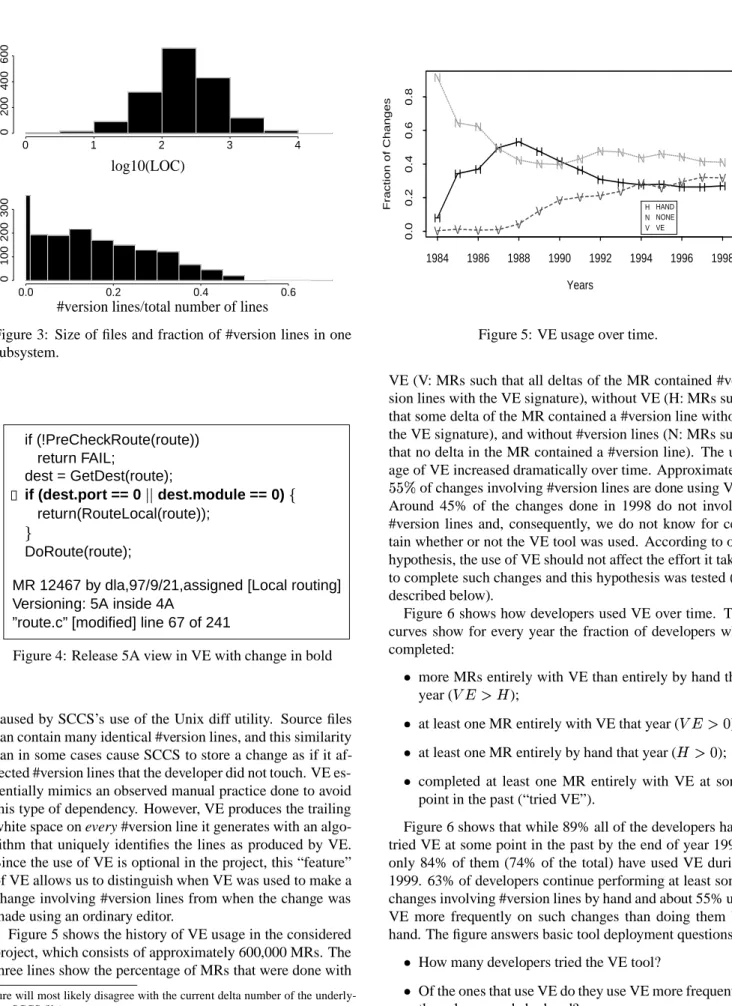
As the example shows, even a one line change to the code requires the developer to add five lines to the file (four con-trol lines and the changed code line). The developer brackets the original line with the negated #version (!5A) control to omit it for release 5A. Then the developer makes a copy of the line and brackets it within #version controls for release 5A. Finally, the change is made to the copied line. The #ver-sion lines also make the source file more difficult to read and understand. Figure 3 illustrates the frequencies of file sizes and the frequencies of the proportion of #version lines to to-tal lines in a file. Data from one subsystem are shown. The average proportion of #version lines to all lines is 14% and the largest proportion is 67%.
3
VE: A Version-sensitive Editor
To make it easier for developers to cope with #version direc-tives, a version-sensitive editor (VE) was made available in the project under consideration [9, 24, 4].
3.1
The VE tool
VE allows the developer to edit in a view that shows only the code that will be extracted for the release being changed. The tool also performs the automatic insertion of any necessary #version lines. For example, the insertion of a new line for release 5A in an area that does not have any release 5A code will automatically produce the required #version around the line. Likewise, a change to a line will automatically produce the #version for the negation of 5A which will exclude the existing line for 5A, and insert the changed line with #ver-sion to include the change for 5A (as in Figure 2).
... if (!PreCheckRoute(route)) return FAIL; #version (4A) dest = GetDest(route); if (dest.port == 0) return(RouteLocal(route)); #endversion (4A) DoRoute(route); ... ... if (!PreCheckRoute(route)) return FAIL; #version (4A) dest = GetDest(route); #version (!5A) if (dest.port == 0) #endversion (!5A) #version (5A) if (dest.port == 0 dest.module == 0) #endversion (5A) return(RouteLocal(route)); #endversion (4A) DoRoute(route); ...
Figure 2: Before and after a Release 5A change. Embold-ened lines are the code added by the programmer.
The developer’s view is of normal editing in the extracted code; VE manages the changes to the #version lines accord-ing to the constraints described in Section 2.2. Figure 4 shows the view presented by VE for the file from Figure 2. In VE, the developer only has to use standard editing com-mands to effect the change to the if-then statement, and VE inserts the required #version directives (behind the scenes). VE behaves like either vi or emacs, the two standard editors used by most of the developers in the project. In fact, the appearance to the developer is that of using the standard edi-tor with the extended behavior of dealing with #version lines automatically.
For this study, a noteworthy aspect of VE is that it leaves a signature on all of the #version control lines that it generates. This signature consists of trailing white space (a combina-tion of space and tab characters) that uniquely distinguishes the control line from any control line generated for any other change. This was done to avoid unwanted dependencies
In fact, the trailing spaces and tabs encode the current delta number in the underlying SCCS file. As a result, even if developers copy VE-generated #version lines using an ordinary text editor, we can determine that this was a hand change with high probability (because the delta number of the
signa-0 1 2 3 4 0 200 400 Counts 600 log10(LOC) 0.0 0.2 0.4 0.6 0 100 200 Counts 300
#version lines/total number of lines
Figure 3: Size of files and fraction of #version lines in one subsystem. if (!PreCheckRoute(route)) return FAIL; dest = GetDest(route); if (dest.port == 0 dest.module == 0) return(RouteLocal(route)); DoRoute(route);
MR 12467 by dla,97/9/21,assigned [Local routing] Versioning: 5A inside 4A
”route.c” [modified] line 67 of 241
Figure 4: Release 5A view in VE with change in bold
caused by SCCS’s use of the Unix diff utility. Source files can contain many identical #version lines, and this similarity can in some cases cause SCCS to store a change as if it af-fected #version lines that the developer did not touch. VE es-sentially mimics an observed manual practice done to avoid this type of dependency. However, VE produces the trailing white space on every #version line it generates with an algo-rithm that uniquely identifies the lines as produced by VE. Since the use of VE is optional in the project, this “feature” of VE allows us to distinguish when VE was used to make a change involving #version lines from when the change was made using an ordinary editor.
Figure 5 shows the history of VE usage in the considered project, which consists of approximately 600,000 MRs. The three lines show the percentage of MRs that were done with
ture will most likely disagree with the current delta number of the underly-ing SCCS file). H H H H H H H H H H H H H H H N N N N N N N N N N N N N N N V V V V V V V V V V V V V V V Years Fraction of Changes 1984 1986 1988 1990 1992 1994 1996 1998 0.0 0.2 0.4 0.6 0.8 H HAND N NONE V VE
Figure 5: VE usage over time.
VE (V: MRs such that all deltas of the MR contained #ver-sion lines with the VE signature), without VE (H: MRs such that some delta of the MR contained a #version line without the VE signature), and without #version lines (N: MRs such that no delta in the MR contained a #version line). The us-age of VE increased dramatically over time. Approximately
of changes involving #version lines are done using VE. Around 45% of the changes done in 1998 do not involve #version lines and, consequently, we do not know for cer-tain whether or not the VE tool was used. According to our hypothesis, the use of VE should not affect the effort it takes to complete such changes and this hypothesis was tested (as described below).
Figure 6 shows how developers used VE over time. The curves show for every year the fraction of developers who completed:
more MRs entirely with VE than entirely by hand that
year ( );
at least one MR entirely with VE that year (!"$# );
at least one MR entirely by hand that year (%$# );
completed at least one MR entirely with VE at some point in the past (“tried VE”).
Figure 6 shows that while 89% all of the developers have tried VE at some point in the past by the end of year 1999, only 84% of them (74% of the total) have used VE during 1999. 63% of developers continue performing at least some changes involving #version lines by hand and about 55% use VE more frequently on such changes than doing them by hand. The figure answers basic tool deployment questions:
How many developers tried the VE tool?
Of the ones that use VE do they use VE more frequently than change code by hand?
Years & Fraction 1986 1988 1990 1992 1994 1996 1998 0.0 0.2 0.4 0.6 0.8 1.0 VE>H ' VE>H ' VE>H ' VE>0 ' VE>0 ' VE>0 ' H>0 H>0 H>0 Tried VE ( Tried VE ( Tried VE (
Figure 6: Fraction of developers using VE over time.
How many never change #version lines by hand? The population that has not tried the tool (20%) needs to know about tool’s existence and may require training. People who have tried it but don’t use it any more (10%) and people who make changes by hand more frequently than using VE (20%) should be surveyed to find if there are problems with VE or if new features have to be added.
3.2
Anecdotal Evidence of the Effectiveness of
VE
The statistical study in the next section shows an increase in productivity of developers when VE is used to make changes, but cannot point to what aspect of the tool is re-sponsible for this improvement. However, comments from users of the tool suggest that the productivity improvement is due to the reduction of effort that is required when manu-ally coding #version lines to make changes.
One developer reported having to make a conceptually simple change that was nearly impossible to make without VE. The change required the renaming of a symbol in a source file. Since the file had many #version lines and the change had to be made for one version without affecting any of the others, making the change meant manually determin-ing each occurrence of the symbol that extracted for the tar-get version. If the line was already within the desired #ver-sion construct, then the symbol could simply be changed. If not, then the existing line would have to be “versioned out” for the target version, and a copy of the line with the change “versioned in” (akin to the change made in Figure 2). Since there were nearly a hundred occurrences of the symbol, ex-amining each one to determine if it needed to be changed and then determining how it should be changed would not only be extremely time consuming, but also error prone. With VE, the developer could set the view to the extracted version
and simply give one global substitute command to change all the occurrences of the symbol. VE guaranteed that the proper #version directives were inserted automatically, thus reducing the task to a matter of minutes.
Other developers reported that the automatic handling of #version constructs prevented them from producing incorrect or corrupted #version constructs, which often occurred with manual editing and required significant time to track down and fix.
Users also reported that aside from the automatic inser-tion of #version constructs, the ability of VE to display the extracted view in the editor made it much easier to under-stand the code in a file with complex #versioning and locate the lines that needed to be changed. ECMS provides com-mands for performing extraction to be able to see the code as the compiler sees it. However, in a heavily #versioned file, there may be many similar or identical lines that are tar-geted for separate versions, and locating which of the lines are relevant to the version needing to be changed can require significant effort.
Some experienced developers reported that having a tool perform the #version work automatically resulted in far fewer questions from less experienced developers about how to code #version lines correctly. This suggests that the less experienced developers are able to be much more productive with VE. In addition, the consulting work load on the experi-enced developers is reduced, although that effect is difficult to measure directly.
4
Developer Effort Estimation
Since VE leaves a visible signature in the version history, all the necessary data are in place for measuring how helpful VE can be to developers. We hypothesize that when making changes involving #version lines, developers are more effec-tive when using VE than when using standard text editors. In this section we describe a general methodology, introduced in [13], for measuring the influence of various factors on the effort required to make a change, using the change history of a version control system and periodic time sheet data. In Section 5, we apply this methodology to the problem of mea-suring the effect of the VE tool.
In principle, if measurements of effort for each change completed by developers were available, we could fit a re-gression model such as
*)effort+-,/.
DEV 021 TYPE 0 Size3
024 TOOL (1) in order to obtain estimates of the effects on effort of the following variables:
DEV: developer identity;
TYPE: type of change, which ranges over the values NEW, BUG, CLEANUP, INSPECT (see Section 2.1);
Jan Feb Mar Apr Total
Effort for MR A ? ? ? ? ??
Effort for MR B 0 ? ? 0 ??
Effort for MR C 0 0 ? ? ??
reported effort 1.0 1.0 1.5 1.0
Table 1: Data available in effort estimation problem, for a single developer.
Size: size of change, which is the number of deltas in an MR;
TOOL: use or non-use of VE, which ranges over the values VE, HAND, NONE (NONE means the change did not contain any #version lines).
Previous work [13, 14, 29] discusses which variables are im-portant to include in the model. The size of an MR can be measured by the number of lines added, or by the number of deltas. The number of deltas is usually a better predic-tor because it is less likely to contain outliers, as some MRs changed or introduced abnormally large numbers of lines. Although there are several types of changes (TYPE), typ-ically only the repair activity (BUG) exhibits significantly different properties because repairs may require a lot of ef-fort but, in the end, may affect only one line in one file. Tool usage (TOOL) has three possible values, as we want to con-trast changes done exclusively using the tool (VE) to changes done by hand (HAND) and to the control set of changes where no #version lines were present (NONE).
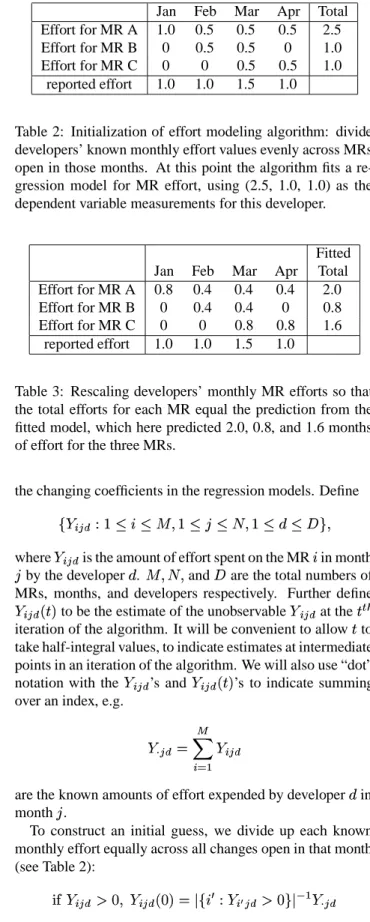
Unfortunately, version control systems do not record mea-surements of developer effort, so our algorithm makes use of monthly time sheet data instead. This algorithm, as shown in [14], is an example of the Expectation-Maximization (EM) algorithm [11]. The EM algorithm is widely used in statistics for the purpose of maximum likelihood estimation in the presence of missing data. Table 1 illustrates, for a single developer, the available data. Rows in the table corre-spond to changes completed by the developer, and columns to months, so that each cell in the table is the amount of ef-fort the developer devoted to a particular change in a given month. Monthly time sheet data record the sums of the en-tries in each column: how much total effort a developer ex-pended in a month. We also know which changes a developer worked on during each month, and a developer’s total effort needs to be divided across these changes.
The row sums, if we knew them, would be effort mea-surements for each change, and we could use regression to relate these measurements to quantities such as the size of the change or whether the tool was used. The idea behind the algorithm is to begin with a guess at the change efforts and alternately use regression models and the time sheet data to refine our initial guess. In the process we will refine our understanding of the factors that affect change effort through
Jan Feb Mar Apr Total Effort for MR A 1.0 0.5 0.5 0.5 2.5 Effort for MR B 0 0.5 0.5 0 1.0 Effort for MR C 0 0 0.5 0.5 1.0
reported effort 1.0 1.0 1.5 1.0
Table 2: Initialization of effort modeling algorithm: divide developers’ known monthly effort values evenly across MRs open in those months. At this point the algorithm fits a re-gression model for MR effort, using (2.5, 1.0, 1.0) as the dependent variable measurements for this developer.
Fitted Jan Feb Mar Apr Total Effort for MR A 0.8 0.4 0.4 0.4 2.0 Effort for MR B 0 0.4 0.4 0 0.8 Effort for MR C 0 0 0.8 0.8 1.6
reported effort 1.0 1.0 1.5 1.0
Table 3: Rescaling developers’ monthly MR efforts so that the total efforts for each MR equal the prediction from the fitted model, which here predicted 2.0, 0.8, and 1.6 months of effort for the three MRs.
the changing coefficients in the regression models. Define 6587:9<;>=@?ACB-A$DFEG?AIHJA KLEG?A M*AON
E
where5P7:9<; is the amount of effort spent on the MRB in month H by the developerM . DFEQKLE andN are the total numbers of MRs, months, and developers respectively. Further define 587:9<;R)TSU+ to be the estimate of the unobservable5V7W9<; at theSYX[Z iteration of the algorithm. It will be convenient to allowS to take half-integral values, to indicate estimates at intermediate points in an iteration of the algorithm. We will also use “dot” notation with the 5 7:9<; ’s and5 7:9<; )TSU+’s to indicate summing over an index, e.g.
5]\9<; , ^ _ 7` 5 7W9<;
are the known amounts of effort expended by developerM in monthH .
To construct an initial guess, we divide up each known monthly effort equally across all changes open in that month (see Table 2): acb 5d7W9<;e #fEg5d7W9<;R)h#i+g,"WjBlkP=i587mc9<;$# :n 5 \9<;
Then repeat the following four steps for each iterationSe, #fEo?E<pfEGqoqGq until convergence:
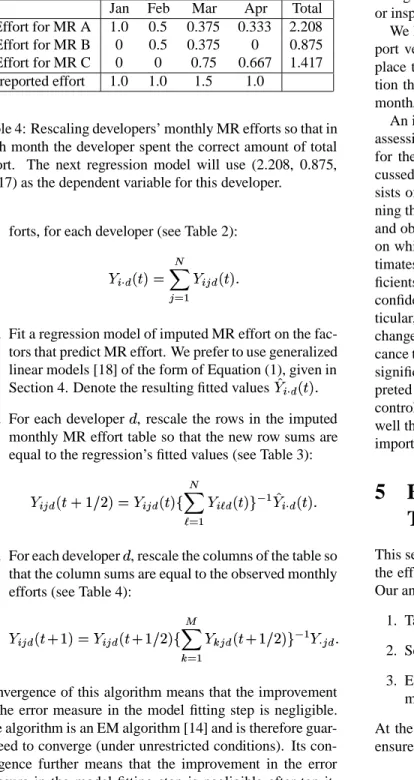
ef-Jan Feb Mar Apr Total Effort for MR A 1.0 0.5 0.375 0.333 2.208 Effort for MR B 0 0.5 0.375 0 0.875 Effort for MR C 0 0 0.75 0.667 1.417
reported effort 1.0 1.0 1.5 1.0
Table 4: Rescaling developers’ monthly MR efforts so that in each month the developer spent the correct amount of total effort. The next regression model will use (2.208, 0.875, 1.417) as the dependent variable for this developer.
forts, for each developer (see Table 2):
5 7\; )TSU+g,sr
_
9Q`
5 7:9<; )TSU+tq
2. Fit a regression model of imputed MR effort on the fac-tors that predict MR effort. We prefer to use generalized linear models [18] of the form of Equation (1), given in Section 4. Denote the resulting fitted values5u7\; )TSU+tq 3. For each developer M , rescale the rows in the imputed
monthly MR effort table so that the new row sums are equal to the regression’s fitted values (see Table 3):
5d7W9<;R)[Swvx?zy{p+V,|587:9<;R)TSU+} r _ ~ ` 5d7 ~ ;)TSU+ n u 587\;)TSU+}q
4. For each developerM , rescale the columns of the table so that the column sums are equal to the observed monthly efforts (see Table 4):
5 7W9<; )[Sv?6+V,/5 7W9<; )[Sv?zy{pi+ ^ _ ` 5 9<; )TSv?6yp+ n 5w\9<; q
Convergence of this algorithm means that the improvement in the error measure in the model fitting step is negligible. The algorithm is an EM algorithm [14] and is therefore guar-anteed to converge (under unrestricted conditions). Its con-vergence further means that the improvement in the error measure in the model fitting step is negligible after ten it-erations. After convergence, we report the coefficients in the final regression model.
Since the regression model is necessary for improving our estimates of change effort, it is necessary to make sure that the model includes quantities which are known to be closely related to change effort. We have found that the models should include coefficients which depend on the de-veloper, since variations in developer productivity are often quite large [5, 10]. The model should also include a measure of the size of a change, such as the number of lines changed or the number of deltas making up the change. Whether the
change is a bug fix, new feature development, cleanup effort, or inspection rework, is also important.
We have found that because developers almost always port very nearly one unit of effort per month, one can re-place these reported monthly effort data using the assump-tion that each developer contributes one unit of effort each month, without changing the results substantially.
An important component of the inference methodology is assessing how certain one can be about the values estimated for the coefficients in the final regression model. As dis-cussed in [13], we use the “jackknife” method, which con-sists of removing one developer from the list we used, run-ning the algorithm again, repeating once for each developer, and observing how much the coefficients change depending on which developer is omitted. The jackknife produces es-timates of the standard error of each of the regression coef-ficients. This standard error can then be used to construct confidence intervals for regression coefficients and, in par-ticular, to test hypotheses such as “the tool has no effect on change effort” and to attach measures of statistical signifi-cance to these hypotheses. While statements about statistical significance derived from observational data should be inter-preted with some care, we believe that in this study we have controlled for potential sources of confounding sufficiently well that calculated -values are useful measures of variable importance.
5
Effectiveness of the Version-Editor
Tool
This section investigates whether or not the VE tool reduced the effort needed to make changes involving #version lines. Our analysis proceeds in three steps:
1. Tag each delta and MR with VE signature information; 2. Select a balanced set of developers;
3. Estimate the effect of the VE tool using the effort esti-mation algorithm of the previous section.
At the end of the section we summarize measures taken to ensure the validity of the results.
5.1
Extraction of VE signature for each delta
As described in Section 3, VE leaves a signature in SCCS files because of the trailing white space it inserts after the #version lines. We wrote a program that processed all 27 gigabytes of SCCS records for the software project under consideration and identified three attributes for each delta:
1. number of #version lines;
2. number of #version lines with VE signature; 3. number of #version lines without VE signature.
This information was used to identify the deltas where the usage of VE was not likely to have impact (i.e., those deltas that contain no #version lines), and where the usage should have an impact (presence of #version lines).
As defined in Section 2, an MR typically consists of sev-eral deltas. It is possible that some of the deltas in one MR have a VE signature and others do not. This does not happen frequently: only 1.8% of the MRs had this property in the entire dataset of 600,000 MRs and in the analyzed sample of 3,400 MRs (we selected this sample of MRs by choos-ing a subset of developers as described below). We marked such changes for analysis purposes as made by hand, since according to our null hypothesis (VE does not reduce devel-oper effort for changes involving #version lines) such mark-ing should not have any impact. If, however, VE reduces de-veloper effort, then such marking would only make it more difficult for the VE effect to show up as statistically signifi-cant.
5.2
Developer selection
The variability in project size, developer capability and ex-perience are the largest sources of variability in software de-velopment (see, for example, [5, 10]). The effects of tools and process are often smaller by an order of magnitude. To obtain the sharpest results on the effect of a given tool in the presence of developer variability, it is important to have ob-servations of the same developer changing files both using the tool and performing the work without the aid of the tool. We focused on developers who made substantial numbers of changes requiring modifications of #version lines, both with and without the VE tool. Also it is preferable to con-sider developers that had similar work profiles (i.e., made similar numbers of changes). Given the considerable size of the version history data available, both tasks were easy: we selected developers who made between 300 and 500 MRs in the six year period between 1990 and 1995 and had sim-ilar numbers (more than 40) of MRs done with and without VE. This resulted in a sample of 9 developers. Reducing the number of developers increases the standard error of the estimated coefficients without substantially changing the es-timates.
5.3
Effort drivers
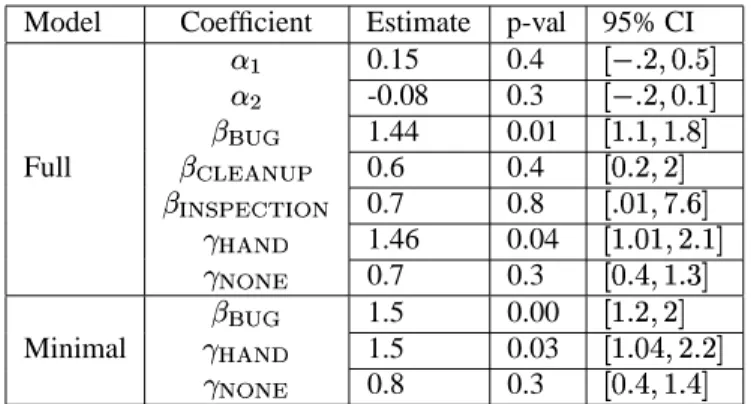
We fitted two models based on Equation 1 (see Section 4), estimated standard errors using the jackknife method, and obtained the following results, as summarized in Table 5. In the first model we included MR measures that our previous experience indicated might affect the effort. We fit the sec-ond model using only a minimal set of predictors that we found significant in the full model. The exact regression for-mulas for each model were:
*)[t PQ+, !fG<iR
0
#lines addedi
0 £R¤ Pd¥O0 £ ¦P0§ 7 ¨ ¥©lª©Y«¬Q6©Y®¯ *)TG diU}+, 1 f 0 £ ¤ dP¥ 0 £ ¦P 0 § 7 ¨ ¥©lª©Y«¬Q6©Y®¯
In these formulas, we use
1 f as a shorthand for t°±>)[²d)BUG+R³ 1 f
+, where ²d)BUG+ is 1 if the MR is a defect fix and 0 otherwise.
The penalty for failing to use VE in the presence of #ver-sion lines is the coefficient£8´¶µ
r¶·
, which indicates an in-crease of about 40% to 50% in the effort required to complete an MR. (This coefficient was statistically significant at the 5% level). Restated, if a developer performs three changes to code involving #version lines in a given amount of time with-out VE, the same developer using VE could perform, on the average, four changes of the same size and type to the same code. At the same time, changes performed using VE were of the same difficulty (requiring a statistically insignificant (?¹¸ £ r»ºwr»¼ ½ p
) increase in effort) as changes with no #version lines at all. There is a large uncertainty in the esti-mated coefficients: the 95% confidence interval for£¾´¶µ
r»· is¿?q#f?Epq?tÀ for the full model (effort savings range between one and 110%) and¿?q#{Á@EpqWp6À for the minimal model (effort savings range between four and 120%).
To get a rough estimate of the total cost savings from the usage of the tool we selected MRs involving VE #version lines for each year VE was used (see Figure 5). We then selected the developers who worked on these MRs and, for each developer, calculated the ratio of VE MRs to the total number of MRs they completed that year to approximate the effort required for VE MRs. To obtain the rough estimate of effort savings we multiplied the estimate of the total VE MR effort by 40% to obtain yearly savings over the years starting from 1991. The estimate of the total effort savings from VE over its entire lifetime is 1400 Person Years (PY) while the total effort to create and maintain the tool over the same time period was below 10 PY.
We were successful in selecting similar developers: the ratio between the largest and smallest developer coefficients was 1.65 for the full model and 1.68 for the minimal model, which would mean that the least efficient developer would require 68% additional effort to make a change compared to the most efficient developer, but the jackknife standard errors indicated that a difference of this size was not large enough to be distinguishable from random fluctuations (i.e. there was no statistically significant evidence that the developers differed). This fact indicates that we were successful in se-lecting “similar” developers for our sample.
The type of a change was a significant predictor of the ef-fort required to make it, as bug fixes were 50% more difficult than comparably sized additions of new functionality. Im-proving the structure of the code, the third primary reason for change (see, for example, [32]) was of comparable diffi-culty to adding new code, as was a fourth class of changes, implementing code inspection suggestions.
The coefficients. and
.
Model Coefficient Estimate p-val 95% CI . 0.15 0.4 ¿c¸qWpE<#fq À . -0.08 0.3 ¿¸qWpEQ#@q?GÀ 18f 1.44 0.01 ¿?q?Eo?qÂzÀ Full 1df{PPP 0.6 0.4 ¿#fqWpEp6À 1@ tf@¡@æ 0.7 0.8 ¿q#f?E}ÄRqÅzÀ £¤ PP¥ 1.46 0.04 ¿?q#f?iE<pq?tÀ £ ¦P 0.7 0.3 ¿#fqÁ@Eo?qÆzÀ 1 f 1.5 0.00 ¿c?iqpfE<pzÀ Minimal £ ¤ PP¥ 1.5 0.03 ¿c?iq#Á@EpqWp6À £ ¦P 0.8 0.3 ¿#fqÁ@Eo?qÁ{À
Table 5: Results from model fitting. CI = confidence interval
from zero in the full model, so the size measures were omit-ted from the minimal model. That is, the size of a change as measured by the number of lines added and number of deltas did not have a particularly strong effect on the effort required to make it, given the developer and the type of change. We believe that the other variables in the model, primarily devel-oper and the purpose of the change, were the primary factors determining the effort spent. While we believe that size is also an important variable, it is determined (to a high degree) by the former two factors. Furthermore, small changes such as MRs are much more uniform in size than large changes like releases or features, so the role of size in determining effort for MRs may be not as important as in case of larger changes.
5.4
Validity of the results
To ensure that the estimated effects were valid, a number of steps were taken.
First, we took a conservative approach (under the null hy-pothesis) to mark all changes that contained a delta with the VE signature and a delta without the VE signature as done by hand.
Second, we selected a balanced set of developers with sim-ilar change profiles to reduce inherent variability in devel-oper performance. This was achieved by choosing develop-ers who were actively changing the code in the considered six year period (1990 to 1995) and making similar numbers of changes (300 to 500) in that period.
Third, we made sure the tool effect would be identifiable from the sample given other key factors affecting the change effort - size, type, and developer. In linear regression, this is referred to as checking for collinearity. Ignoring such rela-tionships could lead to situations where the tool effect would be indistinguishable from other factors affecting change ef-fort.
We first checked for interactions between developers and VE usage. Such interactions occur frequently (developers tend either to use VE or not to use VE). From the set of
de-Coefficient Estimate p-val 95%CI £ ¤ PP¥ 1.5 .04 ¿c?iq#@?EpqWp6À £ ¦P 0.8 0.37 ¿#fq Eo?qÁ{À
Table 6: Results for a model with no type factor.
velopers selected in the second step we chose only those that had similar numbers of changes with and without VE and performed at least 40 changes under each condition. This brought us to the final sample of 9 developers we used in the analysis.
The relationship between the tool usage and the size of a change was insignificant. However, the interaction with the type of change was strong. New code was more likely to be done without VE, while bug fixes were more likely to be done with VE. This interaction confounds the tool effect with a factor known to influence the difficulty of a change. However, this interaction makes it more difficult to find sig-nificant positive effects of VE, since bug fixes require more effort and are more often done using VE.
To verify that the interaction is not affecting the results, we fitted the model with no factor for the type of change. The results are in Table 6. The estimated VE coefficient did not change from the original model in Table 5, but the variance of the estimate increased (indicated by wider con-fidence interval) because of the additional variability caused by not adjusting for the change type factor.
Fourth, we validated the models using the jackknife method. We compared the effect of VE for changes that have similar values of the primary cost drivers (developer, size of change, type of change). These drivers were found to af-fect the effort significantly in [13]. Using the jackknife, we measured the significance of the effects given by the model. More details on validation, the model fitting and the algo-rithm are in [13].
Despite all these checks, the results warrant some caution. Although the selected developers performed similar num-bers of changes with and without VE, the pattern was not independent of time. Eight out of nine developers gradually moved towards exclusive usage of VE, while one abandoned usage of the tool over the considered period. Because of this imbalance, the tool usage factor is confounded with time and other factors such as natural decay of the software architec-ture. Because of the nature of the observational study, other confounding factors might be present despite all the precau-tions taken.
6
Development Interval and Change
Quality
In addition to investigating the impact of VE on the effort expended for single MRs, we investigated the impact of VE
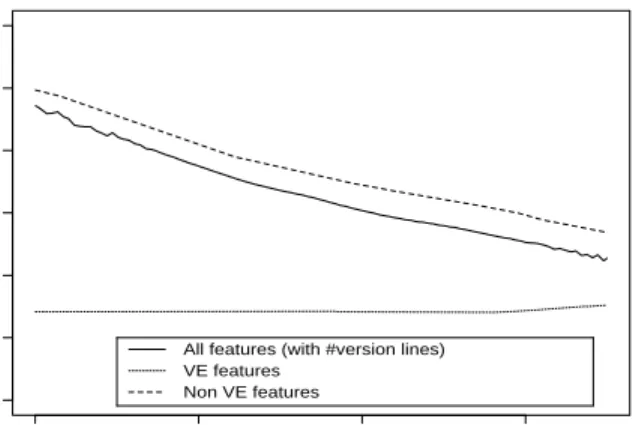
Years & Days 1992 1994 1996 1998 0 100 200 300 400 500 600
All features (with #version lines)
Ç
VE features
'
Non VE features
Figure 7: MR-derived feature interval smoothed over time.
on feature interval and on the quality of the changes.
6.1
Impact of VE on Feature Interval
While MR interval is an important part of an overall devel-opment interval, it is not obvious how to combine individ-ual MR intervals to obtain the total interval for a customer delivery. Consequently, we decided to directly measure the interval for the software features (or work items as they are called in the considered project). The software features are delivered to customers and bring revenue, therefore there is an essential business need to reduce the time it takes to de-velop a feature.
Each feature in the project was related to a set of MRs and deltas. We calculated the interval of each feature as the time between the first and the last delta produced for that fea-ture. Such calculation does not constitute the entire feature interval (which includes work on requirements, design and testing). To calibrate the MR-derived interval we obtained the information on full feature interval for 63 regular fea-tures from two recent releases of the product. The interval was measured between the process steps of “detailed esti-mation completed” and “begin managed introduction” of the corresponding release. The mean of the full interval was 570 days. The median ratio of MR-derived interval to full inter-val was approximately#@qÅ indicating that more than half of full feature interval is captured by the MR-derived interval. These findings are similar to independent estimates made by a product team tasked with reducing interval in the feature releases.
Given that VE reduces effort for individual MRs, it is nat-ural to expect that it would reduce MR interval and, possi-bly, feature interval. To test this hypothesis we compared the MR-derived feature interval for features where VE was
Variable Estimate Std. Error p-value Intercept ( 1 ) 2.94 0.06 È$#fq#f? ³¶ÉÊBYËiÌ ( 1 ) 0.58 0.01 È$#fq#f? VE ( 1 ) -0.46 0.06 È$#fq#f?
Table 7: Feature interval regression.
exclusively used for changes involving #version lines ver-sus the rest of the features involving #version lines. First we excluded features that were started after December 1998, because these features might not be completed yet. We also excluded features that did not modify #version lines and very old features started before 1992, because VE was not exten-sively used then, and feature intervals tended to be longer (see Figure 7), thereby potentially increasing the VE effect. The 436 features where VE was exclusively used had a me-dian MR-derived interval of 149 days and the 2779 other fea-tures had a median MR-derived interval of 442 days. This comparison is slightly biased because the non-exclusively-VE features tended to be larger, their size accounting for the part of the longer interval. Larger and more complex features are done by larger teams and are much less likely to have all participants be exclusive VE users.
To perform a more precise comparison we fitted a re-gression model including feature size in terms of number of deltas. The regression equation:
³ Interval, 1 v 1 ³ Sizev 1 VEv errorE where Interval is measured in days, Size in number of delta and VE is an indicator of whether VE was used exclusively for changes involving #version lines. The size and interval were transformed to make their distribution closer to a Gaus-sian distribution. A computed Í value of #fqÅip indicates a good model fit and the ANOVA table given in Table 7 shows a highly significant impact of the VE tool. For example, a predicted interval for a median sized feature of 137 deltas would take 176 days with VE and 279 days without VE. Us-ing our estimates of the full feature interval we would get approximately a)hpiÄ{Î>¸x?zÄzÅi+<yR?zÄzÅÐϹ#@qÅ2,ÑÆ
i
increase in full feature interval for features that did not exclusively use VE. It is worth noting, that this number is very similar to the estimate of the decrease in individual MR effort.
6.2
Impact of VE on MR Quality
Developers using VE have a simpler view of the source code without the plethora of #version directives. This leads to the hypothesis that VE may reduce the likelihood that a software change would fail after being delivered to the customer.
The project under study has kept the information on all MRs that were delivered to customers as patches or “soft-ware updates”. In each case when a patch failed, a root cause analysis was done and the MRs that caused the fail-ure were identified and recorded (for more detail see [21]).
To evaluate the effect of VE on software update failures, we calculated the fraction of MRs containing #version directives that failed when delivered in software updates, MRs done en-tirely using VE (?iqÁ
i
) and the same fraction for MRs done not entirely with VE (pqÎ{Á
). The difference indicates that VE might reduce the probability that an MR would cause a failure in a software update.
We then applied a more rigorous failure probability mod-eling, as described in [21], but the non-usage of VE was not a significant predictor that an MR would cause a software update to fail. However, VE might affect that probability in-directly because the features with exclusive use of VE tend to be smaller (have fewer deltas, add fewer lines, and touch fewer subsystems) and the size of an MR is an important predictor of its failure probability (with larger MRs having higher probability to fail).
7
Software Tool Evaluation Scenarios
In this section, we consider how to generalize the process used in our case study to other software development envi-ronments and software tools.
In our case study, the effort analysis (Sections 4 and 5) made use of generic change data that are present in any mod-ern version control system (as described in Section 2). Thus, the repeatability of our experiment in other settings relies primarily on the ability to correlate tool usage with change history. The particulars of the VE tool provided a very direct link between tool usage and changes, for two reasons:
VE is an editor and is used directly to change software;
VE leaves a trace because of the trailing white space it inserts at the end of #version lines.
Usage of many other software tools can be tracked. Some tools modify only a certain type of source code files. The us-age of a number of tools is monitored for license compliance purpose (recording of who and when used the tool). Finally, it is often relatively easy to instrument the tools to log their usage.
Many software tools, such as debuggers, source code ana-lyzers, profilers, etc., are used to examine and analyze soft-ware source but not to modify it and, consequently, do not leave traces in the source code. This is not terribly prob-lematic, since software tools can be instrumented to record when they are applied to a software entity. To establish re-lationships between tool usage and a change we must rely on temporal locality as a substitute for causality. That is, we must assume that a change made to software entityÌ at time S by developerM is (partially) aided by software tools that de-veloperM applied toÌ (or entities related toÌ ) in some win-dow of time beforeS. This assumption is quite reasonable for many software tools such as error detectors and debuggers, though it may not apply as well to general program com-prehension tools which could be used far before a change is made.
This leads us to the following process:
1. Via automated non-intrusive monitoring, record the tools a developer uses in the course of software devel-opment and the software entities to which they were ap-plied.
2. Correlate the monitoring information recorded in step 1 to the modifications to software entities that are recorded by the version control system, using tempo-ral locality to link the application of a software tool to entityÌ (and related entities) to modifications toÌ . 3. Use the effort analysis algorithm of Section 4 on the
data from steps 1 and 2 to estimate how the use of the tool affected developer effort, code quality, interval, etc. As described in Section 5, it is important to control con-founding variables such as developer experience and type of change in the above process. In other environments, addi-tional variables may come into play.
This approach could be used to evaluate new tools as well as existing tools. To assess the impact of a new tool (or an enhancement of an existing tool) the usage data should be collected from a set of developers who use the tool before the large scale deployment. When the effects of the tool us-age become apparent the tool may be recommended for the wide-scale deployment. The effects should be estimated by comparing the changes done by the developers before and after the introduction of a tool.
The approach should work well for organizations where developers work on a single project at a time until comple-tion. In some organizations the code changes are recorded in the version control system only at the time of comple-tion. In such cases the start of an MR should be recorded as the date of completion of the previous MR done by the same developer. In organizations where developers work on multiple projects simultaneously the approach might require more substantial modifications.
The most important assumption is that the effort a de-veloper spends during a calendar month (or more precisely, the cost of developer to an organization during a calendar month) does not systematically depend on the MR predictor variables used in the model. For example, if we include the type of change in the model, it is important that the total ef-fort spent during months when a developer only fixes defects would not be systematically different from the total effort spent during months when a developer is implementing new features. If this is the case, it is important to collect reliable monthly effort data. Otherwise, the assumption of constant effort per month is sufficient.
In cases where new projects or inexperienced developers are involved, it is important to include calendar time as a pre-dictor in the model to account for developer learning effects. Including calendar time as a predictor is also advisable when there are significant changes in the project during the study period.
In some cases the tools affect the nature of the changes to the source code (for example, when visual environments are used to generate the code). The method proposed here was extended to such more general use of software technology, in particular to assess the impact of the use of application-engineering environments in [30, 3].
8
Related Work
There is a substantial amount of work on evaluating software tools, which falls into three broad categories: controlled ex-periments on software tool use, software tool assessment, and case studies of software tool use. We also review related work on effort estimation in software projects.
8.1
Controlled Experiments on Software Tool
Use
Controlled experiments on software tools typically use two groups to evaluate a tool on a given task: a study group that uses the tool and a control group that does not use the tool. Such experiments have been done on program slicing tools [17], algorithm animation tools [16], and structured ed-itors [23], to name but a few. The study of Ormerod [23] is interesting because of the detailed level of tool instrumenta-tion: a log of all keystrokes entered into a structured editor for Prolog was recorded and used to identify edits, edit times, and errors made. There is a huge body of work in the Human Computer Interaction community that deals with the related issue of user interface design and evaluation. Many such studies evaluate how different user interfaces affect task per-formance [12, 28]. Of course, our study is not a controlled experiment, although we did control for developer variabil-ity (see Section 5). We have analyzed historical project data (time sheet data, and version control data), while controlling for confounding variables.
8.2
Software Tool Assessment
Software tool assessment is an industry of substantial size. As summarized by Poston and Sexton [25], the software tool assessment process consists of the following basic steps:
1. identifying and quantifying user needs; 2. establishing tool-selection criteria; 3. finding available tools;
4. selecting tools and estimating the return on investment; 5. acquiring a tool and customizing it to better fit the
envi-ronment;
6. monitoring of tool usage to determine the impact of a tool.
Many tool assessment processes and standards (such as IEEE Standard 1175) focus on the use of forms to gather data to guide the first five steps of the above process [22, 25]. These include forms for needs analysis, tool-selection cri-teria, tool classification, and to-organization and tool-to-tool relationships. Our work complements such work by addressing the final point (6) above. We use a highly-automated technique combining tool usage information with change effort analysis to estimate the impact of a tool in an organization.
Brown and Wallnau [7] present a framework for evaluating software technology. They observe that “technology evalua-tions are generally ad-hoc, heavily reliant on the evaluation staff’s skills and intuition”. Their framework is based on the idea of “technology deltas”, by which they mean two things: how one tool differs from another, and how the differences between tools address specific needs. In our case study, the “delta” between VE and a standard text editor is the ability to manage #version directives for the developer.
8.3
Case Studies
Kitchenham, Pickard and Pfleeger present a framework and guidelines for performing case studies of software tools and methods [15]. They observe that a case study may be pre-ferred over a formal experiment if the effect of a new tool cannot be identified immediately, which was certainly the case with the VE tool. Our case study made use of historical data to identify the impact of the VE tool over many years of use. Exactly how long one needs to collect data in order to make such an assessment is an open question. If the tool effect is very strong, even a few months may suffice to obtain a statistically significant result, as was shown in [29].
Bruckhaus et al [8] present a case study of how requirements-management tools affected the productivity of requirements planners, across several projects. Their goal was to find which projects would benefit from new tools. In this study, they measured productivity (after the fact) by the ratio of the number of features in a project to total effort ex-pended in the project (number of minutes). They examined how the presence/absence of a tool, project size and software process (simple or complex) affect productivity. Measuring at this macro level makes it difficult to separate the impact of the tool from other confounding variables (such as expe-rience, and size of the feature). Project and process could be included as factors in our model.
8.4
Effort Estimation
Previous work on developing models of effort (of which a recent example is [27]) has dwelt on predicting the effort that will be required to complete a nascent project. The COCOMO model [6] and function points [1] are frequent contributors to these predictions. Our problem is substan-tially different as it works with smaller changes (MRs as op-posed to projects). Also, we derive estimates of the effort
that was required for changes that were part of already com-pleted projects instead of concentrating on prediction.
The work in this paper uses the effort estimation algorithm introduced by Graves and Mockus [13], which relates effort estimates to the size of an MR size and the type of change. They later validated the algorithm theoretically and via sim-ulations [14]. An earlier version of this paper [2] introduced how to use the effort estimation algorithm to evaluate the ef-fect of tool in a development environment. The current paper builds on this previous work by providing a more thorough experimental evaluation and a more detailed explanation of our usage of the effort estimation algorithm. In addition, we performed new experiments to evaluate the effect of VE on interval and quality.
9
Conclusions
We have conducted a detailed analysis of the usage of Bell Labs’ Version Editor (VE) tool based on a new effort estima-tion algorithm that uses version control data and timesheet data. Our analysis found that the VE tool, as used in Bell Labs, has a significant impact on developer productivity. The use of version control data, which is generally available in any software development environment, and the presence of a tool “witness” in this data allowed for a fine-grained anal-ysis of tool usage spread over a number of tool users. The methodology presented here can be (and has been) applied to other settings, but care must be taken to control for con-founding variables, which can vary with the setting.
Acknowledgments
This research was performed when Dr. Graves was with the National Institute of Statistical Sciences and Bell Labora-tories and Dr. Ball was with Bell LaboraLabora-tories. We thank all reviewers for their insightful suggestions. This research was supported in part by grants SBR-9529926 and DMS-9208758 to the National Institute of Statistical Sciences.
References
[1] A. J. Albrecht and J. R. Gaffney. Software function, source lines of code, and development effort prediction: a software science validation. IEEE Trans. on Software
Engineering, 9(6):638–648, 1983.
[2] D. Atkins, T. Ball, T. Graves, and A. Mockus. Us-ing version control data to evaluate the effectiveness of software tools. In 1999 International Conference
on Software Engineering, pages 324–333. ACM Press,
1999.
[3] D. Atkins, A. Mockus, and H. Siy. Measuring technol-ogy effects on software change cost. Bell Labs
Techni-cal Journal, 5(2):7–18, April–June 2000.
[4] D. L. Atkins. Version sensitive editing: Change his-tory as a programming tool. In Proceedings of the
8th Conference on Software Configuration Manage-ment (SCM-8), pages 146–157. Springer-Verlag, LNCS
1439, 1998.
[5] V. Basili and R. Reiter. An investigation of human factors in software development. IEEE Computer,
12(12):21–38, December 1979.
[6] B. Boehm. Software Engineering Economics. Prentice-Hall, 1981.
[7] A. Brown and K. Wallnau. A framework for evaluat-ing software technology. IEEE Software, pages 39–49, September 1996.
[8] T. Bruckhaus, N. Madhavji, I. Janssen, and J. Henshaw. The impact of tools on software productivity. IEEE
Software, pages 29–38, September 1996.
[9] J. O. Coplien, D. L. DeBruler, and M. B. Thompson. The delta system: A nontraditional approach to soft-ware version management. In International Switching
Symposium, March 1987.
[10] B. Curtis. Substantiating programmer variability. In
Proceedings of the IEEE 69, July 1981.
[11] A. P. Dempster, N. Laird, and D. B. Rubin. Maxi-mum likelihood from incomplete data via the em algo-rithm. Journal of the Royal Statistical Society B, 39:1– 38, 1977.
[12] H. Gottfried and M. Burnett. Programming complex objects in spreadsheets: An empirical study compar-ing textual formula entry with direct manipulation and gestures. In Proceedings of the Seventh Workshop on
Empirical Studies of Programming. Ablex Publishing
[13] T. L. Graves and A. Mockus. Inferring change ef-fort from configuration management data. In Metrics
98: Fifth International Symposium on Software Met-rics, pages 267–273, Bethesda, Maryland, November
1998.
[14] T. L. Graves and A. Mockus. Identifying productiv-ity drivers by modeling work units using partial data.
Technometrics, 43(2):168–179, May 2001.
[15] B. Kitchenham, L. Pickard, and S. L. Pfleeger. Case studies for method and tool evaluation. IEEE Software, pages 52–62, July 1995.
[16] A. Lawrence, A. Badre, and J. Stasko. Empirically evaluating the use of animations to teach algorithms. In Proceedings of the 1994 IEEE Symposium on Visual
Languages, pages 48–54, October 1994.
[17] J. Lyle and M. Weiser. Experiments on slicing-based debugging tools. In Proceedings of the First Workshop
on Empirical Studies of Programming, (June 1986).
Ablex Publishing Co., 1986.
[18] P. McCullagh and J. A. Nelder. Generalized Linear
Models, 2nd ed. Chapman and Hall, New York, 1989.
[19] A. K. Midha. Software configuration management for the 21st century. Bell Labs Technical Journal, 2(1), Winter 1997.
[20] A. Mockus and L. G. Votta. Identifying reasons for software changes using historic databases. In
Inter-national Conference on Software Maintenance, pages
120–130, San Jose, California, October 11-14 2000. ACM press.
[21] A. Mockus and D. M. Weiss. Predicting risk of soft-ware changes. Bell Labs Technical Journal, 5(2):169– 180, April–June 2000.
[22] V. Mosley. How to assess tools efficiently and quanti-tatively. IEEE Software, pages 29–32, May 1992. [23] T. Omerod and L. Ball. An empirical evaluation of
TEd, a techniques editor for prolog programming. In
Proceedings of the Sixth Workshop on Empirical Stud-ies of Programming. Ablex Publishing Co., 1996.
[24] A. Pal and M. Thompson. An advanced interface to a switching software version management system. In Seventh International Conference on Software
En-gineering for Telecommunications Switching Systems,
July 1989.
[25] R. Poston and M. Sexton. Evaluating and selecting test-ing tools. IEEE Software, pages 33–42, May 1992. [26] M. Rochkind. The source code control system. IEEE
Trans. on Software Engineering, 1(4):364–370, 1975.
[27] M. Shepperd and C. Schofield. Estimating software project effort using analogies. IEEE Trans. on Software
Engineering, 23(12):736–743, November 1997.
[28] B. Shneiderman. Designing the User Interface (2nd
Edition). Addison-Wesley, 1991.
[29] H. Siy and A. Mockus. Measuring domain engineering effects on software coding cost. In Metrics 99: Sixth
International Symposium on Software Metrics, pages
304–311, Boca Raton, Florida, November 1999. [30] H. Siy and A. Mockus. Measuring domain engineering
effects on software coding cost. In Metrics 99: Sixth
International Symposium on Software Metrics, pages
304–311, Boca Raton, Florida, November 4–6 1999. [31] G. Snelting. Reengineering of configurations based
on mathematical concept analysis. ACM Transactions
on Software Engineering and Methodology, 5(2):146–
189, April 1996.
[32] E. B. Swanson. The dimensions of maintenance. In
2nd Conf. on Software Engineering, pages 492–497,