Improving Vehicle Diagnostics through Wireless
Data Collection and Statistical Analysis
Mathias Johanson
Alkit Communications ABSweden [email protected]
Lennart Karlsson
Department of Computer Aided Design Luleå University of Technology
Luleå, Sweden [email protected] Abstract— Collection and analysis of diagnostic data from
electronic control units is of paramount importance in the automotive industry, both from a life cycle support perspective, and as a tool in the product development. For pre-series test vehicles, access to diagnostic data is crucial in order to be able to track problems as early as possible in the development process, preventing serious faults to pass undetected into production vehicles. However, systematic collection of diagnostic data from test vehicles is complicated by the fact that pre-series vehicles are frequently unavailable for diagnostic read-outs, while away on test expeditions in rural areas, or being otherwise inaccessible. In response, we propose a system for wireless read-out of diagnostic data, based on an embedded system installed in the test vehicles and a server component at the automotive company. Moreover, we present a number of computer-based tools for statistical analysis of diagnostic trouble codes, to aid engineers in processing the potentially very large amount of diagnostic data generated by the automated collection system. We strongly believe that wireless diagnostic collection systems, in combination with statistical analysis tools, will be a key component in meeting future demands on reduced development time, while the complexity of automotive electronics continue to grow. Initial results from our pilot trials with the tools described in this paper support this claim.
Keywords- Diagnostic troble code analysis; Vehicle diagnostics; Wireless communication
I. INTRODUCTION
Due to the rapidly growing complexity of electronic control systems in modern vehicles, testing and verification of components becomes increasingly important [1, 2]. To some extent this challenge can be met through virtual product development techniques and simulation, but there will always be a need for collection of measurement data about real components and systems, being operated under realistic conditions. In the automotive industry, the need for verification of the functionality and quality of products does not end when the product is sold; on the contrary, this is an important part of the service and maintenance agreement. For this purpose, diagnostic functions are built into the electronic control units (ECU), making it possible to access diagnostic data when cars are brought in for service. Typically, authorized repair shops has access to software tools developed by the car manufacturer for reading diagnostic trouble codes (DTC) from the CAN bus
of vehicles. These software tools can convert DTCs into comprehensible textual descriptions of hardware and software malfunctions, assisting the mechanic in troubleshooting a faulty vehicle. The diagnostic data can then also be uploaded to the car manufacturer's database over the Internet or using dial-up connections. Statistical analysis of collected diagnostic trouble codes is important in order to monitor the quality of components and subsystems, to prioritize in which order problems should be addressed, and to find correlations between different faults, or correlations between faults and the operating environment.
In an effort to track problems earlier in the development phase of a new car model, it has been suggested that collection of diagnostic data from test vehicles and pre-series vehicles, in different stages of the development cycle, can be utilized in a more systematic way. However, systematic diagnostic read-outs from test vehicles is typically cumbersome to administer, since the vehicles are often away on testing expeditions in remote rural areas, or being operated by taxi companies, etc, and cannot easily be brought to an authorized repair shop for the sole purpose of reading out diagnostic data. In response, we propose a system for automated wireless acquisition of diagnostic data from test vehicles, based on an embedded system installed in the car, a wireless network, and a server component connected to the diagnostics database at the car manufacturer. With the advent of almost universal access to wireless mobile data networks, such as GPRS or 3G networks, the accessibility of data from vehicles can be improved considerably. This can be helpful not only for large scale collection of diagnostic data from test vehicles, but it can also be of great value as a tool for solving problems with specific cars in real time. Consider for instance a test vehicle in a remote rural area, that has suffered from an engine malfunction due to a software error in the engine control module (ECM). Instead of having to send a qualified engineer to the remote location in order to troubleshoot the problem, it might be possible to get an online wireless connection with the ECM, read out diagnostic data, do the necessary troubleshooting, and possibly even upload a new software version to the ECM, so that the driver can continue the testing expedition.
In this paper, we present a wireless diagnostic read-out system that we have developed together with Volvo Car Corporation, and integrated with their existing systems for
aftermarket diagnostics. The system is useful both for large-scale collection of diagnostic data, and for online diagnostics of specific cars.
In addition to the wireless diagnostics system itself, we have developed a number of tools and methods for statistical analysis of diagnostic trouble codes. The rationale for this is that when a wider scoop for collection of diagnostic data is implemented, better tools and methods for analysis of the data will be required, in order to give the desired effects on improved quality control and, ultimately, reduced development time.
The rest of this paper is outlined as follows: An overview of the wireless diagnostic read-out system is presented in section II. In section III, the methods and tools for statistical analysis of diagnostic trouble codes are described, and in section IV, a pilot study of the system is presented. Section V contains a discussion of the potentials we see with the new technology, and section VI summarizes our conclusions and outlines future work.
II. OVERVIEW OF THE SYSTEM
The overall architectural design of the wireless diagnostic read-out system has been governed by an ambition to put as little intelligence as possible into the cars. The reason for this decision is twofold: Firstly, in order for the system to be scalable to a large number of vehicles, the units installed in the cars must be reasonably inexpensive. Secondly, having the same software configuration in all units makes it much easier to administer the system; hence, all the units are the same, irrespective of the configuration of the car they are installed in and other concerns.
Another design goal decided on early in the development, which is reflected in the system architecture, is the desire to have one diagnostics system for both production and pre-production vehicles. This design choice motivated the integration of an existing diagnostics system with the wireless diagnostic read-out (DRO) system described here.
The wireless DRO system is based on the following main components:
i) VIDA: a diagnostic read-out system developed for use in aftermarket diagnostics. The VIDA system is currently in use in authorized Volvo repair shops around the world. It supports upload of diagnostic trouble codes to a central database at Volvo Car Corporation, using a web service interface.
ii) A custom built dynamically linked library (DLL), implementing a protocol for tunneling Controller Area Network (CAN) frames over an Internet connection. The DLL follows an application programming interface (API) that VIDA uses when reading and writing CAN frames to a CAN device.
iii) A small, robust embedded computer running the Linux operating system. The embedded computer is equipped with a GPRS modem, CAN interfaces and digital i/o. It is installed in a car, connected to the CAN buses of the car, relaying CAN frames over a GPRS Internet connection between the CAN buses and the DRO system VIDA running on a remote server.
The hardware units intended for installation in cars are hereafter referred to as mobile units.
iv) A server component that handles incoming connections from the mobile units, and dispatches the read-out requests to a server that performs the actual DRO. This component is hereafter referred to as the dispatcher.
A. The wireless read-out process
A wireless DRO session is manually initiated through the use of a trigger button connected to the mobile unit in the car. The need for manual involvement is dictated by two circumstances: Firstly, DRO cannot be performed on Volvo cars unless the car has the ignition key in position II. Secondly, due to safety concerns DRO is not allowed to take place while the car is in motion. For these two reasons, it was deemed necessary that the user (typically the driver of the car) puts the car in key position II, pushes a button, waits until the system signals that the read-out is complete, and then shuts off the system by pressing the button again. When a DRO session is thus initiated, an Internet connection is established through the GPRS modem, and an encrypted TCP connection is set up to the dispatcher, which runs on a server with a public IP address, reachable from the mobile units. The dispatcher authenticates the connection using RSA authentication, launches a new process to handle the request, and then continues to listen for new connection requests. The process launched, redirects the request to the first available VIDA station, where VIDA is launched, and remote diagnostic read-out is initiated.
The diagnostic read-out process is defined by a number of scripts tailored to select the appropriate diagnostic CAN messages, depending on the configuration of the particular car being read out. To find out the car's configuration, the globally unique vehicle identification number (VIN) is first read. After that, the car's complete configuration and status can be looked up in a database. Since this is done at the server side of the system, and not by the mobile unit, there is no need for the mobile unit to know anything about the car it is installed in, which is a huge advantage in terms of software maintenance. When the DRO scripts have access to the car's configuration, the specific diagnostic CAN messages are sent to the mobile unit, which relays them onto the CAN bus in the car, assembles the result and sends it back to the server. Since all Volvo cars have two CAN buses , the system must keep track of which message is to go on which bus. Moreover, the system must filter out only the frames pertaining to the specific diagnostic read-out, since the GPRS bandwidth is way to low to support relaying of all the traffic from the CAN buses. This filtering is performed using the CAN identifiers. For timing reasons, the mobile unit must also be knowledgeable of the higher level transport protocol used on top of CAN, which for most cars used in the present work is ISO15765-2 [3]. (Volvo uses two different diagnostic protocols on CAN, one is based on the standard ISO15765, and the other is a proprietary protocol.)
When all diagnostic CAN messages have been passed between VIDA and the car, the mobile unit disconnects the Internet connection and terminates. Two LEDs are used to keep the user informed of the progress. A blinking green LED indicates that the system is relaying data across the network,
and a red LED is used to signal errors. When the DRO session is finished, the LED indicator goes from blinking to steady green or red light (depending on whether the read-out was successful or not), after which the user switches the system off.
When the communication with the car is terminated, VIDA assembles the diagnostic responses into an XML file, compresses the file, and uploads it to the DRO database at Volvo Car Corporation, using a web service interface.
B. The mobile unit
The hardware unit installed in the cars is based on a data logger platform from Ipetronik called M-log [4]. The M-log is an embedded computing platform built around the Geode processor from AMD. One of the main reasons the M-log was chosen as the platform for the mobile unit is because it is capable of running a Linux kernel. The Linux operating system provides a very powerful, yet lightweight, execution environment for the wireless DRO application, and facilitates rapid prototyping, easy debugging and effortless porting of the application. The M-log is also an ideal choice due to its powerful i/o capabilities, its robustness and small size. (On the negative side, it can be considered somewhat excessively powerful compared to what is strictly needed, conflicting slightly with the idea of having a rather simple and inexpensive unit in the cars.)
The mobile unit is powered by 12V through the J1962 connnector in the car, where it also gets access to the two CAN buses of the car. The digital i/o ports of the M-log are used for driving the red and green LEDs used for communicating status information to the user. The trigger switch simply powers the unit on and off.
An external GPRS modem is connected to the serial port of the M-log, providing Internet access through a commercial wireless Internet provider. The IP address of the mobile unit is dynamically configured at connection time using DHCP. Since it is not guaranteed that the same IP address is configured each time the unit is connected, the system is designed in a way where all communication sessions are initiated from the mobile unit. (The Internet provider used for the pilot did not even provide a public IP address for its connected DHCP clients, but rather a private RFC 1918 address, using NAT translation, making it absolutely necessary for all TCP connections to be originated at the mobile units.)
As previously discussed, all mobile units have the same software installed, and no individual configuration is necessary. To help keep the software up to date, an automated software update mechanism is implemented. When a new version of the mobile unit's software is released, the new software package can be published on a server, from which it is automatically downloaded and installed by the mobile units, when they connect to perform diagnostic read-out.
C. Data integrity and security concerns
An RSA-based authentication mechanism is employed when the mobile units connect to the dispatcher. This prevents malicious clients to connect to the system and upload bogus data. Furthermore, all communication between the endpoints is
encrypted using 128-bit Blowfish encryption, protecting it against illicit eavesdropping. The Blowfish algorithm was selected due to its strong encryption and low CPU requirements.
Since the mobile units are connected to the Internet using a private (RFC 1918) IP address, it is reasonably well protected against intrusion attacks. Moreover, since the system is connected to the Internet only for very limited periods of time (during diagnostic read-out) the threat of intrusion can be considered moderate.
III. TOOLS AND METHODS FOR STATISTICAL ANALYSIS OF DIAGNOSTIC TROUBLE CODES By storing diagnostic trouble codes collected from vehicles in a central database, statistical analysis methods can be employed to extract vital information such as which components have the highest failure rate, what is the mean time to failure for a specific component, what is the expected lifetime of a component, etc. Naturally, this type of information is of paramount importance in the life cycle support of the product, and also as feedback to product development, in order to pinpoint what the main technical problems with the products are, and to prioritize where development resources should be invested.
At Volvo Car Corporation today, most of the statistical analysis of DTCs is performed manually, using Microsoft Excel to generate diagrams, graphs and reports. This work is time consuming and tedious, and can easily become a bottleneck when the size of the DTC database grows very large. For this reason, more sophisticated statistical analysis tools, with automatic report-generation functions are desired. Based on these requirements, we have developed a toolbox consisting of a number of MATLAB modules for quick analysis and presentation.
A. A MATLAB toolbox for DTC analysis
For efficient processing of large quantities of data, a multidimensional MATLAB structure is used to hold the data imported from the DTC database. The DTC database contains many different data types, such as DTC name, model year, engine type, etc. For performance reasons, all these data types are mapped into a numerical representation. A number of MATLAB functions have been written that supports efficient retrieval of well-defined subsets of the data. Using these functions, the most interesting statistical information can be extracted from the data and analyzed using a number of tools, including frequency functions, histograms, hazard analysis, probabilities and stack diagrams.
1) Statistical analysis
When collecting data such as DTCs about failures of components over a period of time, a histogram shows the frequency of failures in discrete intervals of time. A function that approximates the histogram is called a probability density function (PDF) [5]. The probability of failure in a time interval [t1, t2] is the area under the PDF curve between t=t1 and t=t2.
The hazard function gives the probability of instant failure in the next small time interval ? t, given survival until time t.
Using the hazard function, the failure rate at a given time can be calculated, which is simply the number of failures divided by the numbers at risk. To visualize a trend of failures, it is often convenient to study the integral of the hazard function, called the cumulative hazard.
Now, to be able to calculate all of the abovementioned useful statistics of a collected data set, we need to find a PDF that approximates the histogram of collected DTCs in a good way. One very well known PDF that has proven highly useful for statistical modeling in reliability engineering and failure analysis is the Weibull distribution [6].
2) Examples
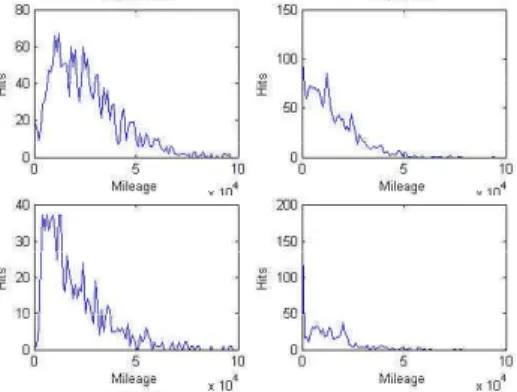
Below we give some examples of what type of statistical analysis can be performed using the MATLAB toolbox developed. To begin with, as an example of what the frequency distributions for different DTCs might look like, four plots of the number of instances of a DTC (hits) to the mileage is shown in Fig. 1. (Mileage is frequently used instead of time as independent variable in automotive failure analysis.) Note that this is the raw data (i.e. the histogram) plotted, before any statistical analysis. These plots can be seen as a useful starting point for deeper analysis.
Figure 1. Four different DTCs plotted against mileage
From the data displayed in Fig. 1, we can now calculate the Weibull density function for specific DTCs. In Fig. 2 the Weibull function for a specific DTC is shown in the left graph (corresponding to the data in the top left graph of Fig. 1). From the Weibull function we can then calculate the hazard function, shown to the right in Fig. 2.
A more comprehensive presentation of the tools for statistical analysis of trouble codes is given by Bryngelsson and Jonsson [7].
Figure 2. Weibull density function for a specific DTC (left) and hazard function for the same data (right)
IV. PILOT STUDY
To verify the functionality and usefulness of the wireless diagnostic read-out system, a pilot study was conducted, wherein eight test vehicles were equipped with mobile units. The test vehicles were operated in the Gothenburg and Stockholm urban areas in Sweden. The drivers were given written instructions (half a page) on how to operate the equipment. The duration of the pilot was three months.
In addition to the diagnostic read-outs performed from the test vehicles, a number of specifically tailored experiments were performed to test the functionality and reliability of the system. For instance, in one test, four mobile units were synchronously activated, to test the system's ability to handle multiple simultaneous read-out sessions. In another test, a specifically developed software simulator was used instead of actual hardware mobile units. This way, a large number of read-outs could be simulated, to verify the operation of the server side of the system. In this test, 1300 read-outs in one night were handled successfully by the system.
Some problems were identified during the pilot study, mainly relating to the operation of the equipment by the drivers. Specifically, we noticed that those drivers who had been given a hands-on demonstration of the systems tended to operate it correctly, whereas those who had only been given the written instructions sometimes switched the system off prematurely, before read-out was completed. This underlines the importance of good instructions whenever human intervention, albeit ever so simple, is needed.
The pilot provided a successful "proof of concept" implementation of the wireless diagnostic read-out system. However, the amount of diagnostic data collected during the pilot was too small to be useful for evaluation of the tools and methods for statistical analysis of DTCs, described in section III. Therefore, previously collected DTCs available from the DTC database at Volvo Car Corporation was used for the evaluation of these tools.
The overall conclusions from the pilot study and the experimental use of the new tools and methods for statistical analysis of DTCs are that it gives an opportunity to collect and analyze diagnostic data from test vehicles in a more systematic way, with a broader scope, compared to traditional approaches. The automatic report-generation feature of the statistical analysis tools saves time in the analysis phase and prevents manual errors.
V. DISCUSSION
The main focus of the work presented here has been to develop tools and methods to facilitate collection and analysis of diagnostic data from a broader range of test vehicles, compared to what has previously been possible, thereby getting access to data that otherwise would be missed. Naturally, this is beneficial in that problems can be detected and resolved earlier in the development phase, reducing the risk of having to recall faulty vehicles after they have been sold. However, there are also other benefits of a wireless diagnostic read-out system. Consider for instance a situation wherein a test vehicle in a remote rural area suffers from an engine malfunction due to a
software error in the engine control module (ECM). Instead of sending an engineer to the remote location to resolve the problem, we can establish a wireless connection with the mobile unit in the car, read out diagnostic data, do the necessary troubleshooting, and possibly assist the driver on how to overcome the problem. In future versions of our system, we may choose to implement software download of ECU firmware, making it possible to fix software bugs in the ECUs. (Currently there is no such support, but the implementation is straightforward.) When operating the system in this way – i.e. for remote troubleshooting of specific cars – the same system is used for the troubleshooting as the mechanic normally uses, when working with a car locally in the workshop. This is a big advantage, not only because it makes it easier for the engineers to use the system, but also from a software maintenance perspective. When a new version of the diagnostics software is to be released, it is the same release for all installations, whether they are for authorized repair shops or for wireless diagnostics.
Another situation where wireless read-out of diagnostic data can be helpful is for analysis of reported problems with pre-series quality assessment vehicles. These pre-series vehicles, that appear rather late in the development process, are typically operated by employees or other trusted affiliates of the car manufacturer. The users are expected to report problems with the vehicles in a formalized way. When analyzing such problem reports, a key concern is whether a given technical problem is an isolated fault with a specific vehicle, or if it is a systematic fault for a certain subset of all quality assessment vehicles. To resolve such questions, wireless diagnostics read-outs can be performed from all or a subset of the quality assessment vehicles.
In addition to the wireless diagnostic read-out functionality, the mobile units can also be used as a gateway for wireless communication with other equipment in the car, which would otherwise not be possible to communicate with.
VI. CONCLUSIONS AND FUTURE WORK In this paper we have presented the design of a framework for wireless collection and analysis of diagnostic data from test vehicles. The system provides both large scale collection of diagnostic data from a potentially large fleet of test vehicles, as well as direct online diagnostics of specific cars. Statistical analysis of diagnostic trouble codes is supported through a number of MATLAB components. The analysis tools can generate histograms and graphs of DTC frequencies from a data set defined by a number of parameters such as year model, engine type, etc. Moreover, the tools support Weibull analysis and calculation of failure rates of components. By moving from
a mainly manual processing of diagnostic data from test vehicles, into a method of work based on mathematical analysis and computer based tools, we believe that hardware and software problems can be identified earlier in the development process, and as a result engineering resources can be utilized more efficiently.
In addition to large scale collection of DTCs, the wireless diagnostics system is also useful for remote online troubleshooting of specific test vehicles. Furthermore, the mobile unit is useful as a gateway to other measurement equipment in the car.
Our future work includes experiments with other wireless access network technologies than GPRS (e.g. EDGE, 3G, WLAN). In previous work we have developed a framework for accessing many types of measurement data from vehicles over a wireless LAN at a proving ground [8]. We will extend this framework with components from our present work, so that diagnostic trouble codes can be accessed over WLAN while test vehicles are present at a proving ground.
Another future endeavor we are contemplating is implementation of software download functionality, making it possible to update the firmware of electronic control units in the car over a wireless connection.
The tools developed will form the basis for development and evaluation of new work methods in automotive diagnostics.
REFERENCES
[1] S. Voget, "Future trends in software architectures for automotive systems," Advanced Microsystems for Automotive Applications, Berlin, Germany, May 2003.
[2] O. Larses, "Modern automotive electronics from a dependable systems perspective," Technical report, Royal Institute of Technology, ISSN 1400-1179, 2003.
[3] ISO 15765-2:2004, "Road vehicles – Diagnostics on Controller Area Networks (CAN) Part 2: Network layer services," International Standards Organization, 2004.
[4] http://www.ipetronik.com/pdf/M_Log_en.pdf
[5] P. D. T. O'Connor, "Reliability engineering," Hemisphere Publishing Corp., ISBN 0-89116-684-X, 1988.
[6] W. Weibull, "A statistical distribution function of wide applicability," J. Appl. Mech. 18, pp. 293-297, 1951.
[7] J. Bryngelsson and H. Jonsson, "Statistical analysis of measurement data and report generation in vehicle applications," Masters Thesis, Luleå University of Technology, ISSN 1402-1617 / ISRN LTU-EX--06/270--SE / NR 2006:270, 2006.
[8] M. Johanson and L. Karlsson, "A framework for distributed collaborative automotive testing," 4th Workshop on Challenges in Collaborative Engineering, Prague, Czech Republic, April 2006.