e-ISSN: 2278-7461, p-ISSN: 2319-6491
Volume 8, Issue 1 [January 2019] PP: 27-46
Enhancing economically and eco-friendly jute production
through appropriate conservation agricultural tillage cum
seeding methods in the southwestern coastal region of Bangladesh
M. A. Mottalib
1, M. A. Hossain
2, M. I. Hossain
3, M. N. Amin
4, C. K. Saha
5, M.
M. Alam
62, 3& 4 Farm Machinery and Postharvest Process Engineering Division
Bangladesh Agricultural Research Institute, Gazipur-1701, Bangladesh
5&6
Professor, Department of Farm Power and Machinery Bangladesh Agricultural University, Mymensingh-2202, Bangladesh
1PhD Fellow (FPM), Bangladesh Agricultural University, Mymensingh-2202 &Scientific Officer, Spices
Research Centre, Bangladesh Agricultural Research Institute, Bogura, Bangladesh Corresponding Author:M. A. Mottalib
ABSTRACT: This paper demonstrates for enhancing jute crop productivity and profitability for small scale farmers through appropriate conservation agriculture (CA)tillage practices to adapt with climate change under subtropical climatic conditions in the southwestern coastal region of Bangladesh. The study was conducted in the farmers’ field at Baratia village of Dumuria Upazila under Khulna district during Kharif-1 season (May-August) of 2017 and 2018 for testing, adoption and popularization of different CA machinery such as strip till planter (ST), power tiller operated seeder (PTOS) along with conventional tillage cum broadcasting and conventional tillage cum seedling transplanting method of jute. The soil texture was clay loam having soil pH of 7.8. The land type was medium high with bulk density 1.38 g/cc at 0-15 cm depth. The effective field capacity of ST, PTOS and power tiller for dry land and wet land tillage were found to be 0.098, 0.099, 0.10 and 0.090 hah-1, respectively. Power tiller required at least three passes for complete land preparation and by CA machines, tilling and seeding was done by single pass for jute planting. Fuel saving by CA machinery over power tiller was 21 Lha-1. Therefore, cost of fuel saving was 58% and reduction of carbon emission was 59%. Significantly the highest dry stalk and fiber yields were found from strip till planted jute followed by PTOS and conventional tillage cum broadcasting method and the jute seedling transplanted method. CA methods increased about 58% of area coverage and 47% more net profit per season over conventional methods. The highest benefit cost ratio (BCR) was obtained from ST (2.26) and PTOS planted (1.71) jute followed by CTB (1.37) method. The lowest
BCR was found from CTT method (1.02) of jute. Since more revenue obtained from CA machine operation, an
entrepreneur or a local service provider (LSPs) can start custom hiring services business in this region. The hiring charge of CA machines operation for a sample service provider was worked out as US$60 per hectare as well as break-even use of machine operation was estimated as 4.69 ha of land per year which would be profitable venture for an entrepreneur. To popularize the benefits of CA machinery, there is need of international, regional and national support for adoption and dissemination programs to the small farmers, an entrepreneur or a custom hire service provider.
KEYWORDS: Conservation agriculture, strip tillage, PTOS, jute cultivation, carbon emission, southwestern region.
--- Date of Submission: 23-02-2019 Date of acceptance:14-03-2019
---I.
INTRODUCTION
result in low crop yields. To establish jute followed by rice, farmers of southern part of Bangladesh typically use 3-4 passes by power tiller. Mechanical tillage tools release CO2 through the combustion of fossil fuels, and
increases carbon dioxide levels in the atmosphere (Chivenge et al., 2007). According to Hobbs and Govaerts (2010) agriculture contributes significantly greenhouse gas (GHG) emissions such as CO2, CH4 and N2O.
Reduced tillage is a management practice that potentially can reduce environmental impacts and improve agricultural outputs (Buckwell et al., 2014).
Bangladesh was recognized as one of the best jute producing and exporting countries of the world until early seventies (Islam, 2013). But since 1972-1973 the country has been losing its monopoly in the world jute trade. National average productivity of jute fiber in Bangladesh is 1.95 t/ha, which is lower than the India (2.3 t/ha) (Islam et al., 2017). The global demand as well as local uses of jute and similar products has a steady increased by a fresh comeback for biodegradable fiber as people now look for eco-friendly products replacing synthetics. Bangladesh produces around 30% of the total world production of jute and exports around 40% of its total produce as raw jute. However, the demand of raw jute within the country has been increasing trend over the years. Jute farming has increased in the country over the past few years as the jute farmers are getting fair price of their produce. Overall 61% jute farmers have increased overall livelihood from jute cultivation during the last four years (2011-2014) (Sheheli et al., 2014). Eventually, with the increase in price of jute, production system has not changed significantly (Uddin et al., 2014). It is expected that technological change required at the farmer level for the improvement of this sector. Improved technologies such as improved seed, line sowing, recommended fertilizer and plant protection measures increase the fiber yield of jute by 20, 23, 27 and 13%, respectively over conventional practices (Islam et al., 2017). Jute seed requires fine tilth for its proper germination, as its seeds are very small in size. It needs 3-5 times cross ploughing and laddering for uniform smooth soil. Generally, farmers in study area, plant jute after Boro rice with 2-3 numbers of ploughing followed by laddering by power tiller and hand broadcasting of seeds. The existing full tillage system for jute planting after Boro rice is being delayed by 5-7 days. The traditional tillage method reduces soil organic carbon at double rate and decreases soil fertility (Grace, 2003), losses irrigation water and soils (Sayre and Hoobs, 2003), and damages ecological environment (Grace, 2003). But repetitive tillage requires significant amounts of fuel and energy (Aravindakshan et al., 2015) and results in increased production cost and reduced profit (Gathala et al., 2015). Every crop has its optimum time of sowing/planting. Delay sowing/planting reduces yield significantly (Jat, 2013). Alternative practices include the use of appropriate tillage and planting machinery which further reduce fuel costs by eliminating repetitive tillage. Reduced tillage method saved 94 liters fuel per hectare per year and emission 44% less CO2 into the atmosphere (Hossain et al., 2008).
Alternative practices include the use of appropriate tillage and planting machinery to encourage faster crop turnaround, which can potentially facilitate higher yields because of the inverse relationship between yields and sowing dates in Bangladesh (Krupnik et al., 2015). The innovation of CA is to avoid repeated ploughing of the soil, which saves time, energy and labor conserving water and nutrients in the soil to support sustainable crop production. Research evidence illustrates that CA gives at least the same yields as conventional tillage, often more, with less time and energy input and better environmental sustainability. Conservation tillage techniques such as zero, strip, or reduced tillage, and raised and permanent beds, which further reduce fuel costs by eliminating repetitive tillage, and/or that can reduce irrigation requirements (Gathala et al., 2011). CA based tillage technology permits direct seeding in untilled soil with moderate level of crop residue. The practices of zero tillage and strip tillage, each of which require specialized machinery, can also reduce time requirements for planting and costs, largely by saving fuel, compared to conventional full tillage with animal or tractor power and manual planting (Kiel et al., 2015). There are about 700,000 power tillers (two-wheel tractor) available in Bangladesh (Gurung et al., 2017). Power tiller operated CA based tillage technology has been developed by different organizations and promotional activities are being conducted in the farmers’ field of Bangladesh for yield gap minimization, water saving, efficient input utilization, soil health improvement and sustainable crop production and crops diversification (Hossain et al., 2014). There is a big prospect accelerating the CA based tillage technology for jute cultivation in the farmers’ field of coastal region of Bangladesh Therefore, this study was undertaken to enhance jute crop productivity and profitability for small scale farmers through appropriate conservation agricultural tillage practices to combat climate change under subtropical climatic conditions in the southwestern coastal region of Bangladesh.
II.
MATERIALS AND METHODS
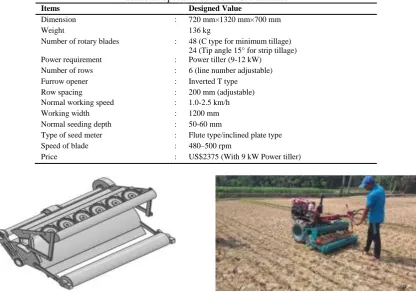
Machine descriptionaccomplished three operations in a single pass shallow tillage (up to 60 mm), placement of seed in a furrow and leveling cum pressing. This machine was tested and evaluated for planting of different crops like maize, jute, wheat, pulses and oilseeds in field condition. Different seed metering devices (fluted/inclined type) were used for planting different crops of seed directly. It is able to complete planting operation in a single pass and average field capacity is 0.10 ha/h. This machine can complete planting operation in the same day of previous crop harvest, whereas conventional methods it takes 7-9 days from harvest to seeding. Farmer can remove seeding unit from the machine and convert only for tilling purpose. Three different conservation tilling method (zero, strip, minimum tillage) can be operated by this single machine by arranging tines and furrow openers. Inverted T furrow opener is used for different tilling method especially for zero till method for furrow opening and seed dropping in the furrow properly and 150 tip angle rotary blade is used for proper back filling of soil in the furrow in strip till method. Strip tillage can be done by removing the rotary blades. In strip tillage the number of blades depends on the number of furrow opener where in front of every furrow opener, four blades are arranged for tillage (Hossain et al., 2005). Technical specifications of the CA machine are presented in Table 1.
Table 1: Specifications of a CA machine
Items Designed Value
Dimension : 720 mm×1320 mm×700 mm
Weight 136 kg
Number of rotary blades : 48 (C type for minimum tillage) 24 (Tip angle 15° for strip tillage) Power requirement : Power tiller (9-12 kW)
Number of rows : 6 (line number adjustable) Furrow opener : Inverted T type
Row spacing : 200 mm (adjustable) Normal working speed : 1.0-2.5 km/h
Working width : 1200 mm
Normal seeding depth : 50-60 mm
Type of seed meter : Flute type/inclined plate type Speed of blade : 480–500 rpm
Price : US$2375 (With 9 kW Power tiller)
Figure 1: Isometric and field operational views of BARI inclined plate planter
Site Description
Figure 2: Pictorial view of study area location in southwestern region of Bangladesh
Field Experimentation
The design of the experiment was randomized complete block design (RCBD) with four treatments and three replications. The number of participating farmers was 12. The unit plot area was 8-10 decimal (423-485 m2). Total four treatment combinations including a control were distributed randomly in each farmer plot as one treatment as well as one replication. The treatments were ST= Strip till planting (CA), PTOS= Planting by power tiller operated seeder (Minimum tillage), CTB= Conventional tillage and broadcasting (farmers’ practice),
CTT= Conventional tillage and transplanting (farmers’ practice), respectively. Traditional tillage cum
broadcasting method is usually followed by most of the farmers in Bangladesh. As jute seeds are very small in size, it was mixed with rice bran (1:3) to adjust desirable seed dropping. Jute seed was treated before planting with Sunphonet 70 WP (Thiophonetmethail) fungicide to protect soil born disease. Pre-plant non-selective herbicide named Gramoxone 24SL (active ingredient paraquate dichloride) was sprayed at recommended rates (2.00 Lha-1) to destroy the weeds before 3-5 days of jute planting. Urea of 0.15-0.2 kg/ha was placed in the sprayer tank with water and herbicide ingredient to increase the efficiency of plant absorption. But in PTOS and conventional system, further weeding operation was done manually after planting. Bed planting method is not generally used for jute planting because of lodging of jute plant during growing stage especially when it becomes tall. Zero till planter could not be used for planting of jute because the upper surface of the soil was very hard but the inner soil was moist and sticky. The soil was cracked (Figure: 3) after 7-10 days of Boro rice harvesting and before jute planting and thus seed sowing in the cracked soil was not possible. Small jute seeds enter into the cracked soil during seeding operation. So, zero till planting method was excluded in this study.
Figure 3: Cracked soil before machine operation
Irrigation was applied through flexible plastic hose pipe as per requirement. The fertilizers were applied at the rate of N100P5K30S10 kg/ha. NPKS fertilizers were applied in the form of urea, TSP, MoP and
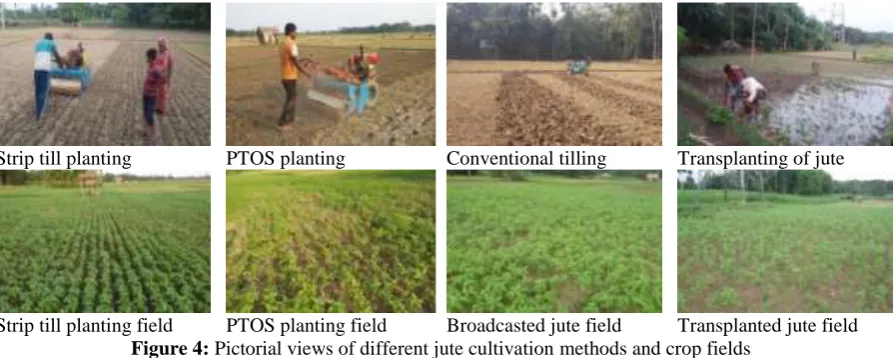
In the study area, farmers are practicing jute seedling transplanting method from last five years due to delaying in for Boro rice harvesting, unavailability of jute seed and to reduce turnaround time. The field was made muddy applying water or rain and then tender jute seedlings (20-25 days old) were transplanted in the muddy soil. No extra seedlings were raised. The seedlings were obtained after thinning of jute from high land which was sown earlier. Therefore, a treatment of transplanting of jute seedling was included in this experiment. Figure 4 shows the pictorial views of different jute cultivation methods and established crop fields in the study area. Experimental methods for jute cultivation during Kharif-1 season of 2017 and 2018 are given in Table 2.
Table 2: Experimental methods for jute cultivation during Kharif-1 season of 2017 and 2018
Items Season of 2017 Season of 2018
No. of farmer 12 12
Area 0.49 ha 0.65 ha
Crop Jute Jute
Variety BJRI Tossa-2 (O-9897) Nabin (JRO-524)
Treatment ST
PTOS
CTB
CTT
ST
PTOS
CTB
Replication 3 4
Seed rate 4 kg/ha (Machine) &
6 kg/ha (Farmer’s practice) 5 kg/ha (Machine) & 6 kg/ha (Farmer’s practice)
Line spacing 30 cm 20 cm
Date of planting 6-7 May 2018 2-3 May 2018
Date of harvesting 11-13 August 2017 13-15 August 2018
Note: ST= Strip till planting, PTOS= Planting by power tiller operated seeder (Minimum tillage), CTT= Conventional tillage and transplanting (Farmers’ Practice), CTB= Conventional tillage and broadcasting (farmers practice)
In the year of 2018, the harvesting period of Boro rice was delayed of 7-10 days due to heavy rainfall. Farmers’ could not harvest Boro rice timely. They passed busy time with post-harvest work of rice. Therefore, farmers could not conduct conventional tillage and transplanting method (CTT) of jute cultivation. As a result,
jute growing area was decreased in the study area. Again, in Bangladesh, the consumption rate and price of edible jute leaves vegetables is increasing year to year. The jute leaves are nutritious and very popular vegetable. Idirs et al. (2010) presented a result that jute leaves are rich sources of potassium, iron, copper, manganese and zinc as well as high energy values essential in human and animal nutrition. Now a day, farmers’ like to give more seed rate than required rate to get more profit from jute leaves as well as minimizing the labour cost for weeding and thinning practices.
Strip till planting PTOS planting Conventional tilling Transplanting of jute
Strip till planting field PTOS planting field Broadcasted jute field Transplanted jute field
Figure 4: Pictorial views of different jute cultivation methods and crop fields
Data collection
etc.) and crop parameters (plant population, plant height, stalk yield, fiber yield etc.) were collected during field experiments.
Moisture content and Bulk Density of the soil
A trench 50 cm by 50 cm was dug through the soil profile to a depth of 50 cm below the surface of the ground in each plot. And undisturbed soil samples were taken from the edge of the trench at 0-5 cm and 5-10 cm depth using core samplers with height 5 cm and diameter 5 cm. The samplers were driven vertically into the soil by hammer enough to be filled with soil. The sampler and its contents were carefully removed to preserve the natural structure and packing of the soil as best as possible. The soil extending beyond each end of the sampler was trimmed to ensure soil was contained in exactly the volume of the cylinder. The soil cores were wrapped in polyethylene, placed in box and transported to the laboratory for analysis. The soil samples were transferred to a container, placed in an oven at 1050C, and dried to constant weight. The weight of soil was recorded and moisture content (w.b.) and current bulk density was calculated using oven-dry method
Moisture content,
100
g
sample,
wet
the
of
Weight
g
moisture,
the
of
Weight
(%)
MC
(1)Bulk density, g/cc
cc
sampler,
core
of
Volume
g
sample,
soil
of
Dry weight
(2)Testing of field performance of machines
The seed rate was determined by taking the weight of seed before and after sowing operation. Transparent polythene bags were tagged with each of the six seed delivery tubes. The seeder machine was operated on a pre-measured 20 m travel distance with a sowing width of 120cm, thus providing 24 m2 area coverage. After every 20 m linear distance run, collected seeds through tubes were weighed separately and the total seed weight was also measured. Then subtracted the final weight of seed from initial weight of seed so that the seed rate was obtained and the results were expressed in terms of kgha-1. This method was repeated by acceleration and deceleration of the lever of seed rate control until the desired seed rate obtained. Fluted type seed metering device was used for jute planting. Since the seed metering device was connected by a chain-sprocket arrangement to the power tiller wheel axel. Seed rate was determined through calculation by using the following equation (Michael and Ojha, 2005).
A
Ws
10
d
S
(3)Where, Sd = Seed rate, kgha-1; Ws = Total weight of seed, g; and A = Measured area, m2
Pre-measured distance was fixed by two standing sticks. During the time of sowing, fixed distance passing time was recorded by stopwatch and travel speed was computed using the following simple relation by equation (Hunt, 2001)
h
km
,
t
D
3.6
S
(4)Where, S =Forward speed, kmh-1; D= Distance, m; and t = time, s
Theoretical field capacity is rate coverage of the implements based on 100 percent of the rated speed and covering 100 per cent of its rated width. Theoretical field capacity was calculated by the following equation (Hunt, 2001).
h
ha
,
10
Sw
T.F.C
(5)Where, S =Forward speed, kmh-1 and w= Width of tilling, m
Effective field capacity is the actual field coverage of the seeder per unit time. To determine operating time, time was noted at starting and ending point of machine operation by using stop watch, so that actual time required for planting by seeder machine was computed in terms of h/ha. The time required for one turn of machine and time consumed for adjustments were also noted to compute time loss in operation. EFC was calculated as follows (Hunt, 2001).
h
ha
,
T
A
Where, EFC = Effective field capacity, hah-1; A= Actual operational area covered, ha;andT= Total operating time, h
Field efficiency is the ratio of effective field capacity to theoretical field capacity. It was determined by the following formula (Hunt, 2001).
100
TFC
EFC
E
f
(7)The fuel consumption has direct effect on economics of the machine. The fuel consumption was measured by top fill method. The fuel tank of the two-wheel tractor engine was filled and refilled before and after the planting operation, respectively. The quantity of refilled fuel was measured by measuring cylinder. This observation was used for computation of fuel consumption in Lh-1and Lha-1. Refilled quantity was the fuel consumption was measured as follows,
Fuel consumption, Lh-1
h
,
opearation
of
time
Required
L
fuel,
of
quantity
filled
-Re
(8) Environmental aspectCarbon dioxide (CO2) gas emission measurements were carried under real conditions when the
two-wheel tractor along with CA machine was used for operating in different tilling methods in the fields. The burning of diesel fuel creates exhaust gases, and while there can be slight differences from engine to engine, those gases are created in known quantities. By knowing the fuel rate at which an engine consumes fuel, a very accurate calculation of carbon dioxide (CO2) emissions can be obtained. Tillage operations contribute CO2
through rapid decomposition of organic matter. Grace (2003) reported that every liter of diesel fuel used by tillage machinery contributes 2.640 kg CO2 to the atmosphere. One liter of diesel weights 835 g. Diesel consists
for 86.20% of carbon, or 720 g of carbon per liter diesel. In order to combust this carbon to CO2, 1920 g of
oxygen is needed. The sum is then 720 + 1920 = 2640 g or 2.640 kg of CO2L-1 diesel. For example, an average
diesel consumption of 1.30 Lha-1then corresponds to 1.30 Lha-1 × 2.640 kgL-1 = 3.432 kg CO2 ha -1
. Diesel use remains a great source of Green House Gases (GHG) presented by Grace (2003).
Economic analysis
The implementation of CA systems entails several economic benefits; some of them are direct and easily quantifiable such as the improvement of the accounting results of the operation. The main direct economic benefit to the farmers comes from the reduction of production costs since the yield of the crops under CA is similar to conventional systems. A simple economic analysis was done based on total production. Production cost included input cost. The input cost was calculated by considering cost of seed, fuel, fertilizers, herbicide, insecticide, irrigation and hiring charges of labour. Land use cost was not considered. The gross return and net return were calculated on the basis of local market price. The sinking-fund method is used for calculating depreciation. The annual cost of operation of CA machine was computed as the sum of fixed costs and variable costs.
Fixed costs
Fixed costs (FC) are expenses incurred regardless of whether the machine is operated or not (Depreciation, D; interest on investment, I; and shelter, taxes, insurance, STI). Fixed costs are fixed in total, but decline per hectares, as the annual use of the machine is increased (Barnard and Nix, 1979). In calculation of FC per year is assumed and the following equation was used (Hunt, 2001).
FCyr= D+I+STI (9)
Where, FC= Total fixed cost, US$yr-1; D= depreciation, US$yr-1; I= interest on investment (bank interest rate on agricultural loans), US$yr-1; STI= shelter, tax and insurance US$yr-1
So, ha y r ha
A
FC
FC
(10)In calculation of fixed cost, sinking-fund depreciation (D) is assumed and was calculated by the following equation, (Hunt, 2001)
S
Where, D= depreciation, US$yr-1; P= purchase price, US$; S=salvage value (10% of P), US$; L= Effective working life of machine, yr; n= age of the machine in years at the beginning of the year, yr; i= annual bank interest rate, decimal.
Interest on investment (I) is the charge for the use of the cash invested on the machine regardless of whether the cash was borrowed or not. The following equation was used for the calculation of interest on invest (Hunt, 2001)
i
2
S
P
I
(12)Insurance is the cost of protecting the machine and shelter against accidents and theft. Taxes are sometimes collected in some places when the machine has to be registered with the local government. In Bangladesh, tax and insurance is free from locally made agricultural machinery. In the calculation shelter, tax and insurance (STI) was considered for calculating fixed cost of machine (Hunt, 2001).
STI= 2.5% of P (13)
Variable cost
Variable costs (VC) are expenses incurred as a result of machine operation (fuel costs, labour, and other inputs). Variable costs depend on hourly labour cost, fuel, oil, repair and maintenance cost, and the required working hours for each field operations. The cost of operator was calculated as the labour rate in US$/day. The fuel and oil costs were estimated from consumption rate and multiplied by their respective prices. VC was calculated by the following equation (Hunt, 2001).
Variable Cost (US$ha-1), VC= Lb+F+O&L+R&M+Mc (14)
Where,
Lb= Operator/labor cost, US$ha-1
)
(hayr
coverage
area
Total
)
(US$yr
labor
of
wages
of
Sum
1
--1
(15)F= Fuel cost, US$ha-1 =Fuel price (US$L-1) × Fuel consumption (Lha-1) (16)
O&L = Oil & lubrication cost= 15% of fuel cost (17)
R&M= Repair and maintenance cost per year= 3.5% of P (18)
Mc= Miscellaneous cost, US$ha-1
Total cost of operation (TOC) of a machine was divided into fixed costs and variable costs and measured by the following equation (Hunt, 2001)
Total cost of machine operation, US$ha-1 TOC= FC+VC (19)
Production cost was calculated by the following equation,
Input cost, Cp= Cs + Coc+Ch + Cfr+ Cpp + Cirr (20)
Where, Cp= Production cost, US$ha-1; Cs= Cost of seed, US$ha-1; Coc= Machine operating cost, US$ha -1
; Ch = Cost of human labour (weeding, thinning, spraying, harvesting, retting and stripping of jute), US$ha -1
; Cfr= Cost of fertilizer, US$ha-1; Cpp= Cost for plant protection (herbicide and pesticide), US$ha-1; Cirr= Irrigation
cost, US$ha-1.
Total cost (TC) was divided into total cost of operation of a machine and input cost. It was calculated by following formula,
TC(owned machine)= TOC+Cp (21)
This formula is valid for the machine owner total cost for crop production. But, during custom hiring service (CHS) charge calculation, the TOC was considered as TC.
TC(CHS)= TOC
Gross return (GR) was calculated by multiplying the total volume of output of an enterprise by the average price in the harvesting period (Dillon and Hardaker, 1993). The following equation was used to estimate GR.
GR = YmPm + YbPb (22)
Where, Ym= Yield of main product, ha-1; Pm= Price of main product, US$; Yb= Yield of by-product, ha-1; and
Pb= Price of by-product, US$.
Net return (NR), which is estimated from the differences between gross return and total cost of production (Riggs et al., 1996)
Benefit-cost ratio (BCR) is the ratio of annual gross return to total costs. The method of benefit-cost analysis is simple in principle. The formula of calculating BCR (undiscounted) is shown as below
)
(US$yr
production
of
Cost
US$yr
return
Gross
B
1 --1
CR
(24)Payback period (PBP) is length of time it takes to recover the invested capital or until the net benefits equal the investment cost. In the study, payback period is calculated by successively deducting the initial investment from the net return until the initial investment is fully recovered. Shorter the payback period, better it will be the investment on a machine and could be feasible. Payback period (PBP) of a machine was calculated by the following equation
)
(US$yr
return
Net
US$
investment
Initial
PBP
-1(25)
Break-even point (BEP) is the point of zero loss or profit. The break-even point is the annual use level at which the machine must be operated to make the investment profitable. At break-even point, the revenues of the business are equal its total costs and its contribution margin equals its total fixed costs. Break-even point can be calculated by computing method. The computing method is based on the cost-volume-profit (CVP) formula. The break-even use (BEU) of a CA machine depends on its effective field capacity of machine operation, power requirement, working life of machine; average machine operation per year, labour requirement and other charges. BEU was computed by the following equation
)
(US$yr
cost
Total
)
(US$yr
benefit
Annual
(US$)
cost
fixed
Total
BEU
-1 -1
(26)
Where, Fixed cost of the machine for entire economic life (US$) = Annual fixed cost of the machine (US$yr-1) × Economic life of the machine (yr)
Uniform annual payments to a fund are of such a size that by the end of the life of the machine the funds and their interest have accumulated to an amount that will purchase another equivalent machine. Replacement of machine by new one is essential because beyond economic life it is no longer being useful for operating in field. Performance of a new machine is significantly superior and it makes the old machine obsolete. Anticipated costs for operating the old machine exceed those of a replaced machine. Payment for replacement was considered as fixed cost and calculated by the following equation (Hunt, 2001).
1
i)
(1
i
S)
(P
PFR
L
(27)The excellent results in CA acted as a catalyzer for more farmers to adopt it, and to enlarge the area under this system for those already applying CA. The small proportion of farmers owning machines can be able to successfully service the large proportion of farmers using machines. In the study area before demonstration, the CA machinery was an unknown technology to the farmers and local service provider (LSPs). Because of the CA machinery benefits, smallholder farmers of machine owner, an entrepreneur or LSPs can be started custom hire service business to other farmers for land preparation and crop planting right now which will be profitable venture for an entrepreneur. In Bangladesh, custom hiring is a good choice of machinery business when need high-cost and/or specialized machinery and equipment for a short time. By offering this service to other farmers, custom operators can spread the cost of the machinery and equipment over many hectares. An entrepreneur can estimate the CA machine hiring charge from the following expression:
Hiring charge (US$ha-1) = TOC+EP (28)
Where, TOC= Total cost of operation (US$ha-1); and EP= Estimated profit (US$ha-1)
Data analysis
Collected data were tabulated, compiled and analyzed using a basic Microsoft Excel spread sheet and using one-way analysis of variance (ANOVA) with MSTAT-C statistical software. The data for each year were further analyzed if the interaction between year and treatments was significant. Means differences among the treatments were compared with Duncan’s Multiple Range Test (DMRT) or least significant difference (LSD).
III.
RESULTS AND DISCUSSION
Rainfall during study
mm) during the 2018 season. The total rainfall was measured 1204 mm and 1153 mm, respectively during the season of 2017 and 2018. Rainfall distribution was comparatively better with rains continuing into June and August than in other months during two seasons. Heavy rainfall data was recorded in April of 2018 season. This delayed Boro rice harvesting of 7-10 days. At this reason, jute planting trials was delayed and jute area coverage decreased. Besides this, in June in 2018, frequent heavy rains were caused water logging in some fields. As a result, some jute seedling of each field was damaged. Figure 5 presents the monthly rainfall at the study area location during the course of the study.
Figure 5: Rainfall distribution of the experimental site during the crop growing period of 2017 and 2018
(April-August)
Machine performance indicators of jute planting
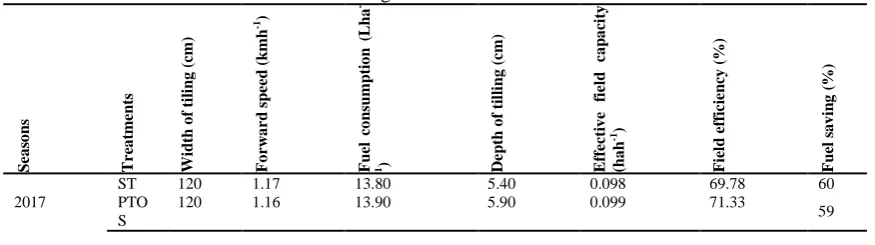
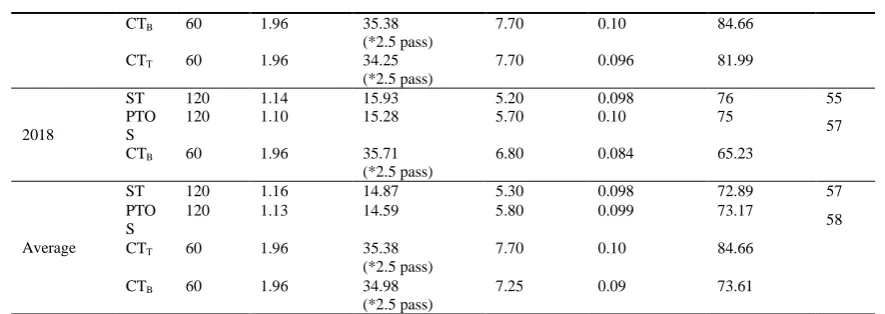
Field performance of different tillage and seeding machines at Baratia, Dumuria, Khulna during season of 2017 and 2018 is shown in Table 3. Three assumptions were considered during calculation of machine field performance parameters which are (1) The machine field performance parameters were calculated using average database of two season; (2) Operation technology is remaining unchanged during cropping season; and (3) Only jute planting season (30 days) is considered for performance evaluation as well as cost analysis. It was observed that the width of tilling for ST and PTOS were found 120 cm and for CT it was 60 cm. The average tilling depth in the soil for ST, PTOS and two CT methods were 5.30, 5.80, 7.70 and 7.25 cm respectively. The average effective field capacity of ST, PTOS and CT for dry land and wetland tillage were found to be 0.098, 0.099, 0.09 and 0.10 ha/h, respectively. The field efficiencies of ST, PTOS and conventional methods for land preparation were calculated as 72.89, 73.17, 73.61, and 84.66 %, respectively. The reasons for lower field efficiencies of CA machines were that these machines were operated at slow speeds (gear I) and turning losses were higher than those of CT method (gear III). The fuel consumptions for operation of ST and PTOS were 14.87 and 14.59 Lha-1, respectively. Average fuel consumptions in two CT method for dry land preparation and wet land preparation were 34.98 and 35.38 Lha-1, respectively. Single pass was enough for tilling and jute seeds planting in ST and PTOS methods. So, ST and PTOS saved about 57% and 58% fuels than those of wetland and dryland preparation for jute planting. Fuel consumption in CT for dry and wet land tillage was higher due to more pass as (2-3) required for land preparation. Comparison of fuel consumption of CA tilling method over CT method is shown in Figure 6.
Table 3: Field performance parameters of different planting method for jute planting at Baratia, Dumuria,
Khulna during season of 2017 and 2018
S ea so n s T re a tm en ts Wi d th o f ti li n g ( cm) Fo rw a rd sp ee d ( k mh -1) Fuel c o n su mpt io n ( L h a
-1) D
ep th o f ti ll in g ( cm) E ff ec ti v e fi el d ca p a ci ty (h a h -1) Fi el d e ff ic ie n cy ( %) Fuel s a v in g ( %) 2017
ST 120 1.17 13.80 5.40 0.098 69.78 60
PTO S
120 1.16 13.90 5.90 0.099 71.33
CTB 60 1.96 35.38 (*2.5 pass)
7.70 0.10 84.66
CTT 60 1.96 34.25 (*2.5 pass)
7.70 0.096 81.99
2018
ST 120 1.14 15.93 5.20 0.098 76 55
PTO S
120 1.10 15.28 5.70 0.10 75
57
CTB 60 1.96 35.71 (*2.5 pass)
6.80 0.084 65.23
Average
ST 120 1.16 14.87 5.30 0.098 72.89 57
PTO S
120 1.13 14.59 5.80 0.099 73.17
58
CTT 60 1.96 35.38
(*2.5 pass)
7.70 0.10 84.66
CTB 60 1.96 34.98
(*2.5 pass)
7.25 0.09 73.61
Note: *2.5 passes means two passes for tilling followed by one pass for laddering (0.5 pass)
Figure 6: Comparison of fuel consumption of CA tilling method over CT method
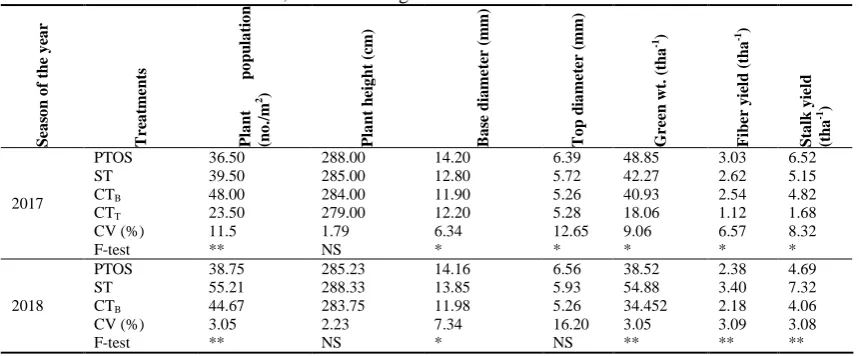
Yield and yield contributing parameters
Effect of different tillage systems on plant establishment, yield and yield contributing parameters of jute at Baratia, Dumuria, Khulna during the cropping season of 2017 and 2018 is given in Table 4. In 2017 season, significantly the highest dry stalk and fiber yields were found from PTOS planted jute followed by strip till and conventional tillage cum broadcasting jutes and they were statistically similar. Statistically the lowest stalk and fiber yield were found from jute seedling transplanted plot. The reason of the highest stalk and fiber yields from PTOS planted was that plant height and plant diameter of this plot were higher than other treatments. The plant height and plant diameter enhanced the increase of both stalk and fiber yields. The jute plants might receive more air and light due to lower plant spacing that might helped better growth. The lowest stalk and fiber yields were found from the transplanted jute because jute seedlings were transplanted (20×20 cm) in muddy soil and there was lower air movement in the soil. When soil dried, it became hard that might reduce the growth of jute. The yield of jute fiber of variety BJRI Tossa-2 (O-9897) in this study was similar to the yield (2.73 t/ha) presented by Khatun (2016). In 2018 season, significantly the highest dry stalk and fiber yields were found from strip till planted jute followed by PTOS and conventional tillage cum broadcasting jutes and they were statistically similar. The reason of the highest stalk and fiber yields from strip till planted was that plant population enhanced the increase of both stalk and fiber yields. In both season of 2017 and 2018, statistically the highest plant populations were found from CTB followed by PTOS and ST planted plots and they were
statistically alike but dry stalk and fiber yields were found lower than ST and PTOS planted jute respectively. Approximate 25-30% of immature jute plant was found in CTB jute planted field. Farmers of the study area
harvest jute within 90 to100 days. But, optimum harvesting day of jute is between 120 days to 135 days after planting. Farmers use the immature jute plants as binder to make a bundle of harvested jute. In season of 2018, water logging was occurred due to frequent heavy rainfall during growing stage of jute. As a result, some jute plant was damaged during that period. The highest morality percentage of jute plant was found from PTOS and CTB than ST. Rain water was drained out from strip till planted jute field rapidly with strip than PTOS and CTB
planted field. Though the soil of PTOS and CTB fields were well tilled and pulverized, small amount of water
Table 4: Effect of different tillage systems on yield and yield contributing parameters of jute at Baratia, Dumuria, Khulna during the season of 2017 and 2018
S ea so n o f th e y ea r T re a tm en ts Pl a n t p o p u la ti o n (n o ./ m 2) Pl a n t h ei g h t (c m) B a se d ia me te r (m m) T o p d ia me te r (mm ) Gre en w t. ( th a -1) Fi b er y ie ld (tha -1) S ta lk y ie ld (tha -1) 2017
PTOS 36.50 288.00 14.20 6.39 48.85 3.03 6.52
ST 39.50 285.00 12.80 5.72 42.27 2.62 5.15
CTB 48.00 284.00 11.90 5.26 40.93 2.54 4.82
CTT 23.50 279.00 12.20 5.28 18.06 1.12 1.68
CV (%) 11.5 1.79 6.34 12.65 9.06 6.57 8.32
F-test ** NS * * * * *
2018
PTOS 38.75 285.23 14.16 6.56 38.52 2.38 4.69
ST 55.21 288.33 13.85 5.93 54.88 3.40 7.32
CTB 44.67 283.75 11.98 5.26 34.452 2.18 4.06
CV (%) 3.05 2.23 7.34 16.20 3.05 3.09 3.08
F-test ** NS * NS ** ** **
Note: ** and * indicate significant at 1% and 5% level respectively and NS= Non-significant
Comparing the economics of CA tillage method to conventional tillage method
Economic analysis of Boro rice-Jute-Aman rice cropping pattern under different tillage practices was done based on the total cost of production and average input cost and return of jute crop (Table 8). Some assumptions were considered during cost calculation of CA tilling methods and conventional tilling methods which were:(1) The financial analysis was computed for machine owner; (2) only jute cultivation season was considered for cost analysis; inflation rate was ignored in the calculation; all the devices were purchased with cash; prices of all inputs and outputs were remaining same throughout the project life; and conversion rate of BDT and US$ was used for the year 2018. Comparing the economics of CA till production and conventional production involves changes in production costs that can be evaluated using a partial budget. Cost reduction was attributed to savings on account of diesel, labor, and other input costs. Inputs such as seed, fertilizers, weeding, and thinning were found to be significant in increasing yield. CA tilling method was eliminated the need for whole-field secondary tillage but strip till planting method might require a chemical burn-down operation that would not be necessary under conventional tillage. Converting to CA till production involved investment in different tilling and seeding machinery that resulted in changes to fixed and variable costs. Mueller et al. (1985) reported that the short-run average of machine operation costs per hectare the fixed cost for CA tillage methods is higher than for conventional tillage methods. The expected use in hectares, the ownership costs in detail, operating costs, and total costs of CA tilling method and conventional tilling method are summarized in Table 5, Table 6, Table 7, and Table 8, respectively. Figure 8 shows the variable cost comparison of CA method over traditional method. Among the cost items, the highest cost per hectare was found for fuel cost and operator cost followed by lubrication cost and repair and maintenance cost under CT method over CA tillage method.
Table 5: Estimated cost and use factors for different tillage method
Items ST PTOS CTB CTT
Purchase price, US$ 2294 2294 1412 1412
Salvage value, US$ 229 229 141 141
Economic life, yrs 8 8 8 8
Annual use in area, ha/yr 24 24 10 10
Effective operation time, h/day 8 8 8 8
Machine usage, day/yr 30 30 30 30
Interest rate, % 14 14 14 14
Engine power, kW 9 9 9 9
Note: 1 US$= BDT 85 (2018); ST= Strip till planting; PTOS= Power tiller operated seeder; CTB= Conventional
Table 6: Ownership (fixed) costs of CA tilling method and conventional tilling method
Items ST PTOS CTB CTT
Depreciation, US$yr-1 203 203 125 125
Interest on investment, US$yr-1 44 44 27 27
Shelter, tax and insurance, US$yr-1 57 57 35 35
Payment for replacement, US$yr-1 156 156 96 96
Total fixed costs, US$yr-1 460 460 283 283
Total fixed costs, US$ha-1
20 19 13 12
Note: Price of diesel = US$0.765/liter; Labour charge= US$6 per day (8h/day)
Table 7: Operating (variable) costs of CA tilling method and conventional tilling method
Items ST PTOS CTB CTT
Fuel consumption, Lh-1 1.35 1.35 1.35 1.35
Fuel consumption, Lha-1
14.87 14.59 34.98 35.38
Fuel price per liter 0.765 0.765 0.765 0.765
Fuel cost, US$ha-1
11 11 27 27
Oil & lubricant, US$ha-1
2 2 4 4
Repair and maintenance cost, US$ha-1
3 3 6 5
Operator/labour cost, US$ha-1 8 7 20 18
Miscellaneous cost, US$ha-1
3 2 7 4
Total machine cost, US$ha-1
27 26 64 59
Source: Authors’ estimation based on field survey of 2017and 2018
Figure 7: Variable cost comparison of CA method and conventional method
CA CT
Table 8:Total cost of planting for CA tilling method and conventional tilling methods
Items ST PTOS CTB CTT
Width of machine, cm 120 120 60 60
Forward speed, kmh-1 1.16 1.13 1.96 1.96
Total cost of operation, US$ha-1
47 45 77 71
Cost of planting, US$ha-1 43 43 83 173
Production cost, US$ha-1
1069 996 1033 447
Total cost, US$ha-1
1116 1041 1110 518
Gross return, US$ha-1
2519 1784 1565 553
Net profit, US$ha-1
1404 742 425 11
Marginal benefit cost ratio, (MBCR) 2.26 1.71 1.37 1.02 Break-even use, hayr-1
0.06 0.09 0.18 0.49
Payback period, yr 0.07 0.13 0.38 13.39
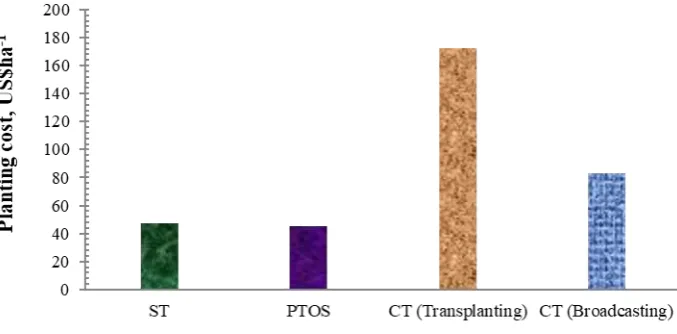
Based on field data, the total cost of ST, PTOS and CT for dry land and wetland tillage were estimated as US$47, US$45, US$77, and US$71 per hectare, respectively. Among cost items, the highest cost was for fuel cost followed by depreciation and operator’s salary. Graphically show the percentage of different cost items of total operational cost and variable cost of CA method and CT method is shown in Figure 8 andFigure 9, respectively.Based on present analysis, the payment for replacement of a new CA machine was estimated as US$156 which is implying that a machine owner has to deposit US$156 per year in a bank account so that he can buy a new machine when the economic life of old CA machine expires for tilling and planting operation. Total fuel cost and operator cost per year was found similar but annual use of machine in the study area of CA tillage methods (ST, PTOS) was higher (24 ha) than that of CT for dry land and wetland tillage methods (10 ha). The annual gross revenue received from machine service was worked out. Comparative scenario of planting cost of different tillage and planting methods is shown in Figure 9. The planting cost of ST, PTOS and CT for dry land and wetland tillage were estimated asUS$43, US$43, US$75, and US$171, respectively. The highest planting cost was found from conventional tillage and seedling transplanting method due to contain transplanting labour cost. The annual gross income received from CA and CT machinery operation was worked out. The highest gross income was estimated per hectare of land area under ST (US$2519) and PTOS (US$1784) method of jute cultivation followed by CTB (US$1565) and CTT (US$553) method. The payback
period was found to be 0.07, 0.13, 0.38 and13.39years for ST, PTOS, CTB and CTT, respectively. Therefore, the
investments of CA machine over power tiller could be recovered in a relatively short span of time by the owners.
Figure 9: Planting cost of different tillage and planting methods
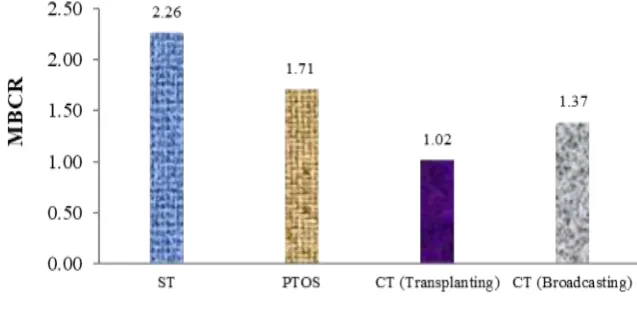
Feasibility of CA machinery for small holder farmers
yields, and also when it reduces or at least does not increase risk. One of the most important aspects of this study was to evaluate the feasibility of CA machinery of jute crop production for small holder farmers in the study area. The result indicates that single pass of CA machines with 9 kW power tiller operation saved time of crop planting, reduction of fuel consumption as well as land preparation cost per hectare over two and half (2.50) passes of power tiller operation. Marginal benefit cost ratio (MBCR) of jute cultivation by different tillage and planting methods is shown in Figure 10. Jute is a cash crop in Bangladesh and farmers get margin by selling jute fiber, jute stalk and jute leaves (as vegetable). The highest MBCR was obtained from strip till planted (2.26) and power tiller operated seeder planted (1.71) plots followed by plot planted by conventional tillage cum broadcasting (1.37) method. The lowest MBCR was found from traditional tillage and manual seedling transplanting method (1.02). The lowest MBCR was found from conventional tillage and seedling transplanting method due to lower fiber and stalk yields were obtained from this method (1.12 t/ha). Based on the fuel consumption, fiber yield, stalk yield and MBCR, ST and the PTOS may be recommended for planting of jute in Khulna region. Therefore, it can be concluded that, the investment on CA machine for both tilling and planting is found economically feasible.
Figure 10: Marginal benefit cost ratio of jute cultivation by different tillage and planting methods
Break-even use of machine
The break-even point measure of investment appraisal exposed that the investment made on CA machine would be profitable only when the machines could tilling and planting at least above level of number of area annually. An attempt was made to calculate break-even point of CA machine operation for machine owner or LSPs based on fixed cost and variable cost of machine operation which are calculated from farm level data on machine price, depreciation cost, interest on investment, machine life, and income from existing crop production cost etc. The break-even use of ST, PTOS, CTB and CTT of machine operation was estimated as 0.06, 0.09, 0.18,
and 0.49ha, respectively of land per year (Table 8). The analysis shows that the annual use of machine was more than the BEP which means the machine make profit to the machine owner or LSPs. It means that at least the estimated area of annual usage is required to reach the break-even point of machine. This analysis also proves that less annual use of machine than the BEP which causes loss. This result also implies CA machine owners to prolong economic life of the machine by taking good care of them and maintenance practices in order to shorten break-even area and also reduce costs over conventional method. Therefore, lower break-even usage under CA machinery operations implies that CA machinery operations at farm level were cost-effective.
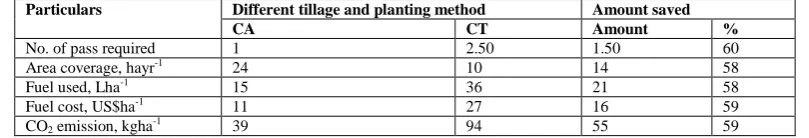
Estimation of environmental benefits
The purposes of conservation agriculture are the reduction of energy consumption and mechanical work, and reduction of the emissions of CO2 and CO gases. Tillage is claimed to be one of main sources of
GHGs emitted in the atmosphere resulting in climate change which, in turn, negatively affects agricultural production (Six et al., 2004).CA based tillage machinery perform seeding operation with minimum disturbance of soil. Less amount of diesel fuel is used in CA tillage system compare to conventional tillage method. The implementation of this CA technology to the practice can lead to the reduction of carbon emission and slow down the process of climate change. Table 9, shows that comparative scenario of number of tilling pass saving of machine operation, amount of fuel consumption as well as CO2 emission in CA system over conventional
crop establishment, carried out by a two-wheel tractor, while in CA tilling and seeding are done in one operation by a two-wheel tractor along with seeder machine with no previous tillage. Less plowing requires tractors to burn smaller quantities of fossil fuels, reducing carbon dioxide emissions. Comparative scenario of jute planting cost and fuel consumption along with number of pass for tilling and planting for each hectare in different tillage and planting methods in the study area is shown in Figure 11.
Table 9: Cost saving, fuel saving and CO2 emission in CA method and CT method in the study areas
Particulars Different tillage and planting method Amount saved
CA CT Amount %
No. of pass required 1 2.50 1.50 60
Area coverage, hayr-1 24 10 14 58
Fuel used, Lha-1 15 36 21 58
Fuel cost, US$ha-1 11 27 16 59
CO2 emission, kgha-1 39 94 55 59
Note:CO2 emission from 1.00 liter of diesel = 2.640 kg
Figure 11: Fuel consumption along with no. of pass for tilling and planting in different tillage and planting
methods
Adapt with climate change
Climate change imposes constraints to development especially among small-scale farmers whose livelihoods mostly dependence on the natural environment (i.e. rain-fed agriculture). Climate change, particularly increasing temperatures, altered rainfall patterns, and climate variability (including extreme climate events) will affect dramatically the productivity of crops. CA practices will provide farmers with alternative management strategies that can help them deal with a changing climate (e.g., droughts or other extreme weather events). One of the largest barriers for widespread adoption of CA systems is the mind set of small holder farmers. Changing of tilling system to take benefit of opportunities offered by climate change or to minimize the vulnerability to extreme conditions is an additional strategy that should be combined consistently with the change of planting date. Table 9 shows that the conservation machineries gave the best results in fuel consumption and emission of CO2 respect to the conventional tillage methods. CA system saved 54% of diesel
fuel and contributed 59% less emission of CO2 into the atmosphere over conventional methods. Erenstein et al.
(2007) found that conservation tillage in India saved 127% of diesel fuel. Conversion from conventional tillage to CA tillage was reported to yield a carbon sequestration rate of 367–3667 kg CO2 ha-1year-1 (Tebrügge and
Epperlein, 2011).CA tilling system will help to mitigate the climate change through carbon sequestration in the soil and reduced CO2 emission through less fuel consumption and less energy requirements. Costs derived from
fuel consumption are significantly reduced by using CA machinery. Besides this, yields increase has a positive impact in the farm incomes, making higher revenues under conservation tillage methods than conventional tillage method. Higher profitability from CA system leads to improvement in the farmers’ livelihoods. Therefore, the implementation of CA tillage practices can lead to the reduction of carbon emission and slow down the process of climate change.
Business opportunity of the custom hiring services of CA machinery
CHS business. Major cost and returns items of CA machine operation business in custom hire entrepreneurship are as follows (Table 10).
Table 10: Estimation of cost for a sample service provider in custom hires service business
Items CA CT
Total machine operating cost, US$ha-1 45 56
Estimated profit, US$ha-1 15 4
Hiring charge, US$ha-1 60 60
Annual use in area, hayr-1 24 10
Gross return, US$yr-1 1440 600
Net profit, US$yr-1 360 40
Based on field data, the estimated machine operating cost of the CA machine operation and power tiller per hectare was found US$45 and US$56, respectively. Machine service rate was calculated on a hectare basis as a common standard practiced by most farmers in the study areas. From the author’s personal interview, common rate of custom hiring charge of a two-wheel tractor service provider in the study area ranged from US$58 to US$64 for dry land preparation. Based on this information, the hiring charge of a CA machine operation was worked out for a sample service provider. The rate of hiring service was considered the conditions of the field being worked, distance and size of field plots, and prevailing rate of local wages. The estimated hiring charge was considered as same US$60 per hectare under CA and CT machines operation for land preparation. The highest net profit was found US$360 per year under CA machine operation than conventional tilling method due to higher annual usage of machine. Graphical view of net profit of different tillage method is shown in Figure 12. The average field capacity and number of passes of machine operation, the average area coverage under land preparation per season was estimated as 24 ha of CA machine operation compared to CT (10 ha). CA tillage methods increased more than 58% of area coverage and 47% more net profit per season over conventional methods. Figure 13show that the break-even uses of machine operation was estimated as 4.69 ha of land per year which is implying that the machine will recover its investment within 4.69 ha of operation. Rest of its life the CA machine will be running on net profit. This indicates that the CA machine have extremely good custom hire service business opportunity for small entrepreneurs and individual farmers. In some part of Bangladesh, the CA machine owners are using this machine for their own land cultivation and earning cash income through custom hiring to other farmers (Miah et al.,2010). In the study area, the farmers or LSPs can start this type of business using CA machinery for vegetable or other crop field preparation.
Figure 13: Economic use of CA machine operation
The profit depends upon the annual use of the machine. Higher the annual usage, lower is the operating cost resulting in higher returns from the machine. Also, the profit of the entrepreneur depends on the socio-economic condition of the machine user as well as the country. Figure 14 shows that the steady increase in the number of hectares under CA over CT in the same season. The higher annual usage under CA machine operation over conventional system which will be increased the total crop production. Besides this, CA based mechanization can play an important role in enhancing the labour productivity of smallholder farmers. From the point of view of the larger area coverage under CA machinery which will create CA based machinery equipment demand. The fabrication procedure of this machinery is very simple and raw materials are locally available. Local manufacturers can easily fabricate. So, new entrepreneur can be also started CA based agricultural machinery equipment business as well as machinery repair and maintenance workshop business. As a result, smallholder farmers can improve their livelihoods and reduction of unemployment with CA machinery equipment business.
Figure 14: Graphical view of the steady increase in area under CA and CT
IV.
CONCLUSION
The CA machinery such as PTOS and ST was found suitable in terms of technical and financial performance over traditional system. The effective field capacity of ST, PTOS and power tiller for dry land and wet land tillage were found to be 0.098, 0.099, 0.10, and 0.090 hah-1, respectively. Less time (3-5 days) and cost (54%) are required under CA tillage system due to fewer tillage passes and cultivation operations for land preparation over conventional system. A saving of fuel consumption by 21 liters per hectare results in reduced fuel cost (58%) and reduced carbon (59%) emitted to the atmosphere. Significantly the highest dry stalk and fiber yields were found from ST planted jute followed by PTOS and conventional tillage cum broadcasting jutes and they were statistically similar. Statistically the lowest stalk and fiber yields were found from jute seedling transplanted plot. The highest net profit per hectare was estimated under ST (US$1404) and PTOS (US$742)
method of jute cultivation followed by CTB (US$425) and CTT (US$11) method. The highest benefit cost ratio
(BCR) was obtained from ST (2.26) and PTOS planted (1.71) jute followed by CTB (1.37) method. The lowest
MBCR was found from CTT method (1.02) of jute. Based on average field capacity and number of passes of
machine operation, the average area coverage under land preparation per season was estimated as 24 ha of CA machine operation compared to CT (10 ha). CA tillage methods increase more than 58% of area coverage and 47% more net profit per season over conventional methods. The result shows that jute production under CA tillage method is profitable venture for small-scale farmers. The break-even use of ST, PTOS and power tiller was estimated as 00.06, 0.09, and 0.18 ha per year which implying that a machine owner has to cultivate more than that amount of land per year for make it profitable. The payback period was also analyzed of ST, PTOS and power tiller to be 0.07, 0.13 and 0.38 years respectively of the machine operation. It means that the CA machine investment would pay for itself after that period. A machine owner, small holder farmer, new entrepreneur or LSP can be improved their livelihood by earn extra income from CA machinery equipment business and custom hiring service for land preparation. It can help the reduction of unemployment in the rural areas of Bangladesh. The hiring charge of CA machines operation for a sample service provider was estimated asUS$60 per hectare. On the basis of custom hiring machinery business, the break-even use of machine operation was estimated as 4.69 ha of land per year which is implying that the machine will recover its investment within 4.69 ha of operation. Therefore, from the summary of this paper it can be concluded that the benefits of CA tillage methods compared to conventional methods of planting of jute crop are more profitable.
ACKNOWLEDGEMENT
This paper as part of Appropriate Scale Mechanization Consortium (ASMC) project ‘‘Appropriate Scale Mechanization Innovation Hub (ASMIH)-Bangladesh’’ is made possible by the support of the American People provided to the Feed the Future Innovation Lab for Sustainable Intensification through the United States Agency for International Development (USAID) and University of Illinois at Urbana-Champaign, USA (Subaward Number: 2015-06391-06, Grant code: AB078). Program activities are funded by the United States Agency for International Development (USAID) under Cooperative Agreement No. AID-OAA-L-14-00006.
REFERENCES
[1]. Ahmed, S., Matin, M.A., Roy, K.C., Amin, M.N., Islam, M. S. and Islam, M.S. (2005). Field performance test of power tiller operated planter for maize, wheat and pulses crop. Annual Research Report, Bangladesh Agricultural Research Institute (BARI), Joydebpur, Gazipur-1701, Bangladesh
[2]. AIS (2017). Krishi Diary-2017. Agricultural Information System, Khamarbari, Farmgate, Dhaka-1215.
[3]. Aravindakshan, S., Rossi, F., Krupnik, T.J. (2015). What does benchmarking of wheat farmers practicing conservation tillage in the eastern Indo-Gangetic Plains tell us about energy use efficiency? An application of slack-based data envelopment analysis energy. 90:483-493.
[4]. Barnard, C.S., and Nix, J.S. (1980). Farm planning and control (2nd ed.). London-New York-Melbourne: Cambridge University Press, Cambridge, United Kingdom.
[5]. BBS (2015). Statistical Year Book of Bangladesh. Bangladesh Bureau of Statistics. Statistics Division, Ministry of Planning, Government of the People’s Republic of Bangladesh.
[6]. Buckwell, A., Nordang, Uhre., A., Williams, A., Polakova, J., Blum, W.E.H., Schiefer, J., Lair, G.J., Heissenhuber, A., Schießl, P., Kramer, C. and Haber, W. (2014). The sustainable intensification of European agriculture. Available at: http://www.ieep.eu/assets/1404/111120_BROCH_SUST_INTENS_DEF.pdf;accessed 23/11/2015.
[7]. Chivenge, P., Murwira, H., Giller, K., Mapfumo, P. and Six, J. (2007). Long-term impact of reduced tillage and residue management on soil carbon stabilization: implications for conservation agriculture on contrasting soils. Soil Till. Res. 94(2):328-337.
[8]. Dillon, J.L. and Hardaker, J.B. (1993). Farm management research for small farmer development, FAO, Rome.
[9]. Erenstein, O., Farooq, U., Malik, R. K. and Sharif, M. (2007). Adoption and impacts of zero tillage as a resource conserving technology in the irrigated plains of South Asia. Colombo, Sri Lanka. International Water Management Institute. p.55. (Comparative Assessment of Water Management in Agriculture Research Report 19).
[10]. Gathala, M.K., Ladha, J.K., Kumar, V., Saharawat, Y.S., Kumar, V., Sharma, P. K., Sharma, S. and Pathak, H. (2011). Tillage and crop establishment affects sustainability of South Asian rice–wheat system. Agron. J. 103: 961–971.
[11]. Gathala, M.K., Timsina, J., Islam, S., Rahman, M., Hossain, I., Harun-ar-Rashid, Ghosh, A.K., Krupnik, T.J., Tiwari, T.P. and McDonald, A. (2015). Conservation agriculture based tillage and crop establishment options can maintain farmers’ yields and increase profits in South Asia’s rice–maize systems: evidence from Bangladesh. Field Crops Res. 172, 85–98.
[12]. Grace, P.R. (2003). Rice-wheat system and climatic change. In Addressing Resource Conservation Issues in Rice-Wheat Systems of Sough Asia: A Resource Book, Rice-Wheat Consortium for the Indo-Gangetic Plains. Intl. Maize and Wheat Impr. Cent., New Delhi, India. pp 63-67
[13]. Gurung, T.R., Kabir, W. and Bokhtiar, S.M. (eds.). (2017). Mechanization for Sustainable Agricultural Intensification in SAARC Agriculture Centre, Dhaka, Bangladesh, p.302
[14]. Hobbs, PR. and Govaerts, B. (2010). How conservation agriculture can contribute to buffering climate change. Climate change and crop production 1
[15]. Hossain, M. I., Haque, M. E., Meisner, C. A., Sufian, M. A., and Rahman, M. M. (2005). Strip tillage planting method for better wheat establishment. Journal of Science and Technology, 3:91-95.