ISSN: 1793-8236
169 Abstract— Speech disability is one of the widely encountered disabilities among the disabled children. In this study, adaptive signal processing is used to tune the speech signal of disabled children into curve fitted speech signal of normal child by implementing feedback mechanism technique. The curve fitted speech signal constants of normal child is compared to tuned constant values of disabled child and the deviation is calculated using correlation technique. The amount of deviation represents the severity of speech disability in children compared to a normal child. The speech therapy can be given to the speech disabled children to improve the utterance capability.
Index Terms— Adaptive signal, Correlation, Filter Bank, Spectrogram, Speech disability
I. INTRODUCTION
Speech is one of the very common means of communication between humans in any civilized society. In speech communication an idea is first formed in the mind of speaker and then it is transformed into words, phrases and sentences according to the grammatical rules of the language. However in our society, many people are suffering from disabilities related to speech communication. Speech disability forms one of the widely encountered among the various disabilities among children [18-6]. Various techniques for speech reproduction were researched by several researchers over the years like articulation density index [2], Hidden Markov model [9-22], Hidden Bernoulli model [14]. Extract the vocal parameters from recorded speech sound for the vocal disorder, speech assessments and some neurological pathologies identification [7].Examine both excitation and vocal tract characteristics for overall pathology assessment using a hidden Markov model(HHM) recognizer[8].Acoustic signal analysis using artificial neural network technique in the task of recognition of selected types of vocal tract pathologies[31]. This research work is mainly
Manuscript received April 8, 2010
Anandthirtha B. Gudi, Professor in the Department of Electronics and Communication Engineering, Sri Bhagawan Mahaveer Jain College of Engineering, Bangalore, Karnataka, India (Phone: 0091 80 27577200; Fax: 0091 80 27577199 ; [email protected])
H.K.Shreedhar, Assistant Professor in the Department of Electronics and Communication Engineering, Sri Bhagawan Mahaveer Jain College of Engineering, Bangalore, Karnataka, India (Phone: 0091 80 27577200; Fax: 0091 80 27577199; [email protected])
Dr. H. C. Nagaraj, Principal, Nitte Meenakshi Institute of Technology, Bangalore, Karnataka, India (Phone: 0091 80 28563616 ; Fax: 0091 80 28461274 ; [email protected])
focused on the speech disability severity observed in children of age between five to eight years (pathological subjects) and measurement of such speech disability severity in comparison with the normal fit children (normal subjects) of the same age group.
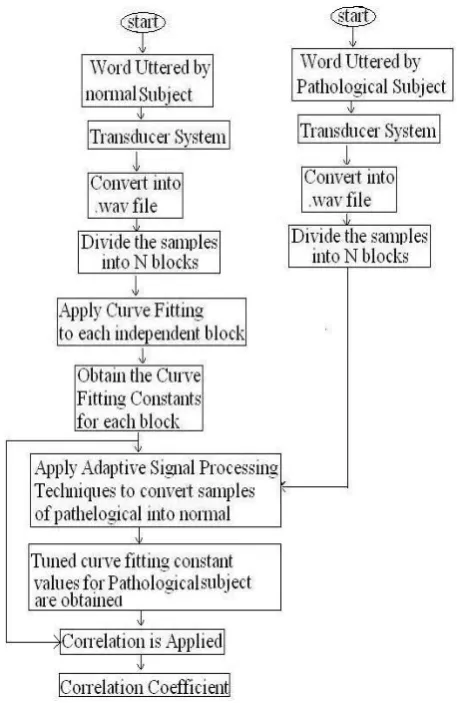
In this paper the speech uttered by children of age group five to eight years was recorded and digitized. The digitized signal was further processed in high level computational platform MATLAB. In section II the procedure of speech recording and digitization were explained; In section III spectrogram has been discussed; section IV deals with curve fitting procedure for speech signals; section V deals with adaptive signal processing technique; section VI deals with creation of an image using speech signal samples; VII deals with speech signal processing through the filter bank; in section VIII obtained results are discussed and conclusions were drawn in section IX. This study is a new technique and unique in its kind to assess the speech disability. The flowchart presented as figure 1 describes the present work.
Figure 1. Methodology to obtain correlation between the normal and pathological subjects
Signal Processing Techniques to Estimate the
Speech Disability in Children
170 II. SPEECH RECORDING PROCEDURE
Speech signals are continuous signals in time domain. To convert such signals into discrete time signals, Analog to Digital (A to D) converters are used. Current state of the art recording devices such as Intelligent Portable Occular Device (IPOD) has built in advanced A to D converter. This device is used for the creation of speech signal at discrete intervals of time.
The study was conducted on children of native speakers of Kannada language (Indian Dravidian Language which has recognized as classical language recently) Acoustic speech signal of word “Namma” uttered by normal subject and pathological subjects(age between five to eight years) are recorded using IPOD recorder in digital form.
The data was collected at J.S.S. ‘Sahana’ integrated and special school located at Bangalore, India. Prior to the data collection, the teachers were requested to train and acclimatize the disabled children of age between five to eight years facing speech disability problem, to read few sentences written in Kannada language. The experiment was conducted in a pleasant atmosphere, the children are made to read the sentences and the said sentences were recorded. Similarly the normal samples were obtained at ‘vinayaka’ school, Bangalore by following the same procedure with the normal children in the same age group. About 30 samples were taken in all for normal cases. The averages of these samples were taken and the child’s voice which nearly coincides with the average is considered as reference data mentioned as ‘normal’. However, the data after conversion should be made easy to use, manipulate, low loss and compatible to windows platform. The recorded digitized signal is further subjected to transformation into wav file, the most commonly used digitized sound format with the help of downloadable software known as “GOLDWAVE”. The transformation procedure used in GOLDWAVE software results in .wav file format. Table-1 shows the parameters of .wav file obtained.
TABLE I.THE PARAMETERS USED FOR TRANSFORMATION INTO .WAV FILE
Rate[kbps] 512 Amplitude type[bit] 16
Sampling Frequency[Hz] 32000
Channel Mono
Modulation Pulse Coded
III. SPECTROGRAM
A spectrogram is an image that shows how the spectral density of a signal varies with time.The spectral intensity at each point in time is indicated by the intensity (darkness) of the plot at a particular analysis frequency. During the periods of unvoiced speech high-frequency energy is seen in the spectrograms; during periods of silence no spectral activity (because of the reduced signal level) is seen.
Creating a spectrogram using the STFT is usually a digital process. Digitally sampled data, in the time domain, is broken up into blocks, which usually overlap, and Fourier transformed to calculate the magnitude of the frequency
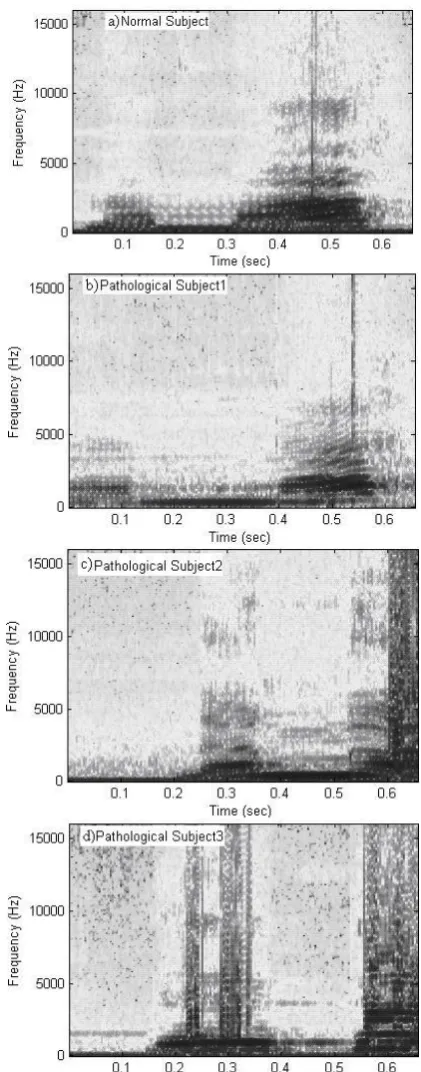
spectrum for each block. Each block then corresponds to a vertical line in the image; a measurement of magnitude versus frequency for a specific moment in time. The spectrums or time plots are then "laid side by side" to form the image or a three-dimensional surface. The spectrogram is given by the squared magnitude of the STFT of the function. Spectrogram has been obtained for the word “Namma” uttered by normal subject, pathological subject1, pathological subject2 and pathological subject3.Such spectrograms are shown in figure 2 (a), 2(b), 2(c) and 2(d) respectively.
Figure 2. a) Spectrogram of Normal Subject b) Spectrogram of pathological Subject1 c) Spectrogram of pathological Subject2 and d) Spectrogram of pathological Subject3
ISSN: 1793-8236
171 spectrogram of pathological subject 1 is closer to that of normal subject with less distortion. Spectrogram of pathological subject 2 is seen to be more deviated from that of normal subject with moderate distortion. Spectrogram of pathological subject 3 is seen to be most deviated and highly distorted from that of normal subject.
From the above we can conclude that the speech disability severity is mild with pathological subject 1, moderate with pathological subject 2 and severe with pathological subject 3 in comparison with normal subject.
IV. CURVE FITTING PROCEDURE
Recorded acoustic speech signals for Kannada word ”Namma” uttered by the normal subject is taken and MATLAB curve fitting tool (cftool) is used to achieve the better curve fitting for the same. To have better curve fitting with confidence level of more than 90% and with a minimum value of Root Mean Squared Error (RMSE), the sample sequence set is divided in to few number of windows. Each window must consist of some suitable number of samples.
The curve fit techniques such as Gaussian, Polynomial, Interpolent Cubic Spline, Rational, and Sum of Sine Functions have been applied in the present study and it was found that the sum of sine function technique give the best curve fit for speech signals along with curve fit coefficients. From so obtained curve fit coefficients mathematical equation can be derived for the speech signal. Though the Interpolent Cubic Spline technique yields better curve fit for speech signal curve fit coefficients can not be obtained. Hence the sum of sine function technique was adopted for curve fitting in this study. This is clearly evinced in the present study. The mathematical function (sum of sine functions) given in the equation (1) is used to get proper curve fitting with the above said window samples.
) 8 8 sin( 8 ... ) 2 2 sin( 2 ) 1 1 sin( 1 c Xnj b a c Xnj b a c Xnj b a + + + + + + (1)
a1 to a8, b1 to b8, and c1 to c8 are constants, Xnj represent the
sample sequence, where j=1, 2, 3 …
V. ADAPTIVE SIGNAL PROCESSING
An adaptive system is the one, whose structure is alterable in such a way that the performance improves through contact with its environment. In other words, the main property of the adaptive system is its time – varying and self – adjusting performance. Adaptability is a main property of most of the biological systems. More recently adaptive signal processing algorithms are being implemented. The aim of all adaptive signal processing algorithms is to reduce the error as small as possible. This has to be done by adapting the input signal such that the system output is very similar to the desired signal. The required information pertaining to the difference of actual signal and the required signal is transferred into a set of adjustable system coefficients. Following are the some of the application examples of adaptive signal processing. a) System identification b) Inverse system identification c) Prediction d) Interference cancellation.
The “sum of sine function” can be rewritten to suite for different windows of pathological subject as equation (2) as shown below. ) 8 8 sin( 8 .... ) 2 2 sin( 2 ) 1 1 sin( 1 c jXpj q a c jXpj q a c jXpj q a + + + + + +
(2)
Xpj represents the speech signal samples sequence set of
pathological subject where j=1, 2, 3
To adapt the pathological subject’s sample values into that of normal subject, equation (1) and (2) are equated.
) 8 8 sin( 8 ).... 2 2 sin( 2 ) 1 1 sin( 1 ) 8 8 sin( 8 ... ) 2 2 sin( 2 ) 1 1 sin( 1 c jXpj q a c jXpj q a c jXpj q a c Xnj b a c Xnj b a c Xnj b a + + + + + = + + + + + + (3)
From the Equation (3) it can be assumed that
) 8 8 sin( 8 ) 8 8 sin( 8 ... ) 2 2 sin( 2 ) 2 2 sin( 2 ) 1 1 sin( 1 ) 1 1 sin( 1 c jXpj q a c Xnj b a c jXpj q a c Xnj b a c jXpj q a c Xnj b a + = + + = + + = +
The values q1j, q2j, q3j……p8j can be tuned as follows:
q1j= b1Xnj/ Xpj, q2j= b2Xnj/ Xpj , …. q8j= b8Xnj/ Xpj
If the pathological sample value is zero, then it is equated to unity to avoid the error in the division process
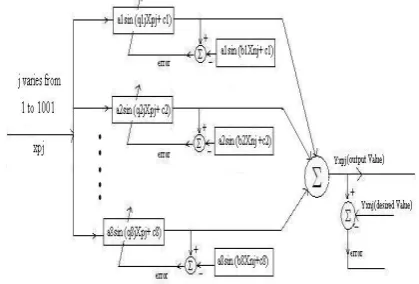
The block diagram of the above said adaptive process is shown in figure 3
Figure 3. Adaptive process to tune the utterance sample values of pathological subject into normal
172
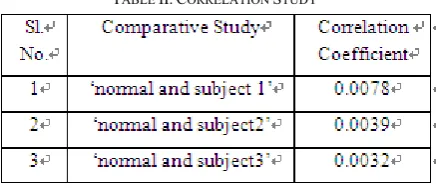
TABLE II.CORRELATION STUDY
VI. CREATION OF AN IMAGE USING SPEECH SIGNAL
SAMPLES
Total numbers of 21100 speech signal samples obtained for the uttered word “Namma” are squared and logarithm to the base 10 is applied to each of them. Then matrix of dimension 100 X 211 has been created. This matrix has been utilized to create the image. This procedure is applied for all the subjects. Obtained diagram in each case is shown in figure4
Figure 4. Image obtained using speech signal samples of
a) Normal subject b) Pathological subject 1 c) Pathological subject 2 and d) Pathological subject 3
By visualizing the above images following observations are drawn.
1) Image of pathological subject 1 is seen to be closer to image of normal subject.
2) Image of pathological subject 2 is seen to be moderately deviated from that of normal subject.
3) Image of pathological subject 3 is seen to be heavily deviated from image of normal subject.
From the above we can conclude that the speech disability severity is mild with image of pathological subject 1, moderate with image of pathological subject 2 and severe with image of pathological subject 3 in comparison with normal subject.
VII. SPEECH SIGNAL PROCESS THROUGH THE FILTER BANK
A Finite Impulse Response (FIR) filter with band limit between 30Hz to 3400Hz is designed and speech signal samples of normal subject are passed through the filter. The same procedure is employed to obtain individual sample sequence for each pathological subject. Then correlation coefficient value is calculated between the absolute values of filter out put obtained for normal subject and that of pathological subject. The results are tabulated in TableIII.
TABLE III.CORRELATION COEFFICIENT OF DIFFERENT CASES
FIR filter bank is obtained by four FIR band pass filters designed with Hamming Window. The pass band limits of each filter is tabulated in TableIV.
TABLE IV.FILTER BANK DETAILS
Filter No. Lower cutoff frequency
Upper cutoff frequency FIR Band pass
fiter-1 30 Hz 900 Hz
FIR Band pass
fiter-2 900 Hz 1800 Hz
FIR Band pass fiter-3
1800 Hz 2700 Hz
FIR Band pass fiter-4
2700 Hz 3400 Hz
ISSN: 1793-8236
173
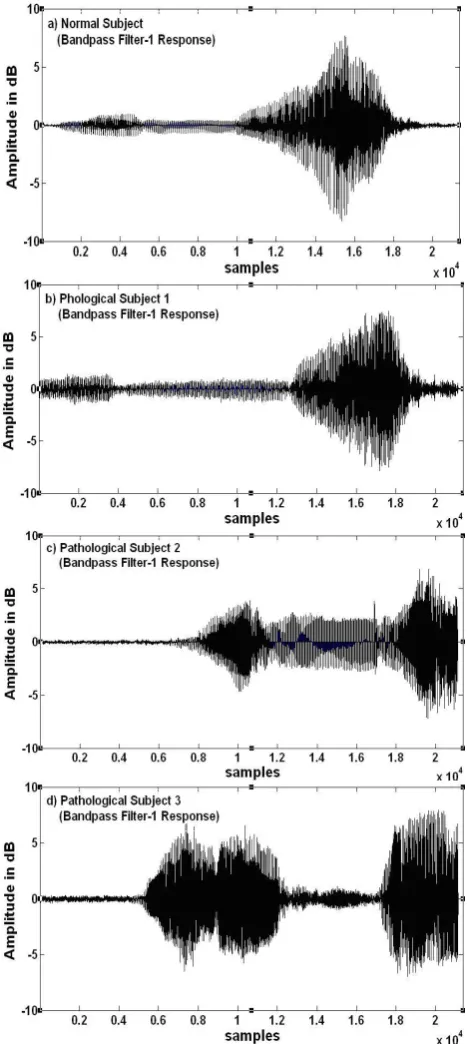
Figure 5 Band pass filter-1 response for a) Normal subject speech sample sequence b) Pathological subject-1 speech sample sequence c) Pathological subject-2 speech sample sequence and d) Pathological subject-3 speech sample sequence.
174
Figure 7 Band pass filter-3 response for a) Normal subject speech sample sequence b) Pathological subject-1 speech sample sequence c) Pathological subject-2 speech sample sequence and d) Pathological subject-3 speech sample sequence.
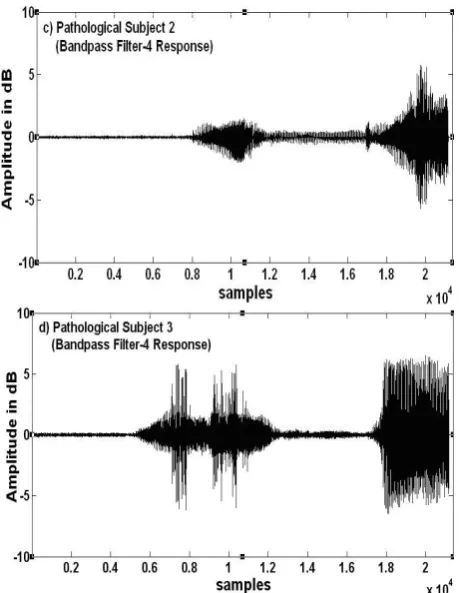
Figure 8 Band pass filter-4 response for a) Normal subject speech sample sequence b) Pathological subject-1 speech sample sequence c) Pathological subject-2 speech sample sequence and d) Pathological subject-3 speech sample sequence
Correlation coefficient values obtained with filter bank is more effective and speech disability severity measure can be done very effectively compared to a single bandpass filter. With filter bank method also, the speech disability severity observed is mild, moderate and severe in pathological subject 1, subject2 and subject 3 respectively in comparison with normal subject.
TABLE V. CORRELATION COEFFICIENT OF DIFFERENT CASES USING FILTER BANK
Comparative Study Between
Bandpass Filter Number and Band width
Correlation Coefficient
Normal child and pathological subject-1
Bandpass Filter-1 30Hz – 900Hz
0.5263
Bandpass Filter-2
900Hz – 1800Hz
0.5523
Bandpass Filter-3
1800Hz – 2700Hz
0.5521
Band pass Filter-4
ISSN: 1793-8236
175 3400Hz
Normal child and pathological subject-2
Band pass Filter-1
30Hz – 900Hz
0.0753
Band pass Filter-2
900Hz – 1800Hz
-0.123
Band pass Filter-3
1800Hz – 2700Hz
-0.124
Band pass Filter-4
2700Hz – 3400Hz
-0.129
Normal child and pathological subject-3
Band pass Filter-1
30Hz – 900Hz
-0.290
Band pass Filter-2
900Hz – 1800Hz
-0.295
Band pass Filter-3
1800Hz – 2700Hz
-0.294
Band pass Filter-4
2700Hz – 3400Hz
-0.263
VIII. DISCUSSION
By increasing the number of filters in filter bank with in the specified frequency band width (30Hz to 3400Hz) assigned for the filter bank, speech disability severity can be measured more accurately.
If correlation coefficient is a positive value and close to unity then speech disability will be mild and if correlation coefficient is small positive value or small negative value then speech disability will be moderate. If correlation coefficient is more negative, then speech disability will be very severe.
From the tabulated results in Table-2, Table-3 and Table-5 we can conclude, Pathological subject-1 is having mild speech disability, Pathological subject-2 is having moderate speech disability and Pathological subject-3 is having severe speech disability.
IX. CONCLUSION
This study helps the speech therapist to distinguish the pathological subjects suffering from speech disability from normal subjects. Adaptive signal processing techniques lead to better accuracy and precision in assessing the speech disability of a subject. This also helps in knowing the level of severity of speech disability.
APPENDIX
MATLAB programme to create an image/Pattern using
speech signal samples
clear; clc; figure;
x=wavread('Normal Subject.wav'); %Start point and End point of the speech %Segment for the uttered word “Namma”is %given below
y=x(1302720:1323819); yy=y.*y;
y1=-log10(yy);
z1=reshape(y1,100,211); subplot(2,2,1);
imshow(z1);
xlabel('Normal Subject');
x1=wavread('Pathological Subject1.wav'); %Start point and End point of the speech %Segment for the uttered word “Namma”is %given below
y2=x1(353280:374379); yy1=y2.*y2;
y3=-log10(yy1);
z2=reshape(y3,100,211); subplot(2,2,2);
imshow(z2);
xlabel('Pathological Subject1');
x2=wavread('Pathological Subject2.wav'); %Start point and End point of the speech %Segment for the uttered word “Namma”is %given below
y4=x2(613120:634219); yy2=y4.*y4;
y5=-log10(yy2);
z3=reshape(y5,100,211); subplot(2,2,3);
imshow(z3);
xlabel(' Pathological Subject2');
x3=wavread(' Pathological Subject3.wav'); %Start point and End point of the speech %Segment for the uttered word “Namma”is %given below
y6=x3(1116800:1137899); yy3=y6.*y6;
y7=-log10(yy3);
z4=reshape(y7,100,211); subplot(2,2,4);
imshow(z4);
xlabel(' Pathological Subject3');
ACKNOWLEDGMENT
176 REFERENCES
[1] Adrian Jon Brown, “Spectral Curve Fitting for Automatic Hyper spectral Data Analysis”, IEEE Transactions on Geosciences and Remote sensing, June2008, Vol. 44, No.6, pp. 1601-1068.
[2] J. B. Allen, “How do humans process and recognize speech“, IEEE Transactions on Speech and Audio Processing, October 1994, vol. 2, No 4, pp. 567-577
[3] Anandthirtha B. Gudi, Sayanu Pamidighantum and H. C. Nagaraj, “Graphical Determination of condition for Severity in Speech Acoustic Signals using DSP Techniques”, International Conference on Advance Communication and Informatics, Vellore, India, January 11-13, 2009, pp. 149-156.
[4] B. S. Atal and Suzanee L. Hanauer, “Speech Analysis and Synthesis by Linear Prediction of the Speech Wave”, Journal of the Acoustical Society of AmericaApril 1971, pp. 637-655.
[5] Ben Gold and Nelson Morgan, “Speech and Audio Signal Processing (Processing and Perception of Speech and Music)”, John Wiley & Sons, Inc.2006.
[6] CHERIF Adnbne-Botiafif and Lamia-Mhamdi mounir, “Analysis of Pathological Voices by Speech Processing, IEEE, 2003, pp. 365-367. [7] CHERIF Adnne, Botiafif Lamia and Mhamdi mounir “Analysis of
Pathological Voices by Speech Processing”, IEEE Transactions 2003, pp.365 – 368
[8] ) Eric J. Wallen and John H.L. Hansen “A Screening Test for Speech Pathology Assessment Using Objective Quality Measures”, IEEE Transactions, pp.776 – 779.
[9] Y. Ephraim, D. Malah, and B. H. Juang, “On the application of hidden Markov models for enhancing noisy speech”, IEEE Transactions on Speech and Audio Processing, October 1989, vol. 37, pp. 1846-1856. [10] B. Garcia, J. Vicente, I. Ruiz, A. Alonso, “Multiplatform Interface
Adapted ToPathological Voices”, IEEE Symposium on Signal Processing and Information Technology, 2005, pp. 912-917.
[11] Gauan Sheng Uei and Kiruthika Ramanathan, “Recursive Percentage Based Hybrid Pattern (RPHP) Training for Curve Fitting”, Proceedings of the 2004 IEEE Conference on Cybernetics and intelligent Systems, Singapore, 1-3 December, 2004, , pp. 445-450.
[12] Harry Levitt, “Speech Processing Aids for the Deaf an Overview” IEEE Transactions on Audio and Electroacoustics, June 1973, Vol. Au-21, No.3, pp. 269- 273.
[13] P. Hruska, Z Chobola and L. Grmela, “Diode I-U Curve Fitting with Lambert W Function”, Proceedings of 25th International conference on
Microelectronics (MIEL2006), Belgr, De, Serbia and Montenegro, 14-17,May,2006.
[14] J. Kabudian, M. M. Homayounpour and S.Mohammad Ahadi, “Time-Inhomogeneous hidden Bernoulli Model: An Alternative to Hidden Markov Model for Automatic Speech recognition”, Proceedings of ICASSP, 2008, pp. 4101-4104.
[15] Keshtkar and A. Maghoual, “Simulation and Derivation of Typical Photonic Bandgap Structure’s Design Parameters Using Curve Fitting Method”, International Symposium on Telecommunications, IEEE 2008, pp. 144-149.
[16] T.Kobayashi, J. Furuyama and K. Masumitsu, “PartlyHidden Markov Model and its application to speech recognition”, IEEE, 1991, pp. 121-124.
[17] R. Kumrisan and C.S.Ramalingam, “On separating voiced-speech into its components”, IEEE, 1993, pp.1041-1046.
[18] Lawrence Rabiner and Biling Hwang Juang, “Fundamentals of Speech Recognition”, second Impression, published by Dorling Kindersley(India) Pvt. Ltd., Licensees of Pearson Education in South Asia.2007.
[19] Lei Ding, Wen-De Zhong, Chao Lu and Yixin Wang, “A New Bit Rate Monitoring Method Based on Histograms and Curve Fitting”, Singapore, ICICS-PCM 2003,15-18 December 2003, , pp. 1290-1292. [20] Nbhan D. Salih and David Chek Ling Ngo, “A novel method for shape representation” GVIP 05 Conference, 19-21, CICC, Cairo, Egypt, December 2005.
[21] J. Picone “Continuous speech recognition using Hidden Markov Models”, IEEE, ASAP Magazine, July 1990, , pp. 26-41.
[22] N. Ratnayake, M. Savic, J. Sorensen, “Use of Semi- Markov Models for speaker-independent phoneme recognition” IEEE, 1992, , pp. 565-568.
[23] M. Robert ITO, R. W. Donaldson, “Zero-crossing measurements for analysis and recognition of speech sounds”, IEEE Transactions on Audio and Electroacoustics, 1971, Vol. 19, No.3, pp. 235-242. [24] Ronald W. Schlffer, Member, IEEE, “A Survey of Digital Speech
Processing Techniques”, IEEE Transaction on Audio and Electro acoustics, March,1972, Vol. Au-20, No. 1, pp. 28-35.
[25] Rubina Sultan, Noor M. Khan and Muhammed Shafiq, “Low Duty-Cycling with Spline-based Curve Fitting of Sensor Data in Wireless Sensor Networks”, IEEE Computer Society ,Fourth International Conference on Networked Computing and Advanced Information Management,2008, , pp.497-501.
[26] Salam. Z , “An on-line Harmonics Elimination PWM Scheme for Three-Phase Voltage Source Inverter Using Quadratic Curve Fitting”, The 30th Annual Conference of the IEEE Industrial Electronics Society,
Busan, Korea, November 2-6, 2004, , pp 704-708.
[27] K.Steiglitz, G. Winham and J.Petzinger, “Pitch Extraction by Trigonometric Curve Fitting”, IEEE Transactions on acoustics, speech and signal processing, pp.321-323, June 1975.
[28] Susanna Varho and Paavo Alku, “Regressive Linear Prediction with Triplets-An Effective All-Pole Modeling Technique for Speech Processing”, IEEE, 1998, pp. IV- 194 – IV-197.
[29] Tong Zhou, “Estimation of 1/f Signals on the Basis of Curve Fitting”, IEEE Transactions on Signal Processing, March 2000, , Vol. 48, No. 3, pp. 617-628.
[30] Wan-Ying Huang and Robert Kaczmarek, “Equivalent Circuits for an SLG Fault Distance Evaluation by Curve Fitting in Compensated Distribution Systems”, IEEE Transactions on Power Delivery April, 2008, , Vol. 23, No 2, pp. 601-608.
[31] Wieslaw Wszolek, Ryszard Tadeusiewicz, Andrzej Izworski and Tadeusz Wszolek “Automated Understanding of Selected Voice Tract Pathologies Based on the Speech Signal Analysis”, 2001 Proceeding of the 23rd Annual EMBS International Conference, October 25-28,
Istanbul, Turky, pp.1719 – 1722
[32] Yuanning Liu, Senmiao Yuan and Xiaodong Zhu, “A Time-frequency Field Fingerprint Enhancement Technology and Three-order Spline Curve Fitting Matching Algorithm Research”, IMTC 2003 Instrumentation and Measurement Technology Conference, Vail, Co, USA, 20-22 May 2003, pp.1067-1069.
[33] http://www.disabilityworld.org/06-08-03 children/unicef.shtml [34] http://www.hindu.com (dated 1st Nov 2008)
[35] http://www.goldwave.com/
Anandthirtha B. Gudi obtained Bachelor of Engineering from
S.J.M.Institute of Technology, Chitradurga, Mysore University. Master of Engineering from U.V.C.E, Bangalore, Bangalore University. Professor in the Department of Electronics and Communication Engineering, Sri Bhagawan Mahaveer Jain College of Engineering, Bangalore, Karnataka, India.
H.K.Shreedhar obtained Bachelor of Engineering from U.V.C.E. Bangalore, Bangalore University.Master of Engineering from B.M.S.C.E., Bangalore, V.T.U. Assistant Professor in the Department of Electronics and Communication Engineering, Sri Bhagawan Mahaveer Jain College of Engineering, Bangalore, Karnataka, India.