Priority Based Congestion Control and Bandwidth
Normalisation in WBAN
1
Ravinder Kaur,
2Harmandeep Singh
1,2Dept. of ECE, Global Institute of Management and Emerging Tech., Amritsar, Punjab, India
Abstract
WBAN is a milestone in medical science since it makes the task of physicians easy to monitor their patients without attending them physically. WBAN is made up of small/ tiny sensors which act as nodes in the network and are responsible to perform the data transmission in the network among nodes source and sink nodes. The performance of the WBAN should be effective and reliable because it is used in real life scenarios. There are various issues that can leads to the degradation in the performance of the WBAN. Various trends had been developed in this area to
enhance the efficiency of the network by considering various
factors or parameters. But the not all the mandatory parameters were covered under them. In this study we proposed a graphical user interface based technique in order to consume the bandwidth
of the network in an efficient way. The proposed technique works
on the basis of priority of the data and the size of the data along with the size of the bandwidth. The transmission of data starts with the highly prior data and simultaneously the data with the low priority is also placed over the transmission channel along with the prior data. This paper comprises of an introductory part to the WBAN, the various issues that can decrease the performance and quality of the network. The result section is simulated by using the MATLAB and proves that the proposed outperforms the traditional work with respect to the number of dead nodes in the network, delay in the network, and number of data packets received at the base station.
Keywords
Wireless Body Area Network, Bandwidth, Priority of Data, Delay
I. Introduction
WSN stands for wireless sensor network. It has the ability of monitoring physically large areas or surroundings, accessing remote places, real-time reacting, and relative ease of use [1].
WSN is used in various fields such as in military activities like
reconnaissance, target acquisition, environmental activities such
as forest fire prevention, geophysical physical activities such as volcano activity study, biomedical related fields such as health data monitoring or artificial retina or civil engineering such as
structural health measurement [2].
WBAN is a Body Area Network in which some sensors are implanted on the body of the patient in order to sense or monitor the working of various human organs [3]. Sensor is a device which is quite small in size and transfers the sensed data to the server [4]. WBAN facilitates the doctors and patient to communicate on a wireless network. These sensors can be placed on the body or inside the body [5]. The data collected by the sensors are sensitive
and confidential hence in some of the countries there is law to
protect this data [6]. The sensor nodes are responsible to transmit the data to the base station [7].
II. Issues in WBAN
There are some aspects that can effects the performance, reliability
and efficiency of the system in negative way i.e. degrades the
performance and lifetime of the network [8]. This section lists some of the aspects out of them.
Energy Consumption
•
Data traffic •
PDR (Packet delivery Ratio)
•
Lifetime or existence of nodes
•
Delay
•
A. Energy Consumption by Nodes
The amount of energy consumed by nodes affects the performance of the network [9]. If nodes consumes the energy in access than the energy of the network will exhausted earlier this leads to the termination of processing. If the amount of energy consumed by nodes is higher than the lifetime of the network will be affected [10].
B. Data Traffic
In a network data traffic occurs when the nodes delivers the data simultaneously [11]. Data traffic leads to the delay in data delivery.
Hence the performance of the network gets degraded.
C. Delay
If there is any delay in delivery of data then it means that the data is not reaching to the sink or base station when it is required [12]. Delay in data delivery can affects the process of decision making at the server side.
D. Packet Delivery Ratio
Packet Delivery ratio defines the ratio or amount of the packets
delivered to the destination node [13]. If the packet delivery ratio is low then it degrades the performance of the network.
E. Lifetime of Nodes
Lifetime of nodes is determined by the amount of remaining energy at the nodes. If the remaining energy at a node is zero then the node will be declared as dead node [14]. If nodes consumes higher amount of energy for data transferring or communication then the amount of remaining energy will be nil due to which the nodes will be declared as dead [15]. The greater number of dead nodes in a network leads to the slower processing and degrades the process of the networks.
III. Problem Formulation
WBAN is a wireless body area network. The system consists of sensor nodes. There are various factors that effect the processing and performance of the WBAN such as energy consumption,
packet delivery ratio, delay in data delivery data traffic, lifetime
of the nodes, throughput of the network, number of dead nodes in
the network etc. There are lot of work had been done in this field to enhance the efficiency and reliability of the network. Hence
the factors that were focused by the traditional work are like to
control the data traffic over network to prevent the network from
congestion. Which gives birth to the strategy that the data was transmitted on the priority basis and then the data with high priority
to the delay in data delivery, and inappropriate use of bandwidth allotted to the network for data transmission. Hence there is a requirement to develop such a technique or strategy which can make the appropriate use of bandwidth and also eliminates the concept of waiting for the low priority data.
IV. Proposed Work
After having a review to the above section which defines the problem
or issues that exist in WBAN while making the communication or transferring the data between the sink node and the nodes of the network. As we all knows that the WBAN is consisting of small nodes or sensors which connects to each other and creates a path which is followed to transfer the data to the base station. But in traditional systems the bandwidth allotted for the data transmission were not utilized properly as the data was transmitted on the priority basis that the data with high priority was allowed to reach
the destination first and hence the data with the low priority has to
wait for its turn. Hence the proposed work considers the concept of bandwidth and aims to consume the allotted bandwidth properly. In proposed system the data with high priority and the data with the low priority is moving towards the base station at the same instance but this depends upon the size of the data totally. For better understanding let us consider an example suppose there is high prior data of 64 bit and the size of the allotted bandwidth is also 64 bit then in such case the data with high priority will be transferred to the base station. But in case where the data has high priority but the size of the data is 32 bit then in this the data of low priority whose size is 32 bit will send with the highly prior
data. In this way the bandwidth is consumed efficiently as well as
there is no need to wait the low prior data for its turn.
V. Methodology
Proposed technique has followed the method in which low priority along with high priority node has been sending data concurrently without being delay in the network. Methodology for the proposed technique is as follows:
First step is to initialize the network parameters by entering 1.
the initial parameters like initial energy of the nodes, number of nodes in the network, number of rounds etc. On the basis of the given values the network will be initialized or created. After this the next process is to allot the data packets of 2.
different size to the each and every node. The size of the data packets must be different to each other so that the packets can transmits simultaneously on the bandwidth.
In this step the evaluation of the fitness function takes place.
3.
The fitness value is evaluated to elect the forwarder node
from the nodes.
Compare fitness value with threshold value and checks
4.
whether the Fitness is equal or greater than threshold if yes
move to the next step and if not then again evaluate fitness
of particular sensor node.
If fitness is equal or greater than threshold value choose node
5.
as a forwarder node which will sent the information to the Base station.
Then sends high priority along with low priority data to 6.
the receiver based on the size of the bandwidth and packet size.
Apply bandwidth utilization approach in order to sends high 7.
priority data nodes along with low priority data nodes so
that bandwidth can be utilized in efficient way. Moreover
congestion can also be controlled by dividing the load on
the individual nodes.
Calculate the several performance parameters like number of 8.
dead nodes in the network and delay in receiving the priority nodes at the destination.
Lastly perform comparison of the proposed technique with 9.
the traditional approach to check the performance of the proposed technique.
Implement bandwidth Utilization technique or method
Initialize the wearable network by entering the initial parameters such as number of nodes in the network, number of rounds, and initial energy of the nodes.
Starts the transmission of high priority and low priority data according to size of the bandwidth with respect to packet size
Select forwarder node on the basis of highest fitness value
Assign the data packets to the sensors nodes but the packet size must be different to each other..
Evaluate the fitness function or value of the nodes on individual basis.
Perform delay
Evaluate the resultant parameters and perform comparison between results acquired and
traditional approach Fitness
value <= threshold value
Fitness value >= threshold value
VI. Results and Experiments
As the proposed work aims to utilize the bandwidth properly in order to transmit the data over the body area network. This segment of the study reveal out the results that are obtained after applying the proposed work. The simulation is performed by using the MATLAB.
The image shown in fig. 2 depicts the graphical user interface of
the proposed work. The purpose behind developing the GUI is to make the system user friendly and easily accessible. As, it can be
observed from the fig. 3 that the GUI allows the user to initialize
the network by entering the value of the initial parameters such as number of rounds, initial energy and number of packets. The
GUI is embedded with three buttons on it. The click on first button
will instruct to run the traditional approach and click on second button will produce the output of the proposed approach. The purpose of the third button is to perform the comparison among the traditional and proposed results.
Fig. 2: Shows the GUI Layout of the Proposed Technique
After this when user run the proposed approach then the following
graphs will be generated. The graph shown in figure 3 defines
the delay on nodes that occurs in the proposed work. In graph
the X axis defines the number of nodes and the Y axis defines
the delay in milliseconds. The graph portrays that the delay is getting reduce constantly as the number of nodes are increasing in the network.
1 2 3 4 5 6 7 8
1000 2000 3000 4000 5000 6000
7000 Delay (ms ) v/s Node
Node Number
Delay (ms)
Fig. 3: Delay of Nodes in the Network of Proposed Approach
The graph shown in fig. 4 represents the number of dead nodes that
are obtained in the proposed work. The dead node is a term which
refers to the that nodes in the network which do not have residual energy or a amount of energy to perform the communication
process. The graph visualizes that the first dead node in the network
is founded after the 6000 rounds.
0 1000 2000 3000 4000 5000 6000 7000 8000
0 2 4 6 8 10
12 Number of Dead Nodes w.r.t R ounds
R ounds (r)
No. of dead nodes
Fig. 4: Shows Number of Dead Nodes in the Network With Respect to Rounds in the Proposed Approach
0 1000 2000 3000 4000 5000 6000 7000 8000
0 0.5 1 1.5 2 2.5 3
3.5x 10
4 Number of P ackets R eceived At S ink w.r.t R ounds
R ounds (r)
Packets received at sink
Fig. 5: Number of Packets Received at Sink
The fig. 5 reveals the graphical representation of the number of
packets that are received at the base station with respect to the given number of rounds. From the graph it is proved that the number of packets received at the destination is quite high which increases the reliability of the network.
0 1000 2000 3000 4000 5000 6000 7000 8000
0 2 4 6 8 10 12
R ounds (r)
No. of dead nodes
Number of Dead Nodes w.r.t R ounds
Traditional P ropos ed
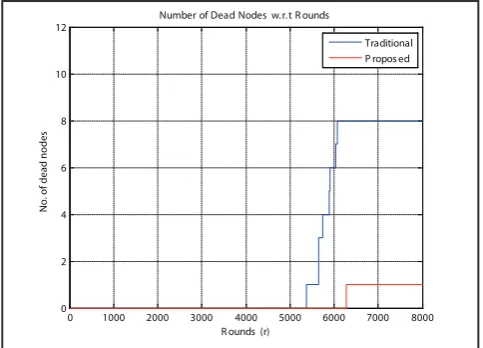
In figure 6 the comparison of the proposed and traditional work
is represented. The comparison is done on the basis of number dead nodes found in the network in both cases. The graph shows
that the first dead node found in the proposed work after the 6000
rounds whereas in case of traditional work, after the 5000 rounds node found to be dead. Hence it can be said that the traditional technique have to face the early dead nodes as compare to the proposed work.
1 2 3 4 5 6 7 8
0 5000 10000
15000 Delay (ms ) v/s Node
Node Number
Delay (ms)
Traditional P ropos ed
Fig. 7: Comparison of Conventional and Proposed Technique in Terms of Delay W.R.T Nodes in the Network.
Similarly the fig. 7 shows the comparison on the basis of delay with
respect to the number of rounds in the network. The graph makes it clear that the traditional work faces the more delay as compare to the proposed work. The delay in the nodes has a great impact on the performance of the network since it makes the network more complex and will also lead to the congestion in the network due to which the number of packets arrived at the destination or sink node will also gets effected. Hence the network with the less
delay is more efficient and reliable. As in the traditional work the
delay of 15,000 ms has occurred but in the proposed technique it comes at 6000 to 7,000 ms which is less in comparison with existing technique.
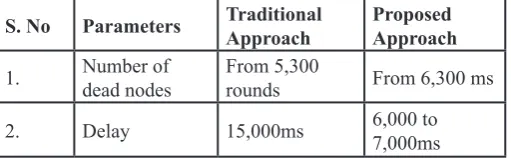
Table 1: Describes Comparison of Traditional and Proposed Technique
S. No Parameters Traditional Approach Proposed Approach
1. Number of dead nodes From 5,300 rounds From 6,300 ms
2. Delay 15,000ms 6,000 to 7,000ms
The above Table 1 defines the comparison between the proposed
and traditional work on the basis of two parameters i.e. number of dead nodes in the network and delay. The comparison is given
in the numerical form. The figures shown in the table states that the proposed work is more efficient and reliable as compare to
the traditional work in every aspect.
Comparison has done in terms of two parameters such as No. of Dead nodes and total Delay in the network which clearly shows
that the proposed technique is better, more efficient, reliable and
stable in contrast to existing technique helping in congestion avoidance.
VII. Conclusion
As the focus of the study is to properly use the bandwidth for the data transmission between the nodes and sink node. In order to avoid the wastage of bandwidth and congestion in the network the proposed work allows the nodes to transfer the data with high priority and low priority at the same time but this relies upon the size of the data and the bandwith too. After getting the results it is observed that the proposed work outperforms the traditionla work as there is less number of dead nodes and less delay in data delivery.
For further enhancements some other factors can also be added to the work. Factors like QoS, Security etc can be introducedinn near future to increase the reliability and the lifetime of the network.
References
[1] Savita Sindhu et al,“A Review on Wireless Body Area Network (WBAN) for Health Monitoring System: Implementation Protocols”, Communications on Applied Electronics (CAE), Vol. 4, No. 7, March 2016.
[2] Aashima Arya et al,“A Review: Wireless Body Area Networks for Health Care”, International Journal of Innovative Research in Computer and Communication Engineering, Vol. 2, Issue 4, April 2014.
[3] Sapna Singla et al,“A Review Paper on Wireless Body Area Network for Health Care Applications”, IJCSMC, Vol. 5, Issue 10, pp. 1 – 11, 2016.
[4] Pervez Khan et al,“Performance Analysis of WBAN MAC Protocol under Different Access Periods”, International Journal of Distributed Sensor Networks, Vol. 11, No. 10, 2015.
[5] Xin Qi et al,“MAC Protocol in Wireless Body Area Network for Mobile Health: A Survey and an Architecture Design”, International Journal of Distributed Sensor Networks, Vol. 11, No. 10, 2015.
[6] Luis Filipe et al,“Wireless Body Area Networks for Healthcare Applications: Protocol Stack Review”, International Journal of Distributed Sensor Networks, Vol. 11, No. 10, 2015.
[7] Anil K. Jacob et al,“Energy Efficient MAC for QoS Traffic
in Wireless Body Area Network”, International Journal of Distributed Sensor Networks February, Vol. 11, No. 2, 2015.
[8] Kiran et al,“A Review on Wireless Body Area Network”,
International Journal of Scientific Engineering and Research
(IJSER), Vol. 3, No. 6, pp. 72-75, 2015.
[9] Sana ULLAH et al,“A Review of Wireless Body Area Networks for Medical Applications”, Int. J. Communications, Network and System Sciences, Vol. 2, pp. 797-803, 2009. [10] Chris A. Otto et al,“A WBAN-based System for Health
Monitoring at Home”, IEEE, May 2007.
[11] Jinpil Tak et al,“Dual-Band On-Body Repeater Antenna for In-on-On WBAN Applications”, International Journal of Antennas and Propagation, 12 pages, 2013.
[12] Jamil Yusuf Khan et al,“Wireless Body Area Network
(WBAN) Design Techniques and Performance Evaluation”, Journal of Medical Systems, Vol. 36, No. 3, pp. 1441–1457, 2012.
[13] Magnus Jobs et al,“WBAN mass: A WBAN-based monitoring application system”, IEEE, June 2009.
[15] Marius Rosu et al,“WBAN Based Long Term ECG Monitoring”, International Journal of Monitoring and Surveillance Technologies Research (IJMSTR), Vol. 1, No. 3, pp. 18, 2013.
[16] Eliasz Kańtoch et al, “Human activity surveillance based on
wearable body sensor network”, IEEE, 2013.
[17] L. Brown et al,“Body area network for monitoring autonomic nervous system responses”, IEEE, August 2009.
[18] Cheolhyo Lee et al,“Physical layer designs for WBAN systems in IEEE 802.15.6 proposals”, IEEE, December 2009.
[19] Bhavneesh Malik et al,“A survey of research in WBAN
for biomedical and scientific applications”, Health and
Technology, Vol. 3, No. 3, pp. 227–235, 2013.
[20] Xu Bo et al,“Research on the Channel Characteristics of WBAN”, Telecommunications Science, March 2011. [21] Jun Wang et al,“An all dynamic MAC protocol for Wireless
Body Area Network”, 11th International Conference on Wireless Communications, Sept. pp. 1–6, 2015.
[22] B. Manzoor et al,“Noise Filtering, Channel Modeling and Energy Utilization in Wireless Body Area Networks”, IEEE, pp. 1754 – 1761, 2012.
[23] Jae Myeong Choi et al,“A Study on the Wireless Body Area Network Applications and Channel Models”, International Conference on Future Generation Communication and Networking, Vol. 2, pp. 263 – 266, 2008.
[24] Norman A. Benjamin et al,“Failure Performance Study of Hierarchical Agent Based Patient Health Monitoring in Wireless Body Sensor Mesh Network, Advances in Computing, Control, & Telecommunication Technologies, pp. 85 – 87, 2009.