PreSS#, A Web-Based Educational System to Predict Programming
Performance
Keith Quille1, Susan Bergin2 and Aidan Mooney3
1, 2, 3
Department of Computer Science, Maynooth University, Maynooth, Co Kildare, Ireland
1
[email protected], [email protected], [email protected]
ABSTRACT
PreSS# (Predict Student Success #) is a web based educational system developed during the academic year 2013/14. This paper describes the design and development, highlighting the methodologies and architecture of the system. The system builds upon the findings of a previous study undertaken by Bergin [1], who successfully developed a semi-automated computational model named PreSS that could predict a student’s academic performance in programming with an accuracy of over 80% after only 4-6 teaching hours. PreSS used a paper based data collection method and the analysis of the collected data required manual data entry thus making PreSS administratively heavy. PreSS# is a system that accurately replicates the performance of PreSS with 95% confidence (P (value) = 1.0 and a T (value) = 0.0), is fully functional and can compute predictions in real time with cross-browser (mobile and desktop) compatibility. PreSS# is scalable, secure and robust allowing it to be employed across different institutions, ultimately leading to an increase in progression rates by identifying both struggling and gifted (students in danger of becoming disengaged) students earlier than had been previously feasible.
Keywords: Web Based Application, Education, Learning, Prediction, performance.
1. BACKGROUND AND INTRODUCTION
1.1 Background
PreSS (Predict Student Success) is a semi-automated process that can predict student performance on an Introductory Computer Programming module at a very early stage (typically after four to six hours into the delivery of the module) based on three attributes reduced from an original set of 25 potential attributes [1]. The three attributes were: Programming self-efficacy, Mathematical ability (based on a high school mathematics exit examination) and the number of hours per week that a student plays computer games. The development of PreSS was undertaken over a three year period in four different institutions, consisting of one University, two Colleges
and one Community College. Over 200 students participated in the study. PreSS used two computational tools to predict student success, namely a data reduction algorithm and a machine learning algorithm. The data reduction algorithm used was Principal Component Analysis (PCA) which was used to reduce the program-ing self-efficacy data to a single principal component. The pre-processed programming self-efficacy data consisted of ten questions (see Appendix) and was based on the Rosenberg self-esteem questionnaire [2] but modified to reflect a student’s perception of their programming ability. PCA reduced the ten data attributes to a single principal component with an eigenvalue > 1 [3]. The machine learning algorithm used was naïve Bayes, which is a probabilistic classifier, where the algorithm computes a probability of how confident it is for each prediction. Naïve Bayes is computationally inexpensive and thus is appropriate in a real-time web-based environment. The PreSS model could predict with over 80% accuracy how students were likely to perform in their final examination after minimal time on a programming module. In the PreSS study multiple algorithms including SVM, backpropagation and decision trees were investigated with naïve Bayes achieving the highest accuracies. The naïve Bayes implementation was from the WEKA machine learning toolbox. This toolbox will be used as the benchmark platform when investigating PreSS#’s ability to replicate the results of the PreSS Study [4].
1.2 Introduction
stages of the module when it may be too late to introduce interventions. The PreSS model was able to identify weak students at an early stage of the module specifically between four to six hours into the delivery of an introduct-ion to programming module [1].
The PreSS study used a paper based data collection method and thus it was time consuming to gather and input the data. This made PreSS restrictive in the size of a study that could be carried out due to the administration. Furthermore, if PreSS was to be used across multiple institutions with large student numbers, administration would grow considerably and may inhibit the use of the tool in its current form or introduce human error. The analysis of the collected data is also time consuming, as each entry has to be manually entered into the computa-tional machine and each data field has to be manually validated before entry. These overheads in terms of administration and analysis resulted in a highly time consuming process. The goal of the work presented in this paper is to develop a web based system named PreSS# which has PreSS at its computational core. PreSS# could be used as a tool in an educational environment that would allow educators to make informed decisions about methodologies, differentiation and interventions at an earlier stage that will enable both weak and strong students to achieve their highest potential. Additionally a large scale study could be completed using PreSS#, examining the current effectiveness of the PreSS model, given the change in landscape of the technology domain since the original work by Bergin.
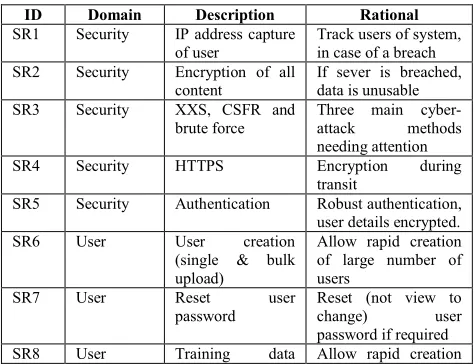
Before the project commenced, software requirements were elicited in the following four domains: security, user, device and system. The specific software requirements for each domain are referenced by an ID tag which is used throughout the paper when referring to a specific requirement and are shown in Table 1; for example if the Software Requirement in Table 1 had an ID of 1, the reference will be (SR1).
Table 1: Software requirements for the development of PreSS#
ID Domain Description Rational
SR1 Security IP address capture of user
Track users of system, in case of a breach SR2 Security Encryption of all
content
If sever is breached, data is unusable SR3 Security XXS, CSFR and
brute force
Three main cyber-attack methods needing attention SR4 Security HTTPS Encryption during
transit
SR5 Security Authentication Robust authentication, user details encrypted. SR6 User User creation
(single & bulk upload)
Allow rapid creation of large number of users
SR7 User Reset user password
Reset (not view to change) user password if required SR8 User Training data Allow rapid creation
(single & bulk upload)
of large training instances
SR9 User Prediction system Real time system, with reporting facilities
SR10 User Roles: student, lecturer and admin
Roles used for specific controller access
SR11 User Student can only take survey once
Survey only required once
SR12 User Lecturer and admin reset survey
Student can redo survey if needed
SR13 Device Device compatibility
Phone, tablet, PC and smart TV, HTML5 and CSS3
SR14 Device Dynamic controls Web controls change to be intuitive on native device SR15 System Development &
deployment
Fast development and deployment required SR16 System Separation of
concerns
Development in an MVC architecture SR17 System PCA Integration of PCA
into the system SR18 System Naïve Bayes Integration of naive
Bayes into the system.
2. PLATFORM SELECTION
2.1 Server Selection
Selection of an appropriate software platform is vital in developing a secure, robust and reliable system. The two major leading software platforms are Ubuntu Server (Java) and Microsoft Server 2008R2 (.NET). There have been many debates over which platform is superior based on market share, pricing etc. Market share is highly variable based on time and the area of deployment [7] and pricing can be considered less important if the quality of the system is a priority, thus attributes such as security, vulnerabilities and performance are considerably more important here given the nature of the student data being processed and the real time performance requirements. These criteria are paramount if PreSS# as a tool is to be used across multiple institutions with large student numbers. This section discusses security, vulnerabilities and performance in detail and concludes with platform and language selection.
2.2 Security and Vulnerabilities
error including access validation, configuration and design errors [8]. Similarly, a study on security focusing on encryption concluded that most Java encryption API’s demonstrated relatively poor performances on the Linux platform as compared to those on the Windows platform [9]. One example of the poor encryption performance in Java was the openSSL vulnerability, referred to as “Heart bleed” [10] which was present on the Apache system, but as Windows used a different SSL (SChannel) it was unaffected by this vulnerability.
2.3 Performance in Database Management Systems
Performance relating to data storage and retrieval is key to a real-time system, with large data sets. The Microsoft platform typically uses Microsoft SQL Server whereas Apache typically uses MySQL. These two database management systems (DBMS) are associated with .NET and Java respectively. A study by Bassil [11] analysed the performance of several DBMS which included SQL Server 2008 R2 and MySQL 5.5. The database design was identical on each DBMS, which included 15 distinct tables and relationships with 1,000,000 records. The study consisted of running ten queries varying in complexity from a simple select-all query to highly mathematical complex queries, thus completing a thorough analysis of the performance of each DBMS. Bassil measured the length of execution time of each query and found that SQL server 2008R2 was 1% faster over the ten queries and also faster in 80% of the individual queries [11].
2.4 Server and DBMS Conclusion
Even though there is a lot of public debate over which platform and DBMS to use, the studies analysed have provided evidence that the Microsoft Server is arguably less vulnerable, has faster execution times and has a more robust encryption algorithm than Apache [8]. The Microsoft platform was chosen as a suitable platform for the development of the web-based educational system. Server 2008R2 and SQL Server 2008R2, both the market leaders in the Microsoft platform range were selected. The server used was a VPS server, located in a European data centre. Additional security consisted of an industry standard hardware firewall (Cisco ASA 5500), which only allows remote access to the server operating system via RDC (Remote Desktop Connection) from valid Irish IP address ranges thereby narrowing the possibility of geographical attacks. The web system hosted on IIS can be accessed via the HTTPS port, 443. Access via the Remote Desktop Services (RDS) was secured with SSL encryption and the latest server updates were automatically installed.
2.5 Language Selection
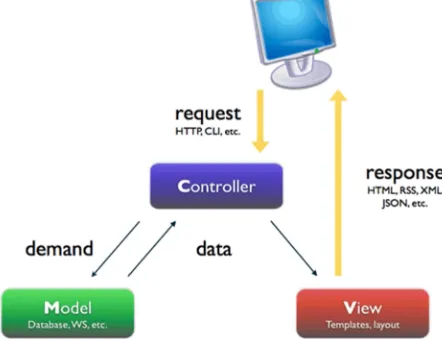
The initial short-listing of possible languages was based on the use of the Model-View-Controller (MVC) architecture as shown in the MVC architecture diagram in Figure 1. This architecture was selected based on the separation of concerns (SoC) design principle which fulfils the requirements of PreSS# with modular and secure develop-ment at the forefront (SR16). In MVC the architecture is composed of three separate interconnected parts. The Controller is the core and is implemented on the server side. The Controller returns generated Views to the user and the Controller get its data from Models which consist of Plain Old CLR objects (POCO). The language short list consisted of MVC4 .NET and Rails for Ruby, both of which use MVC architecture. Both languages have their own variation of MVC. Microsoft .NET was selected as the development language as the authors have several years of experience developing in .NET and it was felt that this experience would lead to faster development. In addition .NET easily integrates with the selected platform (Microsoft Server 2008R2) and DBMS (Microsoft SQL Server 2008R2) and includes some additional factors not found in Rails for Ruby, which include data annotations and the Entity framework which can increase the speed of development. Both of which will be expanded upon in the
following sections.
Fig. 1. MVC architecture diagram
3. DESIGN OF PreSS#
the form (if there are any validation errors, the same View is returned to the student with validation error messages, and this is repeated until the validation passes), and passes the data into the naïve Bayes and PCA models to compute the predictions. The predictions are returned to the Controller which may be sent to a lecturer/ teacher via a View.
Fig. 2. UML use case diagram for the three types of users.
Fig. 3. UML architecture diagram of PreSS#
4. DEVELOPMENT OF PreSS#
4.1 Development Overview
The development phase of PreSS# composed of three parts: PCA and naïve Bayes model development (Section 4.2), integration of both models into PreSS# (Section 4.3) using the MVC Controller and the development of the web systems interface and front end (MVC Views that are generated by the Controller, Section 4.4) focusing on the system requirements set out in Table 1. At each stage of development an Agile approach was adopted focusing on iterative development and constant testing. The testing will be discussed further in section 5.
4.2 PCA and Naïve Bayes Development
4.2.1 PCA Overview
PCA plots all data points in a multi-dimensional space. PCA essentially performs an orthogonal transformation (rotation of data in multi-dimensions) to find the covariance eigenvectors with the largest eigenvalues which represented the largest distribution or effect of the data set, hence selecting the principal component. This was implemented in PreSS selecting eigenvalues > 1, to reduce the 10 questions of the programming self-efficacy attribute to one principal component [1, 3]. This can be repeated for subsequent components to find the second principal component etc. A graphical illustration of this rotation of data in multi dimensions (one dimension per attribute used) can be seen in Figure 4, where it can be seen that the data is rotated until the largest eigenvalue is found, which is illustrated by the additional arrows on the figure.
Fig. 4. Principal Component Analysis showing an example of covariance eigenvectors with the largest eigenvalues illustrated by the additional
arrows.
4.2.2 PCA Application
The .NET PCA model was created in a separate class library and allowing for future integration into PreSS# and other systems if necessary. The PCA application was developed to allow data sets of different size and format to be tested before it was finally integrated into the web system. This was essential as the data set size in future studies may vary significantly. The system also calculated the first, second and third principal components allowing for further properties to be examined throughout future studies if required. It is worthy to note that PreSS only used the first principal component after determining no improvement to accuracy could be made by using subsequent components. The system was able to open files in two formats which allowed for quick loading of different test data, either from WEKA (.ARFF format) or from Comma Separated Values (.CSV) file formats. The results were added to a visual output form and the system
allowed for the export of the results either via .CSV format or to print the data. A visual reporting tool was also developed to graphically display the first principal component to aid the user in visualising the first principal components for any post-hoc analysis of the data.
4.2.3 Naïve Bayes Overview
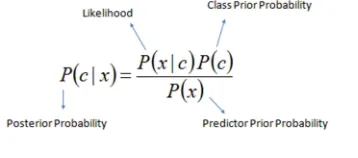
Naïve Bayes is a probabilistic machine learning classifier which assumes that each attribute is of the same importance as every other attribute. Naïve Bayes by its nature is a relatively low computationally intensive algorithm as shown by Eq. (1). This makes naïve Bayes suitable for real time processing [4]. Another advantage of naïve Bayes is that for each prediction the algorithm can compute a probability value of how confident it was of the categorisation/prediction.
(1)
The probability returned from a naïve Bayes calculation is used to predict the success or failure of a student. A prediction value P, where 0.0 ≤ P < 0.5 will classify a student as a weak student and a prediction value of P, where 0.5 ≤ P ≤ 1.0 will classify a student as strong. This prediction value P, is also used as a measure of how confident naïve Bayes is in its prediction, which is strongest at a probability of one and zero respectively. This confidence is weakest when the probability is approaching the value of 0.5. For example, a student who was classified as a strong programmer with a prediction value P of 0.521 can be reclassified as a borderline-strong student and included in any interventions to improve their likelihood of success.
4.2.4 Naïve Bayes Application
useful for testing the model as if both .NET and/or WEKA produced a different classification this could be used as a measure of variance between the predictions.
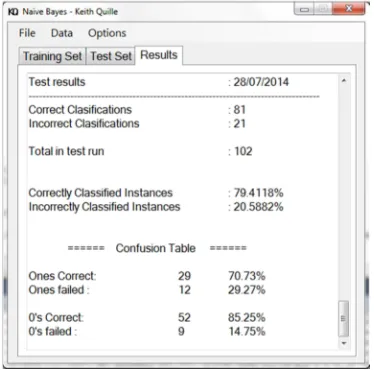
Fig. 5. A screen shot of the naïve Bayes application developed running on the PreSS study, showing the probability break down of each
classification.
The results table also contained a confusion matrix, as shown in Figure 6. A confusion Matrix is a table representing the breakdown of the predictions into four categories that include, the number of strong students that the system predicted to be strong, the number of strong students that the system predicted to be weak, the number of weak students that the system predicted to be weak and finally the number of weak students that the system predicted to be strong.
Fig. 6. A screen shot of the naïve Bayes application developed running on the PreSS study, showing the confusion matrix.
Ten-fold cross validation (10FCV) was also implemented. This is a best practice method to avoid over fitting [4] with machine learning algorithms. This method is far more involved than a hold-out method (this is where the data set is split into two groups with one group used for training and the other group used for testing) as it uses every sample in a data set for both testing and training. This reduces the chances of over fitting by removing any bias that the holdout method may have introduced.
10FCV starts by first randomising the data set and then the data is split into 10 folds of approximate equal size, this is the most commonly used fold size [4]. If the data set size does not allow for equally divided folds, the sets are created as per Table 2 on 102 data samples. The data did not divide equally into ten folds so the remaining data is evenly dispersed into the folds starting at fold one, then fold two as needed [4].
Table 2: Example of 10 folds, how the data is split before training / testing begins with the PreSS study containing 102 samples.
Once the data is split into the 10 folds, 10FCV holds one fold out for testing and trains on the remaining folds. For example, using the data in Table 1, fold A is used for testing and the naïve Bayes model is trained on Folds B – J. This process is then repeated using the next fold (fold B) for testing and trains on the remaining folds. This is repeated for all ten folds. This allows every entry fold to be tested on an independent training set, without the same entry being used for both training and testing. The results are then averaged and used as the final predictions as if it was only one test. 10FCV was not part of the Accord.NET framework so it had to be developed separately in this application. 10FCV was required for comparison testing of the models of WEKA and .NET as WEKA has 10FCV as a standard feature and it was the method used in the PreSS study to obtain the overall accuracy of the model [1].
4.3 PCA and Naïve Bayes Integration into PreSS#
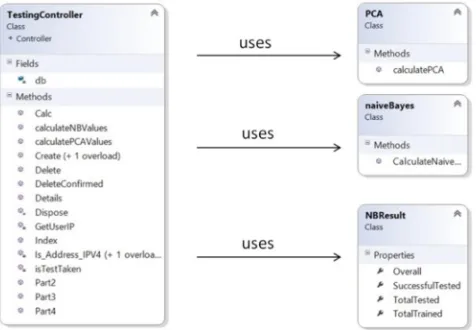
The naïve Bayes and PCA models were integrated into the overall system and this can be seen in Figure 7 (SR17, SR18). The web application can have multiple controllers for separate tasks such as authentication, roles and computation. A Controller was developed to handle the interaction with the naïve Bayes and PCA models, named TestingController. A third Model (class) named NBResult was also developed which was used as a reporting model for logging the naïve Bayes predictions (SR9).
Data Set Size = 102 Folds = 10
11 11 10 10 10 10 10 10 10 10
A B C D E F G H I J
Fig. 7. UML class diagram showing the PCA and naïve Bayes classes interacting with the TestingController.
4.4 Development of PreSS# Front End
The overall development of the front end of PreSS# was broken down into four sub areas, namely; ease of use, rapid development methods, security and services. At each stage references will be made to the software requirements as outlined in Table 1 using the ID.
4.4.1 Ease of Use
Ease of use and device compatibility was a primary focus of PreSS#. HTML5 was used in conjunction with CSS3. The development of the front end Views in HTML5 allowed the package to be dynamic on multiple device platforms. HTML5 is adapted for strong mobile integration which is a key feature for the long term success of the web system, as a large increasing proportion of current internet access is on varying mobile devices (SR13).
Razor was used to enhance HTML5. Razor is a programming syntax used to develop dynamic web pages. Razor is written in C# and is classified as a “view engine” and is written directly into the raw HTML View and is run server side before the View is returned to the client. This can eliminate the need for multiple pages by creating a single page with conditional Razor statements, for example depending on mobile or desktop requests Razor will select different controls as it is processed on the server side before the HTML is generated allowing dynamic pages to be produced depending on the device requesting it, without having to create multiple pages with similar content. In PreSS# Razor was used extensively (SR14, SR15).
4.4.2 Rapid Development Methods
4.4.2.1 Razor
One feature of models in MVC is the ability to pass a model or a list of models from a Controller into a View. Once passed into the View, Razor was able to parse the model or list of models and create controls, such as, tables using iteration, to display each of the models properties. Razor also had the use of IntelliSense (context aware automatic code completion) which allowed for faster development (IntelliSense is aware of Models and variables in the scope of that View) in a more abstract manor. Razor was able to significantly reduce the development time needed for views (SR15).
4.4.2.2 Data Annotations
Data annotations are a method of describing validation rules (such as a range for values and error messages) and Database properties (such as a primary Key or Nullable field) which are written into the model as part of its properties. When the View used a Model these data annotations were also used for data validation on forms in Views; if the data annotation was changed in the Model this filtered into every View. This method of validation removed the need for the creation of multiple additional java scripts significantly reducing development time and was a more robust method ensuring consistency for the user with every instance of the Model in different Views having the same validation (SR15).
4.4.2.3 Entity Framework
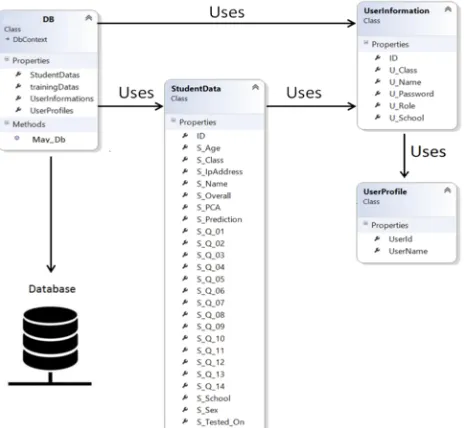
The Entity framework consists of an object-relational mapper that works with Models (POCO objects) and translates the Models to relational data storage. A class named DB was developed which contained properties (collection of the models), which in turn translate to the tables in the physical database; this is shown in Figure 8. The DB class is the Entity access control to the live Microsoft SQL Server database.
Fig. 8. Illustration of Entity class and the Models (properties) used.
4.4.2.4 LINQ
In the Controllers LINQ (Language-Integrated Query) was used in preference to using SQL (Structured Query Language). LINQ consists of a native C# data querying language and was able to query the list of models using native C# code replacing the need for SQL statements. LINQ was integrated with IntelliSense and was able to produce run time compile errors, two features that SQL does not exhibit, thus leading to significant gains in terms of development time as well as debugging time (SR15).
4.4.3 Security
4.4.3.1 Authentication
Authentication was handled by the ASP.NET web security model which validates and manages users and roles; this model was modified to accommodate additional properties required for this web system such as school and institution details. This model was also used for access control to Controllers which could be sub divided by user roles, which allowed for hierarchical access control for users in specific roles. A single view could also be customised for different roles, both contributing to a faster development of a secure and robust system (SR5).
4.4.3.2 Encryption
Password data is hashed by the .NET web security and a cryptography class was developed to encrypt all the data stored in the system using the AES standard with a 256 bit key. This class uses a salt function to prevent standard dictionary attacks on the data. All data stored in the database was encrypted using this class. The data in transit
is encrypted by Microsoft IIS7 using HTPS with SSL. (SR2, SR4).
4.4.3.3 Attack Prevention
To address automated brute force log in attacks, a three attempt system was developed. The user after three failed log in attempts is locked out of the system for ten minutes (SR3). The IP addresses of each student surveyed were also logged (SR1). Cross site scripting attacks (XXS) were addressed with HTML encoding using Razor in all HTML input and retrieval fields so if a malicious java script is injected into the site or database only the raw HTML is displayed making the script redundant when it reaches the browser (SR3) Cross site forgery requests (CSFR) were also addressed by sending two independent random tokens to the view, one as a cookie and the other token was randomly hidden in a field on the form. On the submission of the form both tokens are required by the controller, otherwise the server rejects the request (SR3).
4.4.4 Services
Three roles were created: administrators, lectures and students, each with different levels of functionality (as shown in the use case diagram in Figure 4) (SR10)
• Administrator: Can create users on the system, delete users, modify a user’s details, reset passwords, upload training set(s), run prediction analysis with a more detailed report than a teacher would receive and observe the survey (SR6, SR7, SR8, SR12)
• Lecturer: Can see surveys taken, allow students to retake a survey if needed, and can run prediction analysis with a limited report (SR12).
• Student: Can only sit a survey once and cannot redo it unless sanctioned by a teacher; the sequence diagram is shown in Figure 3 in Section 3.4 (SR11)
Administrators can upload users in batch mode via a .CSV file (SR6). The system validates the data upon uploading and returns a log of each entry, containing details of its success or failure (and the cause of any validation error). This bulk upload of users would be very beneficial for large institutions. The training data set can also be bulk uploaded via a similar function.
5. TESTING PreSS#
alpha investigations were white box testing at each phase of development. The beta investigation was a pre-pilot study conducted in the 2013-14 academic year which consisted of 34 users using multiple device types; this will be expanded upon further in Section 5.2.
5.1 Alpha Testing
White box alpha testing was completed at each stage of the system development. Table 3 shows the twelve main test cases which consisted of class, API and method testing. As both the PCA and naïve Bayes classes were previously examined they are not considered in these test cases. As mentioned in Section 4.1 an agile approach was used, where the test cases were completed iteratively throughout the development to allow each phase to be validated and the next phase built upon this validated phase.
Table 3: Results from alpha testing test cases
No Description Result Pass/
fail 1 Security – IP
address capture
Address stored in DB, even when Proxy used.
Pass
2 Security – Encryption
All data in DB encrypted, salt functionality working, no similar entries
Pass
3 Security – XXS, CSFR and brute force
CSFR and brute force failed, XXS raw displayed
Pass
4 Security – HTTPS (SSL in IIS7)
HTTPS enabled, on all browser types.
Pass
5 Security – Authentication
Log in successful with all three roles, each action restricted or allowed specific roles.
Pass
6 User - User creation
Single user creation with .CSV upload with validation.
Pass
7 User - Reset user password
Reset password for user, admin cannot see current password as per ADDC standard practice.
Pass
8 User - Training data
Single training data set creation with validation, .CSV bulk upload with validation on all aspects that include file type and missing values.
Pass
9 User - Predictions completed
Predictions completed using PCA and naïve Bayes classes, compared and validated using the two .NET applications.
Pass
10 User - Student, lecturer and admin roles
Each role was tested; no user had access to any control or action even with URL injection.
Pass
11 User - Reset a survey
Survey reset for student allowing resit. (admin and lecturer only)
Pass
12 Device - Submit survey as student on multiple devices
Survey submitted successful in every browser on every device, issue with Safari with respect to data and time validation*. *issue caused by the safari browsers in built date time validation defaulting the US date time format, issue resolved by moving this validation to server side.
Pass
5.2 Beta Testing
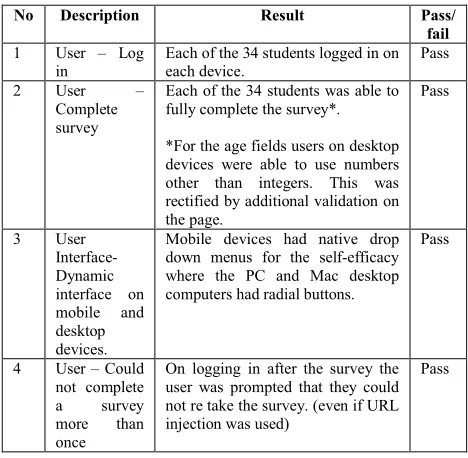
Black box beta testing was carried out on a small pre pilot study group of 34 students. This small study was completed to test and validate the system using a multitude of devices which included PC’s, iPhone, Android phone, iPad and a Surface tablet. This testing was completed in April 2014. This was also the first time the system had more than one active user at any given time. The results of this testing can be seen in Table 4. The beta testing was successful with only one minor validation issue (No 2) which was addressed immediately.
Table 4: Results from beta testing test cases.
6. REPLICATION OF PreSS#
6.1 Overview
PCA and naïve Bayes replication testing was carried out to investigate if both could replicate the results of the PreSS study. If the replication was a success the .NET implementation of PreSS could then be confidently integrated into the web based system.
6.2 PCA Replication of Results
The PCA implementation was based on that used in PreSS and a tutorial by Souza [13] as described in Smiths tutorial paper [3]. Examples in Smith’s paper were used as the standard to confirm the PCA class in .NET. In Smith’s study, the results were first calculated on paper and then confirmed in Scilab [3, Appendix], a freeware alternative to MATLAB. Even though the languages differ, the
No Description Result Pass/
fail 1 User – Log
in
Each of the 34 students logged in on each device.
Pass
2 User – Complete survey
Each of the 34 students was able to fully complete the survey*.
*For the age fields users on desktop devices were able to use numbers other than integers. This was rectified by additional validation on the page.
Pass
3 User Interface- Dynamic interface on mobile and desktop devices.
Mobile devices had native drop down menus for the self-efficacy where the PC and Mac desktop computers had radial buttons.
Pass
4 User – Could not complete a survey more than once
On logging in after the survey the user was prompted that they could not re take the survey. (even if URL injection was used)
calculations/pre-steps and most importantly the results that Smith computed, would be used to compare the accuracy of the PCA model developed. Souza’s tutorial was based on the accord.NET framework and he was able to replicate the results of Smith. The aim was to replicate Smith’s result and confirm the accuracy of the PCA class.
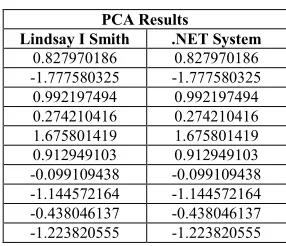
The developed system’s results were compared with the results of Smith using the same input data. The results were replicated to the ninth decimal place as shown in Table 5. These results were identical to that of both Smith and Souza. With the results replicated, it was felt that the PCA model was statistically the same when using the .NET implementation. It was felt that a student’s T-Test was not required to show statistical similarity in this case, as both results were identical.
Table 5: The Results from Lindsay I Smith’s study and from the Authors PCA system (.NET)
PCA Results
Lindsay I Smith .NET System 0.827970186 0.827970186 -1.777580325 -1.777580325 0.992197494 0.992197494 0.274210416 0.274210416 1.675801419 1.675801419 0.912949103 0.912949103 -0.099109438 -0.099109438 -1.144572164 -1.144572164 -0.438046137 -0.438046137 -1.223820555 -1.223820555
6.3 Naïve Bayes Replication of Results
Table 6 shows the naïve Bayes application (labelled .NET) and WEKA’s prediction accuracies along with sensitivity (the true positive rate) and specificity (the true negative rate) [4]. Both systems used the PreSS study with all of the 102 data samples as the input and 10FCV to produce the results in Table 6.
Table 6: Results from Naïve Bayes and WEKA applications using 10FCV on the PreSS study.
Application Sensitivity %
Specificity %
Accuracy %
.NET 81.53% 78.38% 80.39%
WEKA 80.05% 80.00% 80.39%
The results from Table 6 show that .NET had an accuracy of 80.39%, identical to the accuracy of WEKA. The equation for calculating accuracy is given by Eq. (2). A two tail T-Test for a binomial distribution was run to confirm both applications prediction accuracies were not statistically different as shown in Eq. (3). No significant statistical difference was found. The T-Test results with a 95% confidence level were: P (value) = 1.0 and a T (value) = 0.0, showing that the WEKA results were not statistically
different to the .NET results and that the null hypothesis was accepted. Sensitivity and specificity were also recorded as presented in Eq. (4) and Eq. (5), but as it was felt that sensitivity was the most important factor for PreSS# (inferring that correctly predicting a weak student is more significant and takes precedence over correctly predicting a strong student) this was the examined measure.
A T-Test was completed on sensitivity and specificity in both .NET and WEKA. The sensitivity between .NET and WEKA concluded with no statistically significant difference and the following result: P (value) = 0.09 and a T (value) = 1.6. The specificity between .NET and WEKA concluded that there was a statistical difference with the following result: P (value) = 0.006 and a T (value) = 2.81 and this was investigated further with focus on the prediction (confidence) value associated with the true negative (TN) and false negative (FN) predictions. In both the .NET and WEKA system, each had one TN and one FN prediction that had a prediction value P close to the 0.5 threshold. This finding suggests that each system was not very confident with these specific predictions, and further research in this area may be required. Table 7 shows the breakdown of the predictions and associated P values.
Table 7: Results from Naïve Bayes and WEKA applications using 10FCV on the PreSS study.
Application TN - P value FN - P value
.NET 0.510 0.445
WEKA 0.504 0.517
Accuracy = ( )
( )
(2)
= ( − )
(3)
Sensitivity =
(4)
Specificity =
(5)
7. CONCLUSIONS
that is ready to be integrated into the educational domain. This tool will be invaluable for the early detection of students who may be at risk of failing an introductory programming module. The tool may also expedite the development of educational methodologies, both for students who are likely to fail and for students who are likely to be very strong hence developing methodologies for differentiation. This differentiation and early detection of weak and strong students may lead to effective interventions that may be applied faster than current efforts, thus enabling students to possibly achieve at a higher rate than predicted and increasing the progression rates of computer science.
8. FUTURE WORK AND
ENHANCEMENTS
Currently lecturers cannot create users within the PreSS# system, this can only be done by a super-user and may be a requirement if the system is to scale up to large institutions or become software as a service (SaaS). During testing self-signed certificates were used for SSL in IIS. This is acceptable for alpha testing and maybe beta testing but secure signed certificates are needed for future use of the system. Currently teachers can see all students who are on the system; this is again acceptable if the system is going to be deployed on an institution by institution basis, but if SaaS were to be implemented, it would not be acceptable for one institution to access another institutions data and would need to be addressed. If this system was to be developed as SaaS, this has been factored in to the development of the current system, where each user is currently associated with an institution and a specific class within that institution.
Further research may be required in the area of the associated P value of each prediction, as it was found that the specificity was different between .NET and WEKA. The authors believe that the randomisation of the data in the pre-processing for 10FCV may have contributed to this, on the basis that the P value in each of the investigated cases was close to 0.5, further research should be undertaken to investigate this fully. One final recommendation would be to use Bootstrapping to further develop the mobile responsive look and play. Bootstrapping is becoming a standard in mobile CSS and accompanying scripts and may enhance and modernise the system.
9. APPENDIX
Rosenberg [2] self-esteem questionnaire modified to suit an introductory programming module as used in the PreSS study and Press#. Each question had four possible answers:
1. Strongly agree 2. Agree
3. Disagree
4. Strongly disagree
Q1) On a whole I am satisfied with my programming progress?
Q2) At times I think that I am no good at all at programming?
Q3) I feel that I have a number of good programming qualities?
Q4) I am able to complete programming items as well as most other students in my class?
Q5) I feel that I do not have much programming ability to be proud of?
Q6) I certainly feel useless at programming at times? Q7) I feel that I am a person of worth, at least on a plane
with other programmers in my class?
Q8) I wish I could have more respect for my programming ability?
Q9) All in all, I am inclined to feel that I am a failure at programming?
Q10) I take a positive attitude towards my programming ability?
REFERENCES
[1] S. Bergin, 2006, “A computational model to predict programming performance”, Maynooth University PhD thesis.
[2] M. Rosenberg, 1965, “Society and the adolescent self-image”, Princeton University Press.
[3] L.I. Smith, 2002, “A tutorial on principal components analysis”, http://kybele.psych.cornell.edu/l.pdf, Cornell University, Tutorial. accessed 12/6/2015.
[4] I. Witten and E. Frank, 2005, “Data Mining: Practical Machine Learning Tools and Techniques”, Morgan Kaufmann Publishers, second edition.
[5] O. Mooney, V. Patterson, M. O’ Connor and A. Chantler, 2010, “A study of progression in Irish higher education”,
Higher Education Authority,
[6] C. Watson, 2014, “Failure Rates in Introductory Programming Revisited”, 2014 conference on Innovation & technology in computer science education. ITiCSE’14, June 21–25, 2014, Uppsala, Sweden.
[7] Netcraft Internet Services, 2015, “A survey of 876,812,666 sites, detailing market share of web servers”, http://news.netcraft.com/archives/2015/01/15/january-2015-web-server-survey.html, accessed 22/06/2015. [8] S. Woo, H. Joh, O. H. Alhazmi, Y. Malaiya, 2011,
“Modelling vulnerability discovery process in Apache and IIS HTTP servers” Computer Science Department, Colorado State University, Science Direct, E30, p50-62. [9] G. Francia and R. Francia, 2007, “An Empirical Study on
the Performance of Java/.Net Cryptographic APIs”, Information Systems Security, 16:6, 344-354.
[10]CVE, 2014, “CVE-2014-0160 – Heart-bleed”, https://cve.mitre.org/cgi-bin/cvename.cgi?name=CVE-2014-0160, accessed 22/06/2015.
[11]Y. Bassil, 2011,”A Comparative Study on the Performance of the Top DBMS Systems”, Journal of Computer Science & Research (JCSCR), Vol. 1, No. 1, P.20-31.
[12]C.R. Souza, "Accord.Net Framework", Open source Machine learning and Data mining Framework, http://accordframework.net/index.html. Accessed 4/8/2014
[13]C.R. Souza, 2012, " A Tutorial on Principal Component Analysis with the Accord.NET Framework ". Department of Computing, Federal University of Sao Carlos, Technical Report.