321
International Journal of Pharmaceutical Sciences and Drug Research
2015; 7(4): 321-328
Research Article
CODEN (USA): IJPSPP
ISSN: 0975-248X
Spray Drying: A Approach for Solubility Enhancement of Ritonavir by Solid
Dispersion
Karva G. S.
1*, Katariya V. R.
2, Shahi S. R.
11Government College of Pharmacy, Vedant Road, Osmanpura, Aurangabad-431005, Maharashtra, India
2Kamala Nehru Pharmacy College, Maulana Azad Campus, Rouza Baough, Aurangabad-431005, Maharashtra, India
ABSTRACT
The aim of present work was to improve the dissolution rate of Ritonavir by preparing micro-particles with certain hydrophilic polymers via spray drying technique. Role of spray drying method was studied for solubility enhancement of poorly aqueous soluble model Ritonavir using solid dispersion approach. All the carriers showed dissolution improvement vis-à-vis pure drug in varying degrees. The solid dispersions were characterized in comparison with pure drug and corresponding Physical mixture (PM). The prepared solid dispersion were evaluated by drug content analysis, saturation solubility, DSC (Differential scanning calorimeter), SEM (Scanning electron microscopy), PXRD (Powder X-ray diffraction), FTIR (Fourier transform infrared spectroscopy).and in vitro drug release. Absence of pure drug peaks in PXRD suggests transformation of crystalline drug into an amorphous form. The transformation of Ritonavir from crystalline to amorphous state by spray drying and the hydrophilic coating of drug particles by the polymers are considered for improvement of Solubility and dissolution of Ritonavir.
Keywords: Spray Drying, Solubility Enhancement, Ritonavir, Solid Dispersion.
INTRODUCTION
Poorly water soluble BCS class II entities, having high permeability, affiliated with obtuse drug absorption which leads to scarce and varying bioavailability. It assumes that the rate of absorption is depends on the drug solubility and dissolution, successive transport on intestinal membrane and liver. Solubility is generally known as amount of a substance dissolves in a given volume of solvent at a specified temperature and pH. Formulation strategies for such class drugs are pointed towards their solubility enhancement. [1] Ritonavir, selected drug in the present studies, is poorly water
*Corresponding author: Mr. Gopal S. Karva,
Government College of Pharmacy, Vedant Road, Osmanpura, Aurangabad-431005, Maharashtra, India;
Tel.: +91-7030588688; E-mail: gopalkarva@gmail.com
Received: 16 May, 2015; Accepted: 30 June, 2015
soluble drug cognized for dissolution or solubility limited absorption. A few endeavors to solubility enhancement of Ritonavir were reported in the literature. [2] The current studies aim towards exploring various water soluble carriers used to solubility enhancement as well dissolution using Spray drying method. [3]
By many estimates up to 40% of NCE discovered by the pharmaceutical industry today are poorly soluble or lipophilic compounds. The solubility issues affect the delivery of many existing drugs. Solid dispersion technology can be used to improve the in vitro and in vivo dissolution properties of dissolution dependent poorly water soluble drugs.
unchanged in faeces due to its low solubility & this low solubility is the basis to prepare the solid dispersion. Due to this solubility of the Ritonavir get increased & hence the dose of Ritonavir will be reduced. Solubility enhancement may lead to reduction of dose and eventually less side effects of the drug. Former reason results in reduction of cost therapy. Also may lead into dosing frequency increase in patient compliance.
MATERIAL AND METHODS Materials
Ritonavir was gifted by Lupin research park, Pune, India. Kollidon VA 64, Lutrol F 68 from BASF india, and Hydroxypropyl Methyl cellulose (HPMC 5cps) Colorcon, All other chemicals used were of analytical grade and procured from commercial sources.
Preparation of physical mixtures [4]
Physical mixtures were prepared by mixing of Ritonavir and polymers in mortar and pestle by geometrical dilution method. This mixture is then passed through sieve (335μm). All physical mixtures were prepared by same process as shown in Table 1.
Preparation of SD by spray drying
The Ritonavir and the polymers (Kollidon VA 64, HPMC and Lutrol F68) were weighed accurately in various ratios as shown in Table 1and then dissolved in sufficient quantity of methanol using magnetic stirrer to obtain a clear solution. The solution was spray dried using laboratory-scale spray dryer (LABULTIMA, Diamond Industrial Estate, Mumbai, 400068 India) under the following set of conditions shown in Table 2: Each solid dispersion batch was prepared in triplicates. The dispersions were stored in desiccators under vacuum until used for further study. [5]
Characterization of Drug and Solid Dispersion[6]
Melting point determination
Melting point of Ritonavir was determined by taking a small amount of sample in capillary tube sealed at one end and placed in beaker filled by liquid paraffin in melting point apparatus. The melting point was noted and readings were taken in triplicate. [7]
DSC analysis
Thermal behavior of Ritonavir was recorded by using DSC (Shimadzu 60) by using the DSC parameters (Table 3). The system was calibrated with a high purity sample of Indium. Sample was placed into in aluminum cup and sealed. An empty aluminum cup was used as a reference. [8-9]
Fourier transform infrared spectroscopic study (FTIR)
The IR absorbance spectrum of Ritonavir was traced using IR 200 spectrometer (Thermo Electron Corporation) over a wavelength range of 400 to 4000 cm-1. The sample was directly placed in the sample cell in IR chamber & graph was analyzed for any interaction of drug and polymer in solid dispersion. [10]
Thin layer chromatography (TLC)
TLC was used to check purity & determined the presence of any derivative, impurity or reactant in the sample of Ritonavir. Pure drug and solid dispersion
equivalent to 10 mg dissolved in 100 mL of solvent separately. Methanol: acetonitrile (50:50) served as mobile phase. Spots were detected with the help of UV chamber. The Rf (Retention factor) value was calculated.
Powder X-ray diffraction analysis (PXRD)
The powder property of Ritonavir was evaluated by using PXRD. Powder nature of Ritonavir, polymer & optimized prepared SDs were determined using Phillips X-ray diffractometer PW 3710 scanner, IW 1830 generator with scan rate of 1° min-1 from at 2θ range from 1 to 40°C. [11]
Scanning electron microscopy (SEM)
The surface morphology of Ritonavir and prepared solid dispersion along with polymer of optimized batch was performed by a scanning electron microscopy using JSM-6390 microscope. [12]
UV spectroscopy
The ultraviolet absorption spectrum of a Ritonavir solution in 0.1N HCl was obtained using SHIMADZU 1700-PC UV visible spectrophotometer and 1 cm quartz cells, over a wavelength range of 200 to 400 nm. The maxima wavelength (λmax) was determined by using UV probe software. [13]
Table 1: Ritonavir solid dispersion formulation Ritonavir : Polymer
ratio (w/w)
Polymers
Kollidon VA 64 Lutrol F68 Lutrol F127
1:1 RA1 RH1 RL1
1:2 RA2 RH2 RL2
1:3 RA3 RH3 RL3
1:4 RA4 RH4 RL4
1:5 RA5 RH5 RL5
1:6 RA6 RH6 RL6
Table 2: Optimized process parameters of spray drying
S. No. Parameter Optimized value
1 Feed rate 2 mL/min
2 Pressure 0.15 mPa
3 Inlet temperature 70°C
4 Outlet temperature 55°C
5 Aspirator speed 20 mbar
6 Atomization air pressure 2 Kg/cm2
Table 3: DSC Analysis parameter
Parameter Value
Weight of sample 3-10 mg
Heating range 50-300°C
Heating rate 10°C/min
Flow of nitrogen gas 20 mL/min
Evaluation of Solid Dispersion[14]
Morphological evaluation
The prepared solid dispersion by spray drying method was subjected for the morphological characterization like color, appearance, flow properties etc. [15]
Drug content uniformity analysis
Int. J. Pharm. Sci. Drug Res. July-August, 2015, Vol 7, Issue 4 (321-328) Saturated solubility analysis
Solubility study was carried out for assessment of solubility enhancement due to preparation of solid dispersion. Excess quantity of drug and prepared solid dispersions were introduced separately in glass vial containing 10 mL of distilled water and vials were shaking for 24 hours continuously at room temperature in laboratory shaker. The resulting solutions were filtered, suitable dilutions were made using distilled water and the drug solubility in the pure from and prepared solid dispersion was calculated by spectrophotometrically. [17]
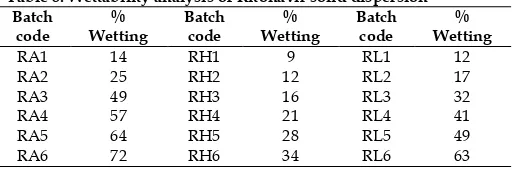
Wettability study
Wettability study was performed using open capillary tubes. A pure drug & various prepared solid dispersions with different polymers were filled in capillary with their lower capillary ends dipped into aqueous solution of water soluble dye (0.01% w/v eosin in water). The upward migration of the colored front was registered as a function of time and % wettability was calculated for all samples. [18]
In-vitro dissolution studies
In-vitro dissolution studies were performed in triplicate
on USP type II apparatus for 2 hours in distilled water at 100 rpm. The temperature was maintained at 37.5 ± 1°C, pure drug and solid dispersions equivalent to 100mg of were taken. The aliquots were taken at the interval of each 10 mins and analyzed for absorbance using UV-spectrophotometer at 247 nm. The results of pure drug and solid dispersions were compared for prediction of dissolution enhancement is achieved. [19]
RESULTS
Melting point determination
The melting point range of Ritonavir sample was found to be 120°C to 123°C, by capillary method which is nearer to the reported melting point range 119 to 123°C.
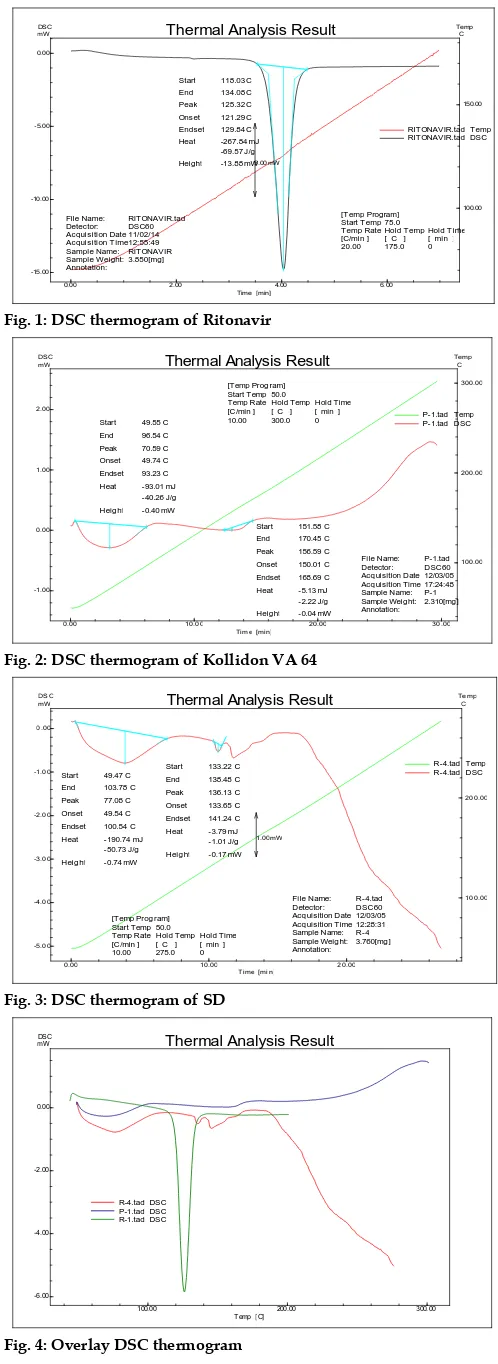
DSC analysis
The DSC analysis data showed that there was absence of sharp endothermic peak at 125°C in Ritonavir optimized solid dispersion thermogram, base peak, the drug is converted from crystalline form to amorphous form. DSC graph for pure drug showed a sharp endotherm which was indicative of its melting temperature, followed by an exotherm, which signifies that after melting, pure drug decomposes. The DSC thermogram of solid dispersions revealed disappearance of the endothermic peak which demonstrates that drug could be homogeneously dispersed in an amorphous phase and no drug crystallizes out of the solid dispersion. Lower the δH value, more the amorphous product and this was supported with enhancement of dissolution rate.
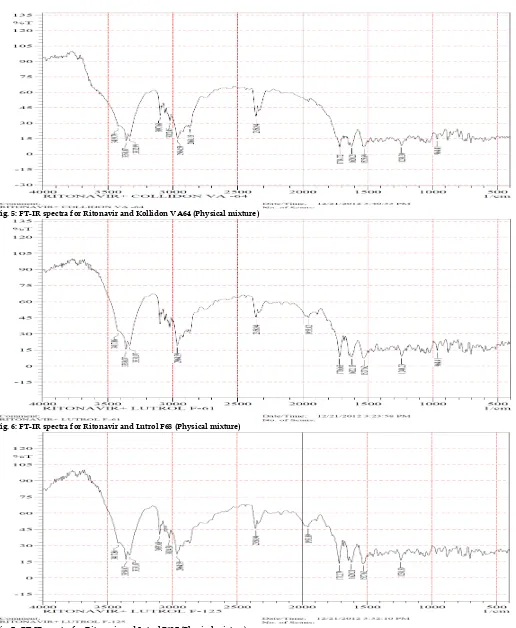
Fourier transform infrared spectroscopic study (FTIR)
FT-IR analysis of solid dispersion was carried out to observe the possibility of any functional group interactions between the drug and polymer. FT-IR spectra revealed absence of any interaction since, no
variations or shifting in the specific absorption bands of functional group was observed.
0.00 2.00 4.00 6.00
Time [min] -15.00 -10.00 -5.00 0.00 mW DSC 100.00 150.00 C Temp
121.29x100C Onset
129.84x100C Endset
118.03x100C
Start 134.08x100C
End 125.32x100C
Peak
-267.84 x100mJ -69.57 x100J/g
Heat
-13.88 x100mW
Height 5.00x100mW
File Name: RITONAVIR.tad Detector: DSC60 Acquisition Date 11/02/14 Acquisition T ime12:55:49 Sample Name: RITONAVIR Sample Weight: 3.850[mg] Annotation:
[T emp Program] Start T emp 75.0 Temp Rate Hold T emp Hold T ime [C/min ] [ C ] [ min ]
20.00 175.0 0
Thermal Analysis Result
RITONAVIR.tad RITONAVIR.tad
Temp DSC
Fig. 1: DSC thermogram of Ritonavir
0.00 10.00 20.00 30.00
Time [min] -1.00 0.00 1.00 2.00 mW DSC 100.00 200.00 300.00 C Temp
150.01 x100C
Onset 168.69 x100C
Endset 151.58 x100C
Start 170.45 x100C
End 156.59 x100C Peak
-5.13 x100mJ -2.22 x100J/g Heat
-0.04 x100mW
Heig ht 49.74 x100C
Onset 93.23 x100C
Endset 49.55 x100C Start
96.54 x100C
End 70.59 x100C Peak
-93.01 x100mJ -40.26 x100J/g Heat
-0.40 x100mW
Heig ht
File Name: P-1.tad Detector: DSC60 Acq uisition Date 12/03/05 Acq uisition Time 17:24:48 Sample Name: P-1 Sample Weig ht: 2.310[mg ] Annotation: [Temp Prog ram]
Start Temp 50.0 Temp Rate Hold Temp Hold Time [C/min ] [ C ] [ min ]
10.00 300.0 0
Thermal Analysis Result
P-1.tad P-1.tad
Temp DSC
Fig. 2: DSC thermogram of Kollidon VA 64
0.00 10.00 20.00
Time [min] -5.00 -4.00 -3.00 -2.00 -1.00 0.00 mW DSC 100.00 200.00 C Temp
133.65 x100C
Onset 141.24 x100C Endset
133.22 x100C
Start 138.48 x100C End
136.13 x100C
Peak
-3.79 x100mJ
-1.01 x100J/g
Heat
-0.17 x100mW Heig ht 49.54 x100C
Onset 100.54 x100C Endset
49.47 x100C
Start 103.78 x100C End
77.08 x100C Peak
-190.74 x100mJ
-50.73 x100J/g
Heat
-0.74 x100mW
Heig ht
1.00x100mW
File Name: R-4.tad Detector: DSC60 Acq uisition Date 12/03/05 Acq uisition Time 12:28:31 Sample Name: R-4 Sample Weig ht:3.760[mg ] Annotation: [Temp Prog ram]
Start Temp 50.0 Temp Rate Hold Temp Hold Time [C/min ] [ C ] [ min ]
10.00 275.0 0
Thermal Analysis Result
R-4.tad R-4.tad
Temp DSC
Fig. 3: DSC thermogram of SD
100.00 200.00 300.00
Temp [C] -6.00
-4.00 -2.00 0.00
mWDSC Thermal Analysis Result
R-4.tad P-1.tad R-1.tad DSC DSC DSC
Fig. 5: FT-IR spectra for Ritonavir and Kollidon VA64 (Physical mixture)
Fig. 6: FT-IR spectra for Ritonavir and Lutrol F68 (Physical mixture)
Fig. 7 : FT-IR spectra for Ritonavir and Lutrol F127 (Physical mixture)
Table 4: TLC analysis of Ritonavir solid dispersion Batch
code Rf value Batch code Rf value Batch code Rf value
RA1 0.807 RH1 0.813 RL1 0.81
RA2 0.819 RH2 0.806 RL2 0.8125
RA3 0.81 RH3 0.824 RL3 0.817
RA4 0.828 RH4 0.83 RL4 0.829
RA5 0.814 RH5 0.819 RL5 0.8165
RA6 0.805 RH6 0.808 RL6 0.8065
Thin layer chromatography
TLC analysis showed the calculated Rf value for the
different solid dispersions for Ritonavir. It was observed that pure drug & SD had similar Rf value
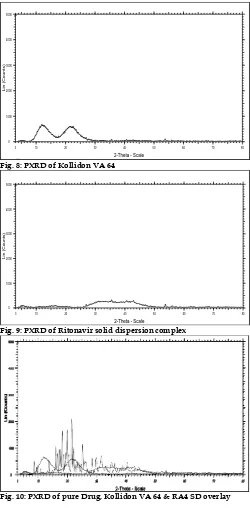
Int. J. Pharm. Sci. Drug Res. July-August, 2015, Vol 7, Issue 4 (321-328) Powder X-ray Diffraction (PXRD) Analysis
The crystalline nature of pure drug was again confirmed by powder X-ray diffraction. The sharp peaks revealed in drug PXRD justify that drug was present in crystalline form. But solid dispersion RA4 PXRD doesn’t showed any sharp peak in the PXRD analysis represent that there was absence of crystalline structure in Kollidon VA 64 polymer. Also the optimized formulation of spray drying solid dispersion didn’t show any sharp peak as given in pure drug alone. Hence it showed that the drugs were converted into amorphous form from crystalline form.
P1
Operations: Smooth 0.150 | Background 0.380,1.000 | Import
File: SAIFXR120504A-07(P1).raw - Step: 0.020 ° - Step time: 31.2 s - WL1: 1.5406 - kA2 Ratio: 0.5 - Generator kV: 40 kV - Generator mA: 35 mA - Type: 2Th/Th locked
L
in (C
o
u
n
ts)
0 1000 2000 3000 4000 5000
2-Theta - Scale
3 10 20 30 40 50 60 70 80
Fig. 8: PXRD of Kollidon VA 64 R3
Operations: Smooth 0.150 | Background 0.055,1.000 | Import
File: SAIFXR120504A-06(R3).raw - Step: 0.020 ° - Step time: 31.2 s - WL1: 1.5406 - kA2 Ratio: 0.5 - Generator kV: 40 kV - Generator mA: 35 mA - Type: 2Th/Th locked
L
in (C
o
u
n
ts)
0 1000 2000 3000 4000 5000
2-Theta - Scale
3 10 20 30 40 50 60 70 80
Fig. 9: PXRD of Ritonavir solid dispersion complex
Fig. 10: PXRD of pure Drug, Kollidon VA 64 & RA4 SD overlay
Scanning electron microscopy (SEM)
From the SEM analysis images it was seen that the API Ritonavir were crystalline flakes in nature& the Kollidon VA 64 was in the form of amorphous powder
lumps. But after spray drying solid dispersion the microsphere were formed & the drug might be entrapped in the core of polymer which is main phenomenon for solubility enhancement. The polymer coat reduced the surface tension; enhance the wettability, solubility & ultimately dissolution.
Fig. 11 : SEM of Ritonavir drug powder
Fig. 12: SEM image of Kollidon VA 64
Fig. 13: SEM image of RA4 SD
UV spectral characteristics
Fig. 14: UV spectrum overlay graph of Ritonavir API & solid dispersions
Table 5: Physical properties of Ritonavir solid dispersions
Method Polymer Colour Physical properties of solid dispersions Appearance Flow properties
Spray drying method Kollidon VA64 Lutrol F-68 White White Fluffy powder Fluffy powder Fine powder Fine powder
Lutrol F-127 White Fluffy powder Fine powder
Table 6: Drug content uniformity analysis of Ritonavir solid dispersion
Batch code % Content Batch code % Content Batch code % Content
RA1 98.88 ± 1.80 RH1 99.03 ± 1.10 RL1 99.27 ± 1.34
RA2 100.08 ± 1.50 RH2 99.0 ± 2.10 RL2 98.78 ± 1.63
RA3 102.0 ± 1.60 RH3 99.82 ± 1.60 RL3 98.29 ± 1.21
RA4 99.20 ± 1.65 RH4 99.63 ± 1.65 RL4 100.2 ± 1.20
RA5 100.20 ± 1.20 RH5 101.21 ± 1.10 RL5 100.1 ± 1.36
RA6 99.90 ± 1.75 RH6 99.0 ± 0.95 RL6 99.0 ± 2.10
Table 7: Saturated solubility analysis of Ritonavir solid dispersion Batch
code
Solubility (µg/mL)
Batch code
Solubility (µg/mL)
Batch code
Solubility (µg/mL)
RA1 41.805 RH1 35.55 RL1 38.52
RA2 64.96 RH2 53.1 RL2 52.26
RA3 85.375 RH3 71.325 RL3 68.85
RA4 126.76 RH4 91.53 RL4 97.54
RA5 148.92 RH5 97.44 RL5 112.52
RA6 161.59 RH6 102.87 RL6 134.29
EVALUATION OF SOLID DISPERSION
The physical evaluation of prepared solid dispersion showed that all the samples were fine white fluffy powder prepared by spray drying method.
Drug content uniformity analysis
Assay (i.e. drug content uniformity) of Ritonavir solid dispersions were determined by the UV analysis. All the readings were carried out in triplicate & calculated as mean ± S.D. It was found that the drug content within range 98%- 102% of drug content.
Saturated solubility analysis
Saturated solubility analysis studies of Ritonavir showed an increased solubility with increase in the concentration of carrier. The solubility result for different carrier in different concentration with Ritonavir. Among the carriers used Kollidon VA 64 showed the promising solubility enhancement. Increase in weight fraction of the hydrophilic polymer resulted in improved saturation solubility. Water was used as
dissolution media in the dissolution system to prove aqueous solubility enhancement.
Fig. 15: Saturated solubility analysis of Ritonavir solid dispersion
Wettability study
Table 8: Wettability analysis of Ritonavir solid dispersion Batch
code
% Wetting
Batch code
% Wetting
Batch code
% Wetting
RA1 14 RH1 9 RL1 12
RA2 25 RH2 12 RL2 17
RA3 49 RH3 16 RL3 32
RA4 57 RH4 21 RL4 41
RA5 64 RH5 28 RL5 49
Int. J. Pharm. Sci. Drug Res. July-August, 2015, Vol 7, Issue 4 (321-328)
Fig. 16: Wettability analysis of Ritonavir solid dispersion
In vitro dissolution study of Ritonavir Pure drug
Table 9: Percent release of pure Ritonavir
Time (min) 0 10 20 30 40 50 60
Pure drug 0 2.596 4.571 5.653 7.178 7.829 8.812
Fig. 17: Percent release of pure Ritonavir
Table 10: Percent release of RA batch SD Time
(min) RA1 RA2 RA3 RA4 RA5 RA6
0 0.00 0.00 0.00 0.00 0.00 0.00
10 2.12 2.42 2.41 5.86 32.42 25.03
20 17.83 9.68 16.67 38.52 55.41 45.71
30 20.49 17.86 49.76 82.52 72.57 52.95
40 27.99 28.36 64.72 94.92 81.40 60.64
50 30.53 37.45 64.24 97.45 88.21 66.73
60 34.37 50.42 63.61 100.29 89.52 71.21
Fig. 18: Percent release of RA batch SD
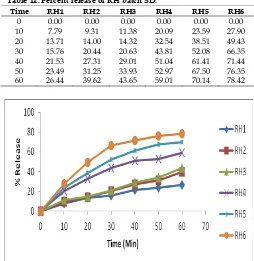
Table 11: Percent release of RH batch SD.
Time RH1 RH2 RH3 RH4 RH5 RH6
0 0.00 0.00 0.00 0.00 0.00 0.00
10 7.79 9.31 11.38 20.09 23.59 27.90
20 13.71 14.00 14.32 32.54 38.51 49.43
30 15.76 20.44 20.63 43.81 52.08 66.35
40 21.53 27.31 29.01 51.04 61.41 71.44
50 23.49 31.25 33.93 52.97 67.50 76.35
60 26.44 39.62 43.65 59.01 70.14 78.42
Fig. 19: Percent release of RH batch SD
Table 12: Percent release of RL batch SD
Time (Min) RL1 RL2 RL3 RL4 RL5 RL6
0 0 0 0 0 0 0
10 3.03 11.46 15.37 22.15 29.14 26.8
20 11.02 18 26.14 34.19 44.92 53.83
30 15.87 24.66 37.17 47.94 60.16 77.18
40 22.32 32.86 46.42 58.07 70.57 97.55
50 26.1 40.97 53.66 62.91 76.3 98.7
60 33.58 51.93 58.07 67.37 81.85 103.41
Fig. 20: Percent release of RL batch SD
concentration of Kollidon VA 64 increased than optimum concentration then it gave sustained or controlled release effect with solid dispersion formulation. Hence, with the increase in the concentration of Kollidon VA 64 dissolution time was increased.
More solubility enhancement was observed in prepared solid dispersion due to the kollidon VA 64 polymer. Significant improvement in saturation solubility was observed compared to API. This could be attributed to coating of drug particles and formation of polymer coat around the drug particles. Solid dispersion in the ratio of 1:4 for drug: Kollidon VA 64 showed increase in saturation solubility of Ritonavir very effectively. With respect to increase in polymer concentration the solubility enhancement was less in solid dispersion in 1:5 & 1:4 drug : Kollidon VA 64 as compare to Solid dispersion in 1:3 & 1:4 drug: polymer weight ratio. The same behavior was observed with the dissolution study of these two formulations hence solid dispersion of above drugs: Kollidon VA 64 selected as optimized batch.
REFERENCES
1. Leuner C, Dressman J. Improving drug solubility for oral
delivery using solid dispersions. Eur J Pharm Biopharm. 2000; 50: 47-60.
2. Serajuddin ATM. Solid dispersion of poorly water-soluble
drugs: early promises, subsequent problems and recent breakthroughs. J. Pharm. Sci. 1999; 88:1058-1066.
3. Patterson JE, James MB, Forster AH, Lancaster RW, Butler
JM, Rades T. Preparation of glass solutions of three poorly water soluble drugs by spray drying, melt extrusion and ball milling. Int. J. Pharma. 2007, 336(1): 22-34.
4. Lian Y. Amorphous pharmaceutical solids: preparation,
characterization and stabilization. Adv. Drug Deliv. 2001; 48:27-42.
5. Paradkar A, Ambike A. Characterization of curcumin PVP
solid dispersion obtained by spray drying. Int J Pharm. 2004; 271:281-286.
6. Van den Mooter G, Augustijns P, Blaton N, Kinget R.
Physico-chemical characterization of solid dispersions of temazepam with polyethylene glycol 6000 and PVP K30. Int J Pharm. 1998; 164:67-80.
7. Hansen T, Holm P, Rohde M, Schultz K. In vivo evaluation of
tablets and capsules containing spray-dried o/w-emulsions for oral delivery of poorly soluble drugs Int. J. Pharma., 2005; 293: 203-211.
8. Ambike A, Mahadik KR, Paradkar A. Spray dried
amorphous solid dispersion of simvastatin a low Tg drug in
vitro and in vivo evaluation. Pharma. Res. 2005; 22(6):990-998.
9. Couchman PR, Karasz FE. A classical thermodynamic
discussion on the effect of composition on glass-transition temperatures. Macromolecular 1978; 11:117-119.
10. Taylor LS, Zografi G. Spectroscopic characterization of
interactions between PVP and indomethacin in amorphous molecular dispersions. Pharm Res. 1997; 14:1691-1698.
11. Chiou WL, Riegelmann S. Pharmaceutical applications of
solid dispersion systems. J. Pharm. Sci. 1971; 60:1281-1302.
12. Karavas E, Georgarakis M, Docoslis A, Bikiaris D. Combining
SEM, TEM, and micro- Raman techniques to differentiate between the amorphous molecular level dispersions and nanodispersions of a poorly water-soluble drug within a polymer matrix . Int J Pharm. 2007; 40:76-83
13. Katariya VR, Karva GS, Shahi SR. Spectrophotometric
estimation of ritonavir. Inventi Rapid: Pharm Analysis & Quality Assurance, 2013.
14. Takeuchi H, Nagira S, Yamamoto H, Kawashima Y. Solid
dispersion particles of tolbutamide with fine silica particles by the spray-drying method. Powder Technol. 2004; 141:187-195.
15. Takeuchi H, Handa T, Kawashima Y. Spherical solid
dispersion containing amorphous tolbutamide embedded in enteric coating polymers or colloidal silica prepared by spray drying technique. Chem. Pharm. Bull. 1987; 35:3800-3806.
16. Chiou WL, Riegelman S. Oral absorption of griseofulvin in
dogs. Increased absorption via solid dispersion in polyethylene glycol 6000. J. Pharm. Sci. 1970; 59: 937-942.
17. Chauhan B, Shimpi S, Paradkar A. Preparation and
characterization of etoricoxib solid dispersions using lipid carriers by spray drying technique, AAPS Pharm. Sci. Tech. 2005.6: E405-E412.
18. Hancock BC, Zografi G. Characteristics and significance of
the amorphous state in pharmaceutical systems. J. Pharm. Sci. 1997; 86:1-12.
19. Takeuchi H, Nagira S, Yamamoto H. et al Solid dispersion
particles of tolbutamide prepared with fine silica particles by the spray-drying method. Powder Technology. 2004; 141:1187- 1195.