e-ISSN: 2278-067X, p-ISSN: 2278-800X, www.ijerd.com
Volume 14, Issue 1 (January 2018), PP.18-23
Deployment Strategy Analysis and Optimization of Police Patrols
in an Emergency Response System Using Stochastic Simulation
Javier Holguin-De La Cruz
11Department of Industrial and Manufacturing Engineering
Universidad Autónoma de Ciudad Juárez
Av. Del Charro Norte Edificio H 302b Cd. Juárez, Chihuahua, México,
Abstract:
We approach this problem from an operations research and logistics in the service and government sector perspective, based on the analysis of resource allocation in a safety Emergency Response System (ERS) of a large city in Mexico, to decrease response time of police patrols considering a reference ideal responsetime. Our research incorporates the second half of the 7th police district to previously published results of seven
police districts, since this district includes the equivalent of two districts. This research utilizes a discrete stochastic model based on characterized demand and system performance of 23 continuous days. The model first reproduces actual operations to validate its behaviour. Subsequently, alternative scenarios were configured to incorporate the ideal international response time reference of three minutes, and identify required resource configuration strategies for each police quadrant. Similar to previous research, results found that the recommended allocation level of resources was realistic to be accomplished.
Keywords:Police patrols allocation, Emergency Response Systems, EMR, Response time, Public safety
--- Date of Submission: 23-12-2017 Date of acceptance: 12-01-2018
---
I.
INTRODUCTION
The literature associates high levels of recorded crime and signs of disorder to high levels of reported fear. This association seems completely logical. If the fear has a real high incidence cause, a high incidence of reported fear is more than justified and expected. Urban insecurity is the term most commonly related to this problem found in large cities. However, this concept is becoming invalid in Mexico, since it includes all community sizes in the entire country, and extremely high insecurity levels totally out of proportion. The 2016 Perception and Victimization National Poll (ENVIPE) reports a 72.4% as the perception of public insecurity level in Mexico, among citizens of 18 years old and older [1]. The victimization statistics reported by the same source during the same period reflect that 34% of households had at least one victim of crime. These alarming statistics clearly demand radical and adequate strategies to contain this high incidence of crime aggravated in the last 15 years.
Police departments in every community have the fundamental function of responding to safety incidents, deterring, and preventing crimes [2], [3]. The average response time is one of the key performance parameters of a Safety Emergency Response System [4], which is measured from the time a call is answered to the arriving time of the emergency unit to the event’s location [5], [6]. The National Advisory Commission on Criminal Justice [7], in the United States of America, identified the ideal maximum response time of 3 minutes to service urgent events. In this context, the evaluated Emergency Response System has substantial room for improving current performance.
In this research we integrate the analysis of the second half of the 7th police district. This second half is basically another police district with its four quadrants and sixteen patrolling zones. To keep the consistency of prior research [8], where one police district only has had four police quadrants, the second half of the 7th police district is being considered as an independent police district. Likewise to the evaluation of the other police districts, this research follows the same sequence of analysis including: (1) characterization of demand for service and service performance parameters, (2) modeling ideal present conditions identified as Basic Proposal scenario, (3) modeling scenario with 3 minutes maximum response time restriction [7], (4) identify ideal patrol inventory levels for police quadrants, and (5) identify areas of opportunity for improvement. The simulation software utilized by our research was ProModel 2010.
The relative location of the second half of the 7th police district is towards the southwest of the city. The Emergency Response System of the city is composed by eight police districts, and the city´s population was
II.
LITERATURE
REVIEW
The identification of the optimum allocation of resources including personnel and equipment to an emergency response system that allows the minimization of the service response time, to or under a given time value, is a research problem identified in the literature [10]. However, this problem has been studied since the 1950´s, and with more frequency in the 1960´s and 1970´s, by scholars in multiple fields including Operations Research and Industrial Engineering [11], [12], [13]. Since then, this problem continues to be studied incorporating new methodologies.
A review of the historic significant contributions that the disciplines of Operations Research / Management Science have made to improve performance of emergency response systems since the 1960´s using methodologies such as simulation and queueing models is found in [13]. Response time is a function of multiple factors including travel distance. To minimize travel distance, route minimization algorithms can be used. An example of this algorithm is the shortest path utilized in [14]. Response time is also affected by the sizes and shapes of the geographic patrolling zones and districts. The redistricting of police patrol districts is based on several methodologies that propose new geographical district designs with the objective of improving overall performance [15], [4].
Additional methodologies to improve performance of emergency response systems include mathematical programming [16], the hypercube and hyper spatial queueing models [17], discrete event simulation [18], [19], [20], and agent-based simulation [21], [2].
III.
METHODOLOGY
Our simulation approach models one police quadrant at a time of the four quadrants in a police district allowing the particular characterization of the actual performance and the identification of ideal allocation of resources. However, given the scope of the format of the article, averages of four quadrants in districts are reported. Each quadrant was modeled ten replicates of the real observed time of 552 hours. Emergency Response System´s relevant processes were probabilistically characterized. Actual and proposed modeling scenarios were considered and respectively identified as BP-Actual and RT3M.
Ideal scenario RT3M differentiates from scenario BP-Actual by utilizing a maximum response time of 3 minutes probabilistically distributed as opposed to the actual response time. In both scenarios, the patrol allocation considered one dedicated patrol Pdj, where sub index d identifies the patrol number from 1 to 4 and
sub index j denotes the patrol zone from 1 to 4. Additionally, the police quadrant had four back up police patrols Bij, which were used by priority, and where sub indexes i and j denote back up patrol number and zone number
respectively. The model was verified by confirming adequate functionality, and validated observing assumptions and input-output compliance.
Simulation results were utilized as a reference to recommend an average ideal number of police patrols in every police district in addition to the dedicated patrol in each patrolling zone.
IV.
RESULTS
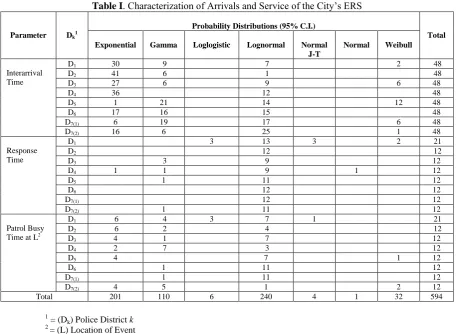
In this section we present the results of the characterization of the processes directly involved in attending a call for service in the Emergency Response System, as well as the simulation results of both scenarios described previously. Table 1 illustrates the accumulated probability distributions by district for the inter arrival time, response time and patrol busy time. Focusing on the results for the second half of District 7th identified as D7(2), we observe that inter arrival time was primarily described by Lognormal (52.08%), as well as by Exponential (33.33%), and Gamma (12.5%) distributions. Likewise, for the performance parameter response time, the probability distributions that best describe it are Lognormal (91.66%) and Gamma (8.33%). Similarly, for the parameter patrol busy time at the location of the event, the probability distributions Gamma (41.66%), Exponential (33.33%), Weibull (16.66%), and Lognormal (8.33%), explain its behavior.
An example of a Cumulative Distribution Function (CDF) for one police quadrant in the second half of district 7th for priority one calls for service, illustrates that only 1.82% of the calls were attended with a response time of 3 minutes or less. A further analysis of this CDF for larger response times presents that 52.1% of the calls were serviced with a response time of 10 minutes or less, 84.8% with a response time of 20 minutes or less, 94.5% with a response time of 30 minutes or less, and 98.2% with a response time of 42.4 minutes or less. Based on this sample evaluation, it is observed that there is considerable opportunity for improvement.
Table I. Characterization of Arrivals and Service of the City’s ERS
Parameter Dk1
Probability Distributions (95% C.I.)
Total Exponential Gamma Loglogistic Lognormal Normal
J-T
Normal Weibull
Interarrival Time
D1 30 9 7 2 48
D2 41 6 1 48
D3 27 6 9 6 48
D4 36 12 48
D5 1 21 14 12 48
D6 17 16 15 48
D7(1) 6 19 17 6 48
D7(2) 16 6 25 1 48
Response Time
D1 3 13 3 2 21
D2 12 12
D3 3 9 12
D4 1 1 9 1 12
D5 1 11 12
D6 12 12
D7(1) 12 12
D7(2) 1 11 12
Patrol Busy Time at L2
D1 6 4 3 7 1 21
D2 6 2 4 12
D3 4 1 7 12
D4 2 7 3 12
D5 4 7 1 12
D6 1 11 12
D7(1) 1 11 12
D7(2) 4 5 1 2 12
Total 201 110 6 240 4 1 32 594
1
= (Dk) Police District k
2 = (L) Location of Event
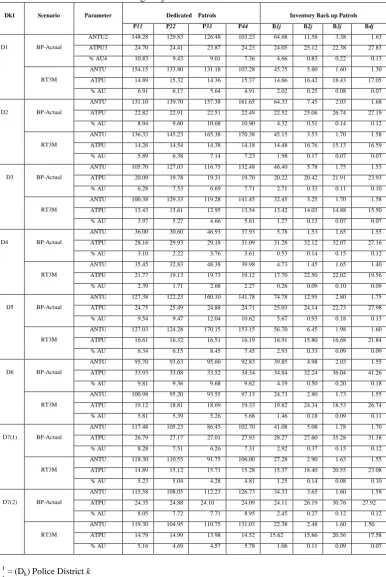
The simulation results are presented in Table 2 from police quadrant averages of ten replicates of 552 hrs, for police districts, and by simulation scenario. These results are integrated by three selected performance parameters: (1) Average Number of Times (a patrol is) Used, ANTU, (2) Average Time per (patrol) Usage, ATPU, and (3) Percent Average (patrol) Usage, %AU. An evaluation of results for the second half of District 7th illustrates the constant condition among districts of the insufficiency of only the dedicated patrols. This condition is apparent by the Average Number of Times Used (ANTU) value of patrol B1j for both scenarios registering values of 34.33 and 22.38 respectively for scenarios BP-Actual and RT3M. This back up patrol on average is absorbing 6.81% and 4.53% of the total demand for service respectively for scenarios BP- Actual and RT3M. In general terms it can be estimated that the average percentage of the total service attended by only the dedicated patrols is 91.83% and 94.34% for scenarios BP-Actual and RT3M. However, if instead of four dedicated patrols per quadrant there were only three available, the service coverage without generating a queue would be of only 66.7%. In relation to performance parameter Percent Average Usage (%AU), it is clearly observed that scenario BP-Actual has considerably higher values, specially for the all four dedicated patrols and at least the first back up patrol. This is explained due to the longer transportation times during which the patrol is being used, compared to the %AU generated for the patrols in the RT3M scenario, which uses a fraction of the maximum response time of three minutes for transportation.
Table II. Simulation Results by Scenario: District Comparisons of Quadrant Averages by Performance Parameters
Dk1 Scenario Parameter Dedicated Patrols Inventory Back up Patrols
P11 P22 P33 P44 B1j B2j B3j B4j
D1 BP-Actual
ANTU2 148.28 129.83 126.48 103.23 64.68 11.58 3.38 1.63 ATPU3 24.70 24.41 23.87 24.23 24.05 25.12 22.38 27.83 % AU4 10.83 9.43 9.01 7.36 4.66 0.83 0.22 0.13
RT3M
ANTU 154.15 133.80 131.18 107.28 45.75 5.60 1.60 1.30 ATPU 14.89 15.32 14.36 15.37 14.66 16.42 18.43 17.05 % AU 6.91 6.17 5.64 4.91 2.02 0.25 0.08 0.07
D2 BP-Actual
ANTU 131.10 139.70 157.38 161.65 64.33 7.45 2.03 1.68 ATPU 22.82 22.91 22.51 22.49 22.52 25.06 26.74 27.19 % AU 8.94 9.60 10.68 10.90 4.32 0.51 0.14 0.12
RT3M
ANTU 136.33 145.23 165.38 170.38 45.15 3.53 1.70 1.58 ATPU 14.26 14.54 14.38 14.18 14.48 16.76 15.13 16.59 % AU 5.89 6.38 7.14 7.23 1.98 0.17 0.07 0.07
D3 BP-Actual
ANTU 105.70 127.03 116.75 132.48 46.40 5.78 1.75 1.53 ATPU 20.09 19.78 19.31 19.70 20.22 20.42 21.91 23.93 % AU 6.28 7.53 6.69 7.71 2.71 0.33 0.11 0.10
RT3M
ANTU 100.38 129.33 119.28 141.45 32.45 3.25 1.70 1.58 ATPU 13.43 13.61 12.95 13.54 13.42 14.03 14.88 15.50 % AU 3.97 5.27 4.66 5.61 1.27 0.13 0.07 0.07
D4 BP-Actual
ANTU 36.00 30.60 46.93 37.93 5.78 1.53 1.65 1.55 ATPU 28.16 29.93 29.18 31.09 31.28 32.12 32.07 27.16 % AU 3.10 2.22 3.76 3.61 0.53 0.14 0.15 0.12
RT3M
ANTU 35.45 32.83 48.38 39.98 4.73 1.45 1.65 1.40 ATPU 21.77 19.13 19.73 19.12 17.70 22.50 22.02 19.56 % AU 2.39 1.71 2.68 2.27 0.26 0.09 0.10 0.09
D5 BP-Actual
ANTU 127.38 122.23 160.10 141.78 74.78 12.95 2.80 1.75 ATPU 24.75 25.49 24.88 24.71 25.03 24.14 22.73 27.98 % AU 9.54 9.47 12.04 10.62 5.67 0.93 0.18 0.13
RT3M
ANTU 127.03 124.28 170.15 153.15 56.70 6.45 1.98 1.60 ATPU 16.61 16.32 16.51 16.19 16.91 15.80 16.68 21.84 % AU 6.34 6.15 8.45 7.45 2.93 0.33 0.09 0.09
D6 BP-Actual
ANTU 95.70 93.63 95.60 92.83 39.85 4.98 2.03 1.55 ATPU 33.93 33.08 33.52 34.34 34.84 32.24 36.04 41.26 % AU 9.81 9.36 9.68 9.62 4.19 0.50 0.20 0.18
RT3M
ANTU 100.98 95.20 93.55 97.13 24.73 2.80 1.73 1.55 ATPU 19.12 18.81 18.69 19.33 19.82 24.34 18.53 26.74 % AU 5.81 5.39 5.26 5.68 1.46 0.18 0.09 0.11
D7(1) BP-Actual
ANTU 117.48 105.23 86.45 102.70 41.08 5.08 1.78 1.70 ATPU 26.79 27.17 27.01 27.93 28.27 27.60 35.28 31.38 % AU 8.28 7.51 6.26 7.31 2.92 0.37 0.15 0.12
RT3M
ANTU 118.30 110.55 91.75 106.00 27.28 2.90 1.63 1.55 ATPU 14.89 15.12 15.71 15.28 15.37 18.40 20.55 23.08 % AU 5.23 5.04 4.28 4.81 1.25 0.14 0.08 0.10
D7(2) BP-Actual
ANTU 115.58 108.05 112.23 126.73 34.33 3.65 1.60 1.58 ATPU 24.35 24.88 24.10 24.09 24.11 26.19 30.76 27.92 % AU 8.05 7.72 7.71 8.95 2.45 0.27 0.12 0.12
RT3M
ANTU 119.30 104.95 110.75 131.03 22.38 2.48 1.60 1.50 ATPU 14.79 14.99 13.98 14.52 15.62 15.86 20.56 17.58 % AU 5.16 4.69 4.57 5.78 1.06 0.11 0.09 0.07
1 = (D
k) Police District k
2
= (ANTU) Average Number of Times Used (From 4 Quadrants)
3
= (ATPU) Average Time per Usage (From 4 Quadrants): Transportation Time + Service Time at Location
4
= (%AU) Average Percent Utilization of Patrol Time (From 4 Quadrants)
0 2 4 6 8 10 12 D1 -P 11 D1 -P 33 D1 -B 1j D1 -B 3j D2 -P 22 D2 -P 44 D2 -B 2j D2 -B 4j D3 -P 11 D3 -P 33 D3 -B 1j D3 -B 3j D4 -P 22 D4 -P 44 D4 -B 2j D4 -B 4j D5 -P 11 D5 -P 33 D5 -B 1j D5 -B 3j D6 -P 22 D6 -P 44 D6 -B 2j D6 -B 4j D 7( 1) -P 11 D 7( 1) -P 33 D 7( 1) -B 1j D 7( 1) -B 3j D 7( 2) -P 22 D 7( 2) -P 44 D 7( 2) -B 2j D 7( 2) -B 4j P e r c e n t
P a t r o l s Average % Patrol Utilization
BP Actual RT3M
Fig. 1: Average % patrol utilization by patrol for districts D1, D2, D3, D4, D5, D6, D7(1), and D7(2)
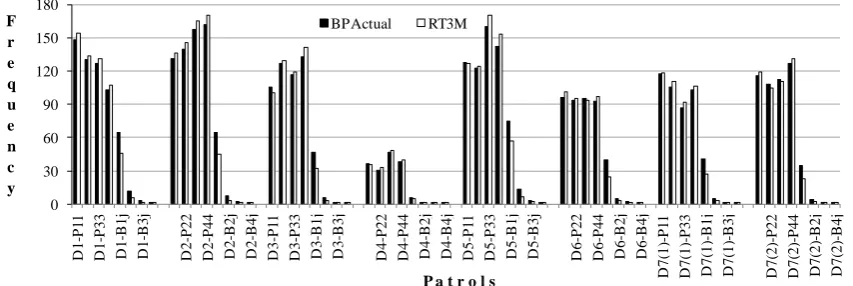
0 30 60 90 120 150 180 D1 -P 11 D1 -P 33 D1 -B 1j D1 -B 3j D2 -P 22 D2 -P 44 D2 -B 2j D2 -B 4j D3 -P 11 D3 -P 33 D3 -B 1j D3 -B 3j D4 -P 22 D4 -P 44 D4 -B 2j D4 -B 4j D5 -P 11 D5 -P 33 D5 -B 1j D5 -B 3j D6 -P 22 D6 -P 44 D6 -B 2j D6 -B 4j D 7( 1) -P 11 D 7( 1) -P 33 D 7( 1) -B 1j D 7( 1) -B 3j D 7( 2) -P 22 D 7( 2) -P 44 D 7( 2) -B 2j D 7( 2) -B 4j F r e q u e n c y
P a t r o l s
Average Patrol Frequency Utilization
BP Actual RT3M
Fig. 2: Average frequency utilization by patrol for districts D1, D2, D3, D4, D5, D6, D7(1), and D7(2)
V.
CONCLUSIONS
Fundamentally, results from the second half of the 7th Police District, confirm that all four dedicated patrols per quadrant in every district are necessary. In the case of the 7th district, dedicated patrols only covered 91.83% and 94.34% (respectively for BP-Actual and RT3M scenarios) of the demand for service, allowing the formation of a queue and forcing response times to inadequate values. Based on this limitation, the need to utilize at least one back up patrols in every police quadrant in all police districts is evident. Additional back up patrols will certainly improve gradually the emergency response system´s performance.
REFERENCES
[1]. INEGI, “Encuesta Nacional de Victimización y Percepción sobre Seguridad Pública ENVIPE 2016,” Instituto Nacional de Estadística Geografía e Informática, Aguascalientes, Ags., México, Boletín de Prensa No. 399/16 1-2, 2016.
[2]. Y. Zhang and D.E. Brown, “Police patrol districting method and simulation evaluation using agent-based model & GIS,” Security Informatics, vol. 2, pp. 1-13, 2013.
[3]. N. Devia and R. Weber, “Generating Crime Data Using Agent-Based Simulation,” Computers, Environment and Urban Systems, vol. 42, pp. 26-41, 2013.
[4]. T. Piyadasum, B. Kalansuriya, M. Gangananda, M. Malshan, D.H.M.N. Bandara, S. Marru, “Rationalizing Police Patrol Beats Using Heuristic-Based Clustering,” in Proc. 2017 Moratuwa Engineering Research Conference (MERCon),2017, p. 431.
[7]. NACCJ, “National Advisory Commission on Criminal Justice Standards and Goals: Task Force on Police,” Police, vol. 153, 1973.
[8]. J. Holguin-De La Cruz, and E. Lopez, “Minimizing Police Patrol Response Times using Stochastic Simulation,” in Proc. Proceedings of The 5th Annual World Conference of the Society for Industrial and Systems Engineering, 2016, p. 82.
[9]. INEGI, “IRIS-Scince,” Instituto Nacional de Estadística Geografía e Informática. Aguascalientes, Ags., México, 2010.
[10]. A.S. Zaki, H.K. Cheng, and B.R. Parker, “A Simulation Model for the Analysis and Management of an Emergency Service System,” Socio-Econ. Plann. Sci., vol. 31, pp. 173-189, 1997.
[11]. J.M. Chaiken, and R. Larson, “Methods for Allocating Urban Emergency Units: A Survey,” Management Science, vol. 19, pp. 110-130, 1972.
[12]. P. Kolesar, W.E. Walker, “A Simulation Model of Police Patrol Operations: Executive Summary,” The New York City Rand Institute, New York, NY, 1975.
[13]. L.V. Green and P.J. Kolesar, “Improving Emergency Responsiveness with Management Science,” Management Science, vol. 50, pp. 1001-1014, 2004.
[14]. N. Adler, A.S. Hakkert, J. Kornbluth, T. Raviv and M. Sher, “Location-Allocation Models for Traffic Police Patrol Vehicles on an Interurban Network,” Ann Oper Res, doi: 10.1007/s10479-012-1275-2, 2013. [15]. M. Camacho-Collados, F. Liberatore and J.M. Angulo, “Amulti-Criteria Police Districting Problem for
the Efficient and Effective Design of Patrol Sector,” European Journal of Operational Research, vol. 246, pp. 674-684, 2015.
[16]. B. Yang, Z.H. Hu and J.X. Zhou, “Configuration, Deployment, and Scheduling Models for Management and Optimization of Patrol Services,” Mathematical Problems in Engineering, pp. 1-13, 2015.
[17]. S. Ansari, S. Yoon and L.A. Albert, “An Approximate Hypercube Model for Public Service Systems with Co-located Servers and Multiple Response,” Transportation Research Part E 103, pp. 143-157, 2017. [18]. Y. Zhang and D.E. Brown, “Simulation Optimization of Police Patrol Districting Plans Using Response
Surfaces,” Simulation, vol. 90, pp. 687-705, 2014.
[19]. W. Wu, L, Shen, X. Ji and W. Jin, “Analysis of Freeway Service Patrol with Discrete Event-Based Simulation,” Simulation Modeling Practice & Theory, vol. 47, pp. 141-151, 2014.
[20]. J.P. Brooks, D.J. Edwards, T.P. Sorrel, S. Srinivasan and R.L. Diehl, “Simulating Calls for Service for an Urban Police Department,” in Proc. Proceedings of the 2011Winter Simulation Conference, 2011, p. 1770.
[21]. H. Chen, T. Cheng and S. Wise, “Developing an Online Cooperative Police Patrol Routing Strategy,” Computers, Environment and Urban Systems, vol. 62, pp. 19-29, 2017.