Features Extraction for Pattern Recognition Based on Local ZERNIKE
Moments
M.H.Saad1 and H.I.Saleh2
1, 2
Radiation Engineering Department, NCRRT, AEA, P. O. Box. 29, 8th District, Nasr City, Cairo, Egypt
1
ABSTRACT
Pattern recognition is one of the most common problems faced in scientific disciplines and engineering, which contains developing prediction classification models from historic data , training samples or Content-based image retrieval (CBIR). This paper proposes a new feature extraction technique for pattern recognition based on local Zernike moments. Moreover, the proposed technique segments an image to the most salient regions in order to provide efficient segmentation and treats problems occurred in earlier region-based segmentation algorithms. This technique extracts interest salient regions then calculates local Zernike moment for each region which works as local descriptors to be robust against scaling, rotation, illumination changes and background clutter. A spatial graph is constructed from the descripted salient regions then, the final image rank is calculated using greedy graph matching algorithm. The proposed technique is tested on Brodatz, Caltech101 and Wang databases. The results show that proposed technique is appropriate for accurately retrieving images than previous techniques even in distortion cases such as noise and geometric deformations.
Keywords: Local Zernike Moments, Graph Matching, Pattern Recognition, CBIR, YCbCrQuantization.
1. INTRODUCTION
Pattern recognition covers a wide range of information processing tasks of great practical significance. The application of pattern recognition spans from speech recognition to handwritten character classification and from medical diagnosis to Content-based image retrieval (CBIR) systems. In the recent years, the essential for content-based access to image from media records has taken the consideration of researchers. According to their efforts, advances of techniques that provide access to image are presented. These techniques have their roots in pattern recognition. The techniques are used to determining the similarity in the visual information content extracted from low-level features. For generation of database indices these features are then
clustered. Image retrieval techniques retrieving the most visually similar images to a given query image from databases of images. These techniques catalog images according to their visual characteristics, such as shape, color and texture.
The current content based image retrieval systems such as VIRAGE, IBM QBIC and MIRROR integrate the features to describe the image content [2]. These schemes used global histograms to describe image content however, the global histograms are sensitive to color distortions, cropping and intensity variations. Due to its growing demand in various applications, image data have significant developments in the processing technology and availability of large storage systems. This demand has provided a significant attention in the research community to develop methods to archive, query and retrieve this visual data based on their content. CBIR [3], employs many pattern recognition methods developed over the years. Pattern recognition methods have the following steps: Feature extraction; feature clustering; generation of database indices; and determining similarity in content of the query and database elements.
similarity measure to determine the final image rank that provide more efficient retrieval results for large image databases.
The paper is organized as follows: Section 2 states a variety of techniques have been established to provide region-based segmentation. Section 3 explains the proposed technique for region-based segmentation and features extraction based on local Zernike moments. Section 4 shows the experimental results of a pattern recognition retrieval system that implements the proposed retrieval technique and shows the effectiveness compared to other techniques. Finally, the conclusion is given in Section 5.
2. REGION BASED SEGMENTATION
Segmentation divides an image into a number of homogeneous regions and significant regions, such that each region has an identical set of properties. These sets of attributes may include textural, spectral values, contrast, or color properties. The result of segmentation is a number of identical regions, each having a unique label. An image is defined by a set of regions that are connected and non-overlapping, so that each pixel in the image gets a unique region label that specifies the region it belongs to.
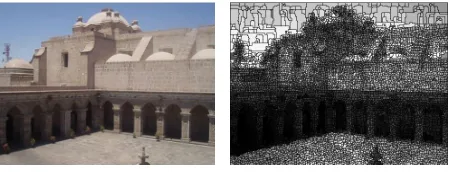
Varieties of techniques have been established to work region-based segmentation such as watershed. These techniques differ in the way they use to segment regions. Watershed splits the surface of gray level images into so-called catchment basins. From a geographical vision, a drop of water dropping on a surface will fall down until it reaches one of the surface deep bottoms. The set of all points leading to the same bottom is called the catchment basin. Seeds (one or more pixels from the bottom of the basin) usually initialize catchment basins. The watershed transforms begins by flooding the image from the seeds. Dams form the watershed which is built when basins encounter each other. These basins represent the regions. The watershed algorithm is very sensitive to gradient noise; it results in over-segmentation [8] as show in figure 1.
The watershed transform results in very large number of small regions, this result makes the extracted regions hardly useful. Marker image is the most commonly used solution [4]. The standard algorithms of detecting markers have a high computational cost and not automatically when processing highly textured images. Automatic techniques for the calculation of markers
have been studied [5, 6] but its usage is restricted to a specific domain of images.
Watershed was used in evolving a Region Based Image Retrieval system that took the segmented regions to represent the units of an image. This system allowed the user to specify a group of watershed regions within the query regions. The system overcame the over segmentation problem by using two scaling parameters: r and h. Parameter r is the size of the structuring element of dilation operators, whose application eliminates local minima of size less than r pixels. Parameter h is the height of elevation used to remove the local minima with low contrast. These two parameters were used to control the coarseness of the segmentation results: as r or h decreases, the number of generated regions increases. During their evaluation they used r = 1 and h = 3. The drawback of this system is that it did not deliver a generalized system for searching huge image databases.
Fig. 1. Watershed transforms sensitivity to gradient noise
3. THE PROPOSED TECHNIQUE
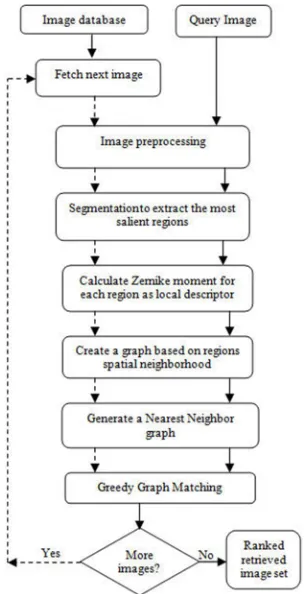
The proposed technique consists of the followings phases as shown in Figure 2. Firstly, the morphological operations on each image of the database to smooth the contours of objects and break narrow isthmuses and eliminate thin protrusions in addition they fuse narrow breaks and fill gaps in the contour and eliminate small holes. After this enhancement an YCbCr color
Fig. 2. The block diagram of the proposed technique
3.1 Morphological operations
Morphological operation of an image produces an output image of the same size of input image by applying a structuring element. For each image, in this work, we applied an opening followed by a closing. This operation leads to removing stem marks, dark spots, dark artifacts and attenuating brightness as shown figure 3 and figure 4.
3.2 YC
bC
rColor Quantization
In order to produce color histograms, color quantization has to be applied. Color quantization is the process of reducing the number of colors used to represent an image. A quantization scheme is determined by the color space and the segmentation (i.e., split up) of the color space used. A color space is the representation of color in a three dimensional space. YCbCr is a widely
adopted space in image segmentation and retrieval. Since the RGB color, space is highly sensitive to intensity difference. HSV color space has a weakness that dark colors were oblivious to hue changes and saturation. According to these limitations, many color spaces have been presented to improve color consistency or segmentation.
The YCbCr color space was chosen for this work after
performing many tests in the RGB, HSI, and HSV color spaces. The Y in YCbCr means the luminance
component, and Cb and Cr denote the chrominance
factors. The difference between YCbCr and RGB is that
the first represents color as brightness and two color difference signals, while the second represents color as red, green and blue. The YCbCr space was chosen for
the next reasons. The luminance component Y is independent of the color, so can be adopted to solve the illumination variation problem and it is easy to program. The skin color cluster is more compact in YCbCr than in
other color spaces, as well as, it has the smallest overlap between skin and non-skin data in under various illumination conditions. YCbCr is a family of color
spaces used in video systems which is broadly utilized in video compression standards. YCbCr is used for the
ITU-R BT.601 standard-definition television. The YCbCr is one of two primary color spaces used to
represent digital component video.
To construct the YCbCr histogram, each component of
the YCbCr color space is quantized into a certain number
of regions. The YCbCr histogram partitions the YCbCr
color space, where each partition represents a bin in the histogram and contains closely related colors with different shades. Therefore, the YCbCr color
quantization is applied to remove the differences of color shades existed between similar regions leading to fusing the neighboring regions with the same color attributes. An implementation of the YCbCr histogram
divides the Y into sixteen regions, whereas Cb and Cr are
each divided into eight. The three-color components then are linked, creating a (8x4 x4) histogram of 128 bins.
The watershed method produces many small basins due to many local minima in the input image. Each catchment basin corresponds to a minimum of the gradient. These minima are produced by small variations due to noise in the gray level values. The morphological operations and YCbCr color quantization partially reduce
the effect of over-segmentation. To overcome this problem completely, the numbers of segmented regions have to be precise. This is done by three steps: regions labeling; regions sorting and finally, region combination, as shown figure 3 and figure 4.
3.3 Description of Segmented Regions using local
Zernike moments
Local descriptors represent a pixel in an image through its local neighborhood content, which should be distinctive and robust to changes in viewing environment or deformations or localization errors. Local Features find the corresponding pixel locations in images, which provide the same amount of information about the spatial intensity patterns under different circumstances. A proper descriptor must be robust against occlusions and geometrical transformations and afford a local invariant description. The global Zernike Moments produce one moment value for whole image, whereas LZM are based on the evaluation of the moments for each region. LZM are shown to achieve significant success and robustness in face recognition. Zernike moments are used to represent local characteristics of an image segment. Zernike moments are defined over a set of complex polynomials on which Zernike moments compute their complex moment coefficients. It is successful in recognition of images that contain distinctive shape information. Complex Zernike moments of order n with repetition l are defined as
2 1 * 0 01
,
,
ml mlm
A
f r
Z
r
rdrd
(1)Where m=0, 1,2,…, and l takes on positive and negative integer values subject to the conditions 0l m and m-l are even. The symbol * denotes the complex conjugate, and the circular Zernike polynomials are defined over an unit circle as
,
Cos , Sin
exp
ml ml ml
Z x y
Z r
r
R r
il
(2)
And the real-valued radial polynomials, are given by
/2 0 !
1 ^ ^ 2
! ! ! 2 2 m l ml n m n
R r n r m n
m l m l
n s n
(3)The real-valued radial polynomials {Rml(r)} satisfy the relation
1 0 1 2 1n l m l m n
R r R r r d r
m
(4)The function f(x, y) can be expanded in terms of the Zernike polynomials over the unit disk as
0
, ,
N
m l m l
m l
m l e v e n
l m
f x y A Z x y
(5)
Where, N is the maximum order of moments. Let we have R images {x1,x2,x3,…,xR} used for training the
system, the moments from the zero order to the Nth order are calculated for these images, and the vectors of moments are stored off line. To recognize a test image xt, its vector of moments is also calculated and
finds the closest match, which minimizes the difference between the vector of the test images and all vectors stored in the database. However, these holistic moments were seen inadequate for the face images and for this reason, a novel face representation method called Local Zernike Moments (LZM) is shown to be successful in face recognition. The LZM method localizes the calculation of the moments around for each pixel. As a result, a complex moment image is estimated for each moment component. Final feature vector is obtained by concatenating the extracted phase-magnitude histograms at each sub region that is formed by dividing each moment image to non-overlapping sub regions. Local shape variations in the low-resolution face images are very important for face recognition. For this reason, LZM are used as local phase-magnitude histograms. In this framework, LZM is used as a local descriptor which provides a local invariant description and robust against occlusion and geometrical. A 128-bin histogram is generated for each segmented region and works as its local descriptor. Each image is described by a set of segmented regions distributed on its layout and each region will be associated with a 128-bin histogram as a local region descriptor. This set of regions works as a reduced description of the entire image.
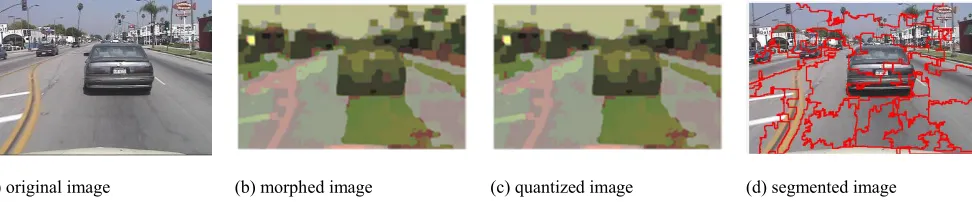
(a) original image (b) morphed image (c) quantized image (d) segmented image
(a) original image (b) morphed image (c) quantized image (d) segmented image
Fig. 4. The step results of segmentation process over one image from Caltech101database
3.4 Similarity Measure
Spatial graph considers the neighboring relationships between the non-overlapped extracted segmented regions. The spatial graph created by connecting edges from each node to its neighborhood nodes in a fixed neighborhood threshold
τ
. So two nodes
v1,v2
havean edge in graph if,
1 2d is t v ,v τ where,
1, 2
dist v v is the Euclidean distance between the
detected regions Dasigi and Jawahar indicated that the most optimal value for
τ
is one which models the sufficient number of edges that make the graph representation discriminative. So a region has edges only to its direct neighbors in the Voronoi diagram, so the graph evolves from the Voronoi diagram and model the spatial neighborhood of regions. The matching process works as follows, given two graphs G1 :
V1,E1
andG2:
V2,E2
, for each nodev
iin G1we associate a list of best matched nodes in G2according toa matching functionm v( i).
In this paper the matching function compares regions descriptors. The local descriptor was chosen to be the LZM. Given the node
v
i inG1and its associated best matched list of nodes, we need to find the best matched pair of nodes
v vi, j
for j among matched nodes in thebest matched list. We compare the neighborhood nodes of node
v
i with the neighborhood nodes of nodev
jand assign the rank of pair ( ,r v vi j),
( , ) ( , )
.
i j
i
num of matched neighbors of vi vj r v v
total num of neighbors of v
(6)
The chosen best matched pair is the one with the highest rank then, calculate the rank of best matched
pairs
bestR v
( )
i for each node inG
1 and assign a final similarity rank as the mean rank,1 ( i)
i
b e s t R v s i m i l a r i t y r a n k
n u m o f n o d e s i n G
(7)
For a certain query image, a nearest neighbor graph is constructed for each image in the database and the proposed final similarity rank is determined by applying the greedy nearest neighbor graph matching algorithm.
3.5 Performance Evaluation
To compute the ranking of the images returned by the retrieval system precision and recall metrics are used [8-9]. For a query image q having a defined ground truth images over image database R (q), let Q (q) be the retrieved result of images for that query. The precision of the retrieval is defined as the fraction of the retrieved images that are indeed relevant to the query.
(8)
The recall is the fraction of the relevant images that is returned by the query [11].
(9)
Top N performance measurements to evaluate a system over all the categories, [10] can be used. When submitting a query q to an image retrieval system, it returns N resulted of images ranked based on similarity between the query image and images database. Let the number of top similar images N. This work signifies
N i
PR q
as the precision of the top N returned ranked results. The aim of the user after submitting a query is to search for the most relevant images R(q). The precision
Precision Q q R qQ q
Recall Q q R q
R q
PRj, j=1, 2, … of the top N results of a query q is defined as:
(10)
So the average precision for all queries performed on a CBIR system for a certain N number of returned results is defined as:
(11)
Similarly, the recall REj, j=1, 2, … N of the top N
results of a query q is defined as:
(12)
And the average Recall for all queries is defined as:
(13)
To obtain a single objective measure the average normalized modified retrieval rank (ANMRR) combines the precision and recall. For a given query, M is the maximum number of ground truth images for all Q queries. For a given query q, each ground truth image k is assigned a rank value rank(k) that is equal to its rank in the ground truth images if it is in the first K where K=min[4R(q), 2M] query results; or a rank value K+1 if it is not. The average rank AVR (q) for query q is computed as:
1 N q kr a n k k A V R
R q
(14)The modified retrieval rank MRR (q) is computed as:
0 .5 0 .5
M R R q A V R q R q (15)
MRR (q) takes value 0 when all the ground truth images are within the first K retrieval results.
The normalized modified retrieval rank NMRR (q), which ranges from 0 to 1:
0.5 0.5
M R R q N M RR q
k R q
(16)
The average normalized modified retrieval rank ANMRR over all Q queries is
1
1 Q
q
A N M R R q N M R R q
Q
(17)The ANMRR is always in range of 0 to 1. The best matching quality of the query is the smallest value of this measure.
4. RESULTS AND DISCUSSION
The experiments are performed on the 112 image Brodatz, 9146 images Caltech101 Database and 1000 image Wang database. Brodatz contains 112 texture images of gray level with different background intensities. The CALTECH101 consists
of images of objects belonging to 101 categories about 40 to 800 images per category. It has query relevant images quite similar but with small geometric and photometric variations. The Wang database has 10 categories; each category has 100 images. It has object dissimilarity in query relevant images and large variations [11].
Table 1 shows the average precisions of the proposed system on Brodatz texture images toward CTCHIRS system, Huang’s method and Jhanwar’s method. The experimental results tell that the proposed system provides much higher accuracy compared to other techniques.
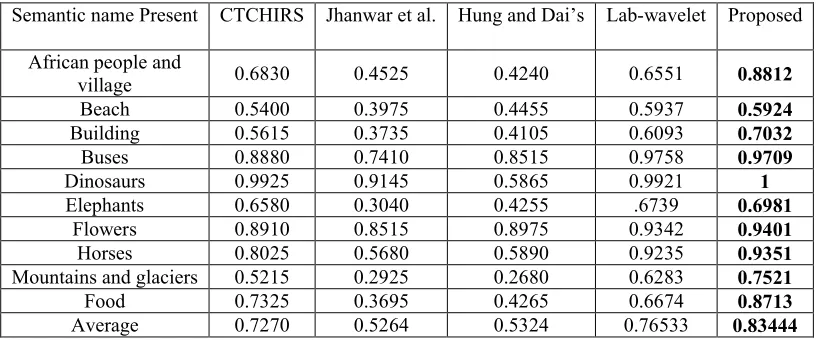
Table 2 shows the average precision for each category in the Wang database toward CTCHIRS system, Huang’s method, Jhanwar’s method and Lab-wavelet. The experimental results show that the proposed system provides much higher precisions with respect to other techniques.
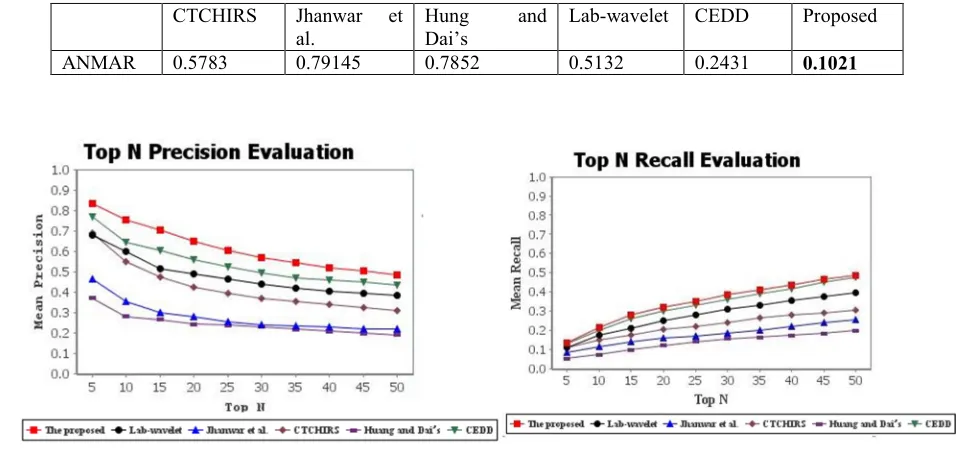
Table 3 shows the objective measure ANMRR to evaluate the performance of the proposed technique toward the others. The smallest value of this measure is 0.1021 so the better the matching quality of the proposed technique.
The top N precision and recall comparisons evaluate the performance of the proposed technique toward other previous techniques. These metrics consider that for each test query has a ground truth. The mean recall and mean precision measure the precision and recall for set of queries to evaluate a system for several queries. The top N precision and recall calculates the mean precision and recall for a set of queries for the top N returned results. In this paper, N ranges from 5 to 50 in steps of 5. The MIRROR image retrieval system divided the Wang database in 20 queries with a suggested ground truth which didn’t cover all databases categories. The
1 , 1; , , 0; N k N i ip R q if x y
PR q x y
if x y N
_ _1 _ _
Total Query count
N i
N i
PR q PR
Total Query count
1 , N k N ip R q
proposed technique and the compared methods are tested by 40 queries that cover all database categories. The CALTECH101 assigned ground truth has been used for evaluation. The results of the proposed retrieval technique have been compared with the results of the following techniques: CTCHIRS system, Huang’s method, Jhanwar’s method, Lab-wavelet and Color and edge directivity descriptor (CEDD).
Figure 5(a) shows that the proposed technique provides more precision than other techniques. The Lab-wavelet and CTCHIRS retrieval techniques haves low precision for images having large smoothed regions with less or no complexity in its structures because very few numbers of regions will be extracted. The techniques have degraded accuracy for images having complex spatial structure where query relevant images have large variations and object dissimilarity. The proposed technique describes salient region with LZM descriptors. This provides an approximation between smoothness and complexity.
Figure 5(b) shows that the proposed technique provides better recall than the other techniques. The CTCHIRS technique was designed to increase the precision of retrieval by combining three features; the co-occurrence
matrix (CCM) to describe the direction of textures, the difference between pixels of scan pattern (DBPSP) to describe the complexity of textures and the Color histogram for K-mean (CHKM) to describe color features. This technique used fixed window sizes to measure the CCM and DBPSP feature that made it suffering geometric variations problems. The proposed technique enhances the precision of retrieval which the extracted local regions using LZM which robust against occlusions and geometrical variations works as a clue for the existence of objects for better matching accuracy. Figures 6(a) and (b) show that the proposed technique provides better precision and recall against other categories when evaluated over the CALTECH101 database, as relevant images are quite similar. The proposed retrieval technique improves the precision and recall for images having large smoothed regions than other techniques. Moreover, the proposed technique takes the smooth details of images and gives an approximation between complexity and smoothness for images having complexity in structure which these regions have varying arrangement and size.
Table 1: The average precision the brodatz database
Table 2: The average precision for each category in the Wang database
Semantic name Present CTCHIRS Jhanwar et al. Hung and Dai’s Lab-wavelet Proposed
African people and
village 0.6830 0.4525 0.4240 0.6551 0.8812
Beach 0.5400 0.3975 0.4455 0.5937 0.5924
Building 0.5615 0.3735 0.4105 0.6093 0.7032
Buses 0.8880 0.7410 0.8515 0.9758 0.9709
Dinosaurs 0.9925 0.9145 0.5865 0.9921 1
Elephants 0.6580 0.3040 0.4255 .6739 0.6981
Flowers 0.8910 0.8515 0.8975 0.9342 0.9401
Horses 0.8025 0.5680 0.5890 0.9235 0.9351
Mountains and glaciers 0.5215 0.2925 0.2680 0.6283 0.7521
Food 0.7325 0.3695 0.4265 0.6674 0.8713
Average 0.7270 0.5264 0.5324 0.76533 0.83444
Q (q) 2 3 4 5 10 16
Huang and Dai’s
84.7 80.3 77.0 74.6 66.2 57.0
Jhanwar et al. 89.5 84.5 80.8 78.0 68.7 59.4
CTCHIRS 97.0 95.4 93.8 92.2 84.2 74.1
Table 3: ANMRR Results for the Descriptors
CTCHIRS Jhanwar et al.
Hung and
Dai’s
Lab-wavelet CEDD Proposed
ANMAR 0.5783 0.79145 0.7852 0.5132 0.2431 0.1021
a. The top N precision results for proposed approach compared to other techniques
b. The top N recall results for proposed approach compared to other techniques
Fig. 5. The evaluation of the top N precision and recall over Wang database
a. The top N precision results for proposed approach compared to other techniques
b. The top N recall results for proposed approach compared to other techniques
5. CONCLUSION
In this paper, a new region-based segmentation technique is presented. This segmentation technique is integrated with LZM to provide efficient retrieval in large collection of images. The new segmentation technique provides efficient segmentation and treats problems such as over segmentation. The proposed technique works by segmenting an image to the most salient regions then, calculate LZM that work as local descriptors. A spatial graph is generated by
detecting the spatial relationships between regions. A greedy graph-matching algorithm with a modified scoring function obtains the final image rank. The results showed that the proposed technique provides more accurate results than previous techniques.
REFERENCES
[1] Davar Giveki, Ali Soltanshahi, Fatemeh Shiri3and Hadis Tarrah. ”A New Content Based Image Retrieval Model Based on Wavelet Transform.” Journal of Computer and Communications, 2015.
[2] Iakovidou, Chryssanthi, et al. "Searching images with MPEG-7 powered localized descriptors: the SIMPLE answer to effective content based image retrieval." Content-Based Multimedia Indexing (CBMI), 12th International Workshop on. IEEE, 2014.
[3] Jain, Yogendra Kumar, and Rahul Yadav. "Content-based Image Retrieval Approach using Three Features Color, Texture and Shape." International Journal of Computer Applications, 2014.
[4] Boomilingam, Thenkalvi, and Murugavalli Subramaniam.
"Review on CBIR Trends and Techniques to Upgrade Image Retrieval." International Review on Computers and Software (IRECOS), 2014.
[5] Deep, Samundra, et al. "Pattern based object recognition in image processing. “Wavelet Active Media Technology and Information Processing (ICCWAMTIP) 11th International Computer Conference on. IEEE, 2014. [6] Chatzichristofis, Savvas A., et al. "Mean Normalized
Retrieval Order (MNRO): a new content-based image retrieval performance measure." Multimedia tools and applications, 2014.
[7] M. H. Saad, H. I. Saleh, H. Konber, M. Ashour, “CBIR System Based On Integration Between SURF And Global Features ", International Conference on Information Technology, 2013.
[8] M. H. Saad, H. I. Saleh, H. Konber, M. Ashour, “Integrated CBIR Using Texture, Fourier Descriptor and Color Histogram", International Journal of Digital Image Processing, July 2012.
[9] M. H. Saad, H. I. Saleh, H. Konbor, M. Ashour, "Image Retrieval based on Integration between YCbCr Color Histogram and Shape Feature ", International Computer Engineering Conference ICENCO 2011.
[10]Lin, Chuen-Horng, Rong-Tai Chen, and Yung-Kuan
Chan. "A smart content-based image retrieval system
based on color and texture feature." Image and Vision Computing, 2009.
[11]Mohamed Helala, Hala Zayed and Mazen Selim, "An Image Retrieval Technique Based on Composite Features and Graph Matching”, Second International Conference on Computer and Electrical Engineering, 2009.
[12]Chiang, Cheng-Chieh, et al. "Region-based image retrieval using color-size features of watershed regions."
Journal of Visual Communication and Image
Representation, 2009.
[13]N. Jhanwar, S. Chaudhurib, G. Seetharamanc, B.
Zavidovique. ”Content based image retrieval using motif co-occurrence matrix” Image and Vision Computing, 2004.