Combined DEA and Classification Analysis with
Case Study of Building Construction Company
1 Ray Tamtama; 2 Bagus Sartono; 3 Asep Saefuddin
1 Department of Statistics, Bogor Agricultural University
Bogor, Indonesia
2 Department of Statistics, Bogor Agricultural University
Bogor, Indonesia
3 Department of Statistics, Bogor Agricultural University
Bogor, Indonesia
Abstract - Construction is an activity undertaken by a group of people to create the physical building needed to meet human needs. Construction companies will not survive intense competition unless they can play efficiently. This study examines the efficient construction company with DEA (Data Envelopment Analysis) and continued by looking at the characteristics of efficient construction companies in Southeast Asia using classification analysis. Many domestic building construction companies in southeast Asia are inefficient than efficient companies. This is due to company inputs that are higher than company output. Efficient domestic building construction there are 12.6% of companies and inefficient there is 87.4% in Southeast Asia.
Keywords - Construction, DEA, Classification Analysis
1. Introduction
onstruction is an activity undertaken by a group of people to create the physical building needed to meet human needs. In general, there are three sectors of construction projects, namely buildings construction, infrastructure construction, and industrial construction. The construction project consists of the construction of housing, offices, schools, markets, hotels, and malls. Meanwhile, infrastructure construction projects include the construction of highways, toll roads, dams, and bridges. For industrial construction projects include the construction of refineries, power plants, and factories. The role of construction is very important in the economic growth of a country because with the many developments of facilities and infrastructure, economic growth of a country will be better [1].
With the existence of the Southeast Asia economic community opens opportunities in the competition of construction work between countries. The services of the construction sector are required to increase competitiveness in order to survive in a very competitive
market. One way a construction company does to increase competition by increasing efficiency. Construction companies will not survive intense competition unless they can play efficiently. Research related to the efficiency of Data Envelopment Analysis (DEA) method has been done in many countries. Park and friends analyzed the dynamics of construction business efficiency in Korea using the DEA method [2]. Langston developed the DEA method of comparison of construction performance in the five largest cities in Australia and the United States [3]. Nazarko and Chodakowska present the DEA method and the Tobit regression to analyze the productivity of the construction industry in Europe [4]. Park compares the efficiency and productivity of construction companies in China, Japan, and Korea using DEA and DEA-based Malmquist methods [5]. Arsyad and Wibowo compare the efficiency of one contractor to another and get the best performing contractor to compare to other companies using a sample of 24 large contractors operating in Indonesia [6].
In this study will examine building construction companies by combining the DEA method with classification analysis. Researchers would like to see
efficient construction companies and characteristics of efficient construction companies in Southeast Asia.
2. Data Envelopment Analysis
Data Envelopment Analysis is an analytical technique that uses a linear program to measure efficient Decision-Making Units (DMUs) [7]. The decision-making unit is a collection of a specific organizational unit such as a university, school, hospital, police station, tax office, prison, defense base, company or even medical practitioner. The DEA method is intended to measure how efficiently a DMUs use available resources to generate a number of advantages [8]. Resources can also be referred to as inputs and benefits as outputs.
Let be defined I as inputs and O as outputs. If one DMU unit has N inputs and M outputs, then Ii denotes the i-th input with i=1,2,3, ..., N and Oj is the j-th output with
j=1,2,3, ..., M. The total number of inputs and outputs are
represented by each of N and M, where N, M > 0. In DEA, some inputs and outputs can be combined linearly by weight. ui is the weight set for Ii and vj is the weights set for Oj. The weight of the DMU is determined by using linear programming by maximizing its efficiency. DMU efficiency requirements are limited to values between 0 and 1.
The mathematical formula is used to compare the efficiency of as much as D DMU presented in Eq. (1).
1 1 1 max
Ni id id M j jd jd
d v O u I
E (1)
subject to
1 max
0 Ed ; vjduid 0
where Ed is the efficient value of the d th DMU, Ojd is the
j-th output of the d-th DMU, vjd is the weight of the output,
Ijd is the j-th input of the d-th DMU, ujd is the weight of the input. Let’s say the 1st DMU is compared to the other DMUs (all DMUs except the 1st DMU) with the 1st DMU for reference. If the reference value is greater than the value of another DMU, then it can be said that the 1st DMU is efficient. In contrast, the reference value is smaller than other DMU values, it can be said that the 1st DMU is inefficient.
3. Classification Analysis
Tree classification is a classification analysis in the form of tree structure. This method is one of the nonparametric
statistical methods used to group response variables through the characteristics of the accompanying independent variables and identify the variables that differentiate the groups from one group to another. The naming of the tree model depends on the response variable scale, if the response variable is categorical then called the classification tree and if the response variable is continuous it is called the regression tree [9]. The classification tree is more widely used in the case of categorical response variables with independent variables that can be numerical or categorical.
The classification tree is obtained through an algorithm to separate or isolate a set of data by determining the best variable for attachment. The result of data placement into two called nodes. In each of the nodes that are formed again to be two new nodes until the resulting node end (leaf). The insertion process will stop with the condition of the node contains the observation of a class of response variable (homogeneous), the node contains observations with identical predictor variables, and the depth of the tree has reached the maximum depth. For the continuous free variable Xj, the attachment is used Xj ≥ c, where c is the middle value between the two observed classes against the Xj variable. For categorical variables, the attachments that occur arise from all possible insulation based on the formation of loose nodes. If the Xj variable is a nominal categorical variable with L category, then there will be attachment 2(L–1)–1, whereas if it is an ordinal categorical variable, then there will be attachment L-1. The commonly used insulation method for data that contains two categories in the response variable is IG (Information Gain) presented in Eq. (2).
n i i i ETT T T E IG 1 (2) with
T p
p p
p
p
E log2 1 log21
where p is the proportion of category one, (1–p) is the proportion of category two. The best insertion is obtained with the largest information gain of some possible free variable attachment.
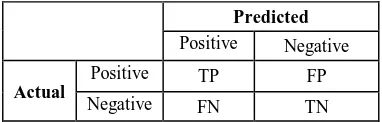
classification is higher. The virtues of classification usually involve two classes that one class is considered more important to predict than others. The class that takes precedence over a classification process is called the positive class, while the other class is called the negative class. Of the two types of classes, there will be two types of predicted class of positive predictions and negative predictions. Prediction is said to be accurate if the predicted result of the actual observation comes from a positive predicted positive class called true positive (TP). For the actual observation comes from the negative predicted negative class is called true negative (TN). Conversely, if the actual negative but predicted positive is called false positive (FP) and if the actual positive but predicted negative is known false negative (FN).
Table 1: Tabulation between actual and predicted values
Predicted
Positive Negative
Actual
Positive TP FP
Negative FN TN
The basic measures used to assess the virtues of classification are sensitivity, specificity, and accuracy. Sensitivity measures the accuracy of positive class predictions. Specificity measures the level of prediction accuracy in a negative class. Accuracy is the level of accuracy of positive and negative class predictions of the percentage of the number of correct predictions on all observations in the data cluster. The term accuracy is often referred to as the correct classification rate. The opposite is known as the misclassification rate obtained by subtracting the accuracy of 1 or 100%.
4. Research Methods
4.1 Data Setup
In this study used literature study through journals, books, internet, and others. This study was conducted by collecting annual financial report data from five countries in Southeast Asia, namely Philippines, Indonesia, Singapore, Malaysia, and Thailand. Recorded as many as 164 construction companies in Southeast Asia including the Philippines, Indonesia, Malaysia, Singapore, and Thailand. Of the five countries will be sampled including 8 Philippine companies, 11 Indonesian companies, 44 Malaysian companies, 81 Singapore companies and 20 Thailand companies.
4.2 Methodology
Method of data analysis for this research using five stages such as data preparation, descriptive analysis, calculate efficiency with DEA method, identify the characteristics of the efficient company and do classification analysis. The researcher performs data preparation from the annual report of 164 building construction companies from 2010 to 2016 by selecting the corresponding variables. These variables such as domestic building price per square meter, equity, liability, cost of construction, revenue, net profit, and earnings before interest taxes. Because in each country using different currency units then the data on each variable is converted to dollars American (US$). In descriptive analysis will show the comparison of values on each variable in various countries. To calculate efficiency with the DEA method, set the input and output variables. The input variables include domestic building price per square meter, equity, liability, and cost of construction. The output variables include revenue, net profit, and earnings before interest taxes. Exploring the variables such as earnings before interest tax to sales ratio (EPR), debt to equity ratio (DER), asset to liability ratio (ALR), cash to current liability ratio (CCR) which are characteristics of efficient building construction companies drawn from the company's annual financial statements. The classification analysis used is classification tree. By forming a regression tree model, the researcher wanted to classify an efficient building construction company based on its characteristics.
3. Discussion
Of the total 821 financial statements of building construction companies in Southeast Asia, 55 companies from the Philippines, 67 companies from Indonesia, 292 companies from Malaysia, 275 companies from Singapore and 132 companies from Thailand. Factors used to see efficient building construction companies include building prices per square meter, equity, debt, cost of revenue, income, earnings before interest and taxes, and operating income.
square meter every year. The price of domestic building in the Philippines in 2010 is lower than Thailand with a margin of 30 US$ per square meter. But in 2013 the price of domestic building in the Philippines 890 US$ per square meter and well above the price of domestic building in Thailand until 2016. Domestic building prices in Singapore is highest compared to the other four countries.
In 2010 to 2012, the equity of building construction companies in Southeast Asia decreased 59 million US$ and rose to 257 million US$. Construction company debt has a higher value than its equity. In 2010 the debt value of building construction companies in Southeast Asia reached 443 million US$ and reached its peak in 2013 with an increase of 24 million US$. Production costs are at US$ 252 million, 36 million lower than US$ equity in 2010. But in 2012 to 2014 the cost of production is higher than the equity of up to 33 million US$ in 2014. In 2010 to 2011 revenues construction companies in Southeast Asia decreased from 330 million US$ to 318 million US$. But until 2013 the construction company's revenue rose to 351 million US$. Earnings before interest taxes also increased from 30 million US$ in 2010 to US$ 46 million in 2016. Operating income increased from US$ 4 million in 2010 to US$ 21 million in 2016. Overall revenue of construction companies the building is bigger than the capital issued by the company. However, the revenue still does not cover the high debts of the company and the relatively high production cost, especially in 2012 until 2014. This is what causes the company's profit is quite low range of 3 million US$ to 21 million US$.
Fig. 1 Percentage efficiency of domestic building construction companies in Southeast Asia
The analysis by the DEA method was performed for this study using data taken from the annual report of building construction companies. Variables used there are two types of input variables and output variables. The price of
building construction, equity, total debt, and production cost are used as input variables. The output variables are analyzed such as income, operating profit, earnings before interest taxes. Based on Figure 1, in 2010 there are 10% of domestic building construction companies in Southeast Asia efficient and 90% of companies are inefficient. In 2011 there were 23% efficient companies. In 2015 and 2016 there is an efficient 2% decline in firms. Efficient domestic building construction companies from 2010 to 2016 declined, while inefficient companies increased. Inefficient Southeast Asian building construction companies are more efficient than efficient companies.
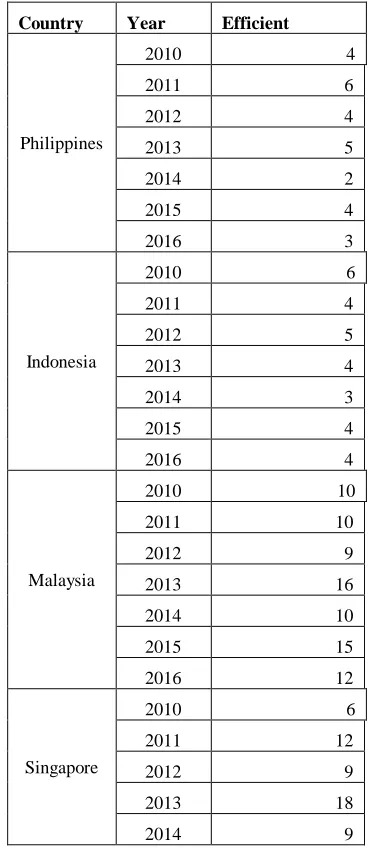
Table 2: Efficient domestic building construction companies in five Countries
Country Year Efficient
Philippines
2010 4
2011 6
2012 4
2013 5
2014 2
2015 4
2016 3
Indonesia
2010 6
2011 4
2012 5
2013 4
2014 3
2015 4
2016 4
Malaysia
2010 10
2011 10
2012 9
2013 16
2014 10
2015 15
2016 12
Singapore
2010 6
2011 12
2012 9
2013 18
2015 8
2016 5
Thailand
2010 10
2011 10
2012 8
2013 5
2014 10
2015 9
2016 9
In 2010 in the Philippines there were 4 efficient domestic building construction companies and increased to 6 efficient companies in 2011. But in 2014 to 2016 many companies are inefficient. In 2014 there was the greatest decline only 2 efficient companies. In 2010 in Indonesia there were 6 efficient domestic building construction companies and down to 4 efficient companies in 2011. In 2013 and 2014 there are 4 and 3 efficient companies. In 2010 there were 10 efficient domestic building construction companies in Malaysia. In 2011 there were 10 efficient domestic building construction companies. But until 2016 there is no efficient increase of companies compared to inefficient companies. In Singapore, in 2010 there were 6 efficient domestic building construction companies and increased to 12 efficient companies in 2011. In 2013 there are 18 efficient domestic building construction companies. In 2014 there was a decline with only 9 efficient companies. By 2015 there are 8 efficient domestic building construction companies and by 2016 there are 5 efficient domestic building construction companies. Thailand in 2010 and 2011 there are 10 efficient domestic building construction companies.
Fig. 2 Percentage efficiency of domestic building construction companies in Southeast Asia
After the DEA analysis, the researchers identified the characteristics of efficient building construction companies using EPS, DER, ALR, CCR variables. The EPS value of efficient domestic building construction companies is 0.57 and the inefficient domestic building construction company is 0.07. An efficient domestic building construction company has a DER value of 1.23, bigger than an inefficient domestic building construction company with a DER value of 1.72. The ALR value of efficient domestic building construction companies is 3.56, greater than inefficient domestic building construction companies with an ALR value of 2.11. The CCR value of an efficient domestic building construction company is 1.17 and an inefficient domestic building construction company is 0.42.
Based on the analysis by the DEA method, efficient building construction companies are less efficient than inefficient ones. Recorded for efficient domestic building construction there are 12.6% of companies and inefficient there is 87.4% in Southeast Asia. But on the data, there is an imbalance between efficient building construction companies as a minority group and inefficient as a majority group. The SMOTE (Synthetic Minority Oversampling Technique) method is one solution to overcome unbalanced data by adding (oversampling) minority groups [10]. The next step to explain the characteristics of efficient building construction companies, researchers analyzed by classical analysis method of classification tree. The use of classification trees is intended to identify the characteristics of efficient and inefficient variables. With the overall prediction accuracy of 83.79% in domestic building construction companies, these four variables can predict efficient domestic building construction companies with sensitivity 75.27% and inefficient companies with specificity 92.31%.
According to Fig. (3), an efficient domestic building construction company has two EPS variables, and one for each DER, ALR and CCR variable. An efficient domestic building construction company has four characteristics. The first characteristic of EPS is smaller than 0.15 and DER is smaller than 0.17. The second characteristic, EPS is greater than or equal to 0.15 and CCR is greater than or equal to 0.86. The third characteristic is that the EPS is greater than or equal to 0.15, the CCR is smaller than 0.86, the ALR is smaller than 2.4 and the DER is smaller than 0.91. The fourth characteristic, the EPS is greater than or equal to 0.25, the CCR is smaller than 0.86, the ALR is smaller than 2.4 and the DER is greater than or equal to 0.91.
4. Conclusion
Many domestic building construction companies in southeast Asia are inefficient than efficient companies. This is due to company inputs that are higher than company output. efficient domestic building construction there are 12.6% of companies and inefficient there is 87.4% in Southeast Asia. Efficient building construction companies are less efficient than inefficient ones.
The characteristics of efficient domestic building construction companies in Southeast Asia include:
1. Earnings before interest tax are less than 15% of revenue and debt less than 17% equity.
2. Earnings before interest tax are greater than 15% of revenues and cash is greater than 86% of current liabilities.
3. Earnings before interest tax are greater than 15% of revenues, cash is less than 86% of current liabilities, assets less than 240% debt, and debt less than 91% of equity.
4. Earnings before interest tax are greater than 25% of revenues, cash is less than 86% of current liabilities, assets less than 240% debt, and debt less than 91% of equity.
References
[1] F. Firmawan, F. Othman, and K. Yahya, “Framework for Green Construction Assessment: a Case Study of Government Institution Building Project in Jakarta, Indonesia”, Journal of Emerging Trends in Engineering and Applied Sciences, 3(4):576-580, 2012.
[2] J. L. Park, S. S. Kim, S. Y. Choi, J. H. Kim, and J. J. Kim, “Measuring Relative Efficiency of Korean
Construction Company Using DEA/Window”, International Journal of Civil, Environmental, Structural, Construction and Architectural Engineering, 5(12):691-695, 2011.
[3] C. Langston, “The Application Of Data Envelopment Analysis to The Benchmarking of Construction Performance in Australian and American High-Rise Buildings”, International Journal of Construction Management, 13(3):55-75, 2013.
[4] J. Nazarko, and E. Chodakowska, “Measuring productivity of Construction Industry in Europe with Data Envelopment Analysis”, Procedia Engineering, 122:204-212, 2015.
[5] J. L. Park, S. S. Kim, S. K. Yoo, J. H. Kim, and J. J. Kim, “Comparing The Efficiency and Productivity of Construction Firms in China, Japan and Korea Using DEA and DEA-Based Malmquist”, Journal of Asian Architecture and Building Engineering, 14(1):57-64, 2015.
[6] M. Arsyad, A. Wibowo. “Mengukur Efisiensi Kontraktor di Sektor Konstruksi Nasional Menggunakan Data Envelopment Analysis”, Jurnal Teknik Sipil, 22(2):115-126, 2015.
[7] R. Ramanathan, “An Introduction to Data Envelopment Analysis”, Sage Publications, 2003.
[8] A. Charnes, W. W. Cooper, E. Rhodes, “Measuring the Efficiency of Decision-Making Units”, European Journal of Operations Research, 2:429–44, 1978.
[9] L Breiman, JH Friedman, RA Olshen, CJ Stone, Classification and Regression Trees, New York : Chapman & Hall/CRC, 1984.
[10] V. N. Chawla, K. W. Bowyer, L. O. Hall, W. P. Kegelmeyer, “SMOTE: Synthetic Minority Over-Sampling Technique”, Journal of Artificial Intelligence Research, 16:321-357, 2002.
Author -
Ray Tamtama graduate student Statistics, Bogor Agricultural University. His main interests are in data mining and time series.
Bagus Sartono Currently worked as a lecturer in Department of Statistics, Bogor Agricultural University in Indonesia. His main interests are in data mining and experimental design.