e-ISSN: 2278-067X, p-ISSN: 2278-800X, www.ijerd.com
Volume 12, Issue 1 (January 2016), PP.01-11
Application of Geo-information Techniques in the study of Soil
Properties as Indicators of Soil Quality
Evaluation in Fragile-ecosystem
Mushtak T. Jabbar
1, Saleh I. Khassaf
2, Ammar S. Dawood
31Geology /Earth Sciences/ HCC/ Seattle,Washington,98198USA
2,3 Department of Civil Engineering, College of Engineering, University of Basrah, Basrah, Iraq
Abstract:- Recently, the need for assessing soil properties has expanded. This is because of the growing public interest in determining consequences of management practices on the quality of soil relative to sustainability of fragile-ecosystem functions in addition to plant productivity. In this study, 12 physical, chemical, and biological attributes of various soils at a different land use/cover plots in Basra Province, Iraq were determined by remote sensed (RS) imagery. Also, soil samples were positioned by GPS to quantitatively evaluate soil quality with the method of integrated soil quality index (SQI). The analytical hierarchy processes (AHP) and experts‟ knowledge were used to determine soil quality indicators and their weights.The assessment units were created by overlaying soil map with land use/cover map in GIS spatial analysis module and using Multiple Variable Indicator Transform (MVIT). The distribution map of soil quality showed that the area of first-grade quality (I), second-grade quality (II), and the third-grade quality (III) was 19.8, 23.9, and 56.3 %, respectively. The result could help to promote the production of non-harmful produces, provide scientific information for adjusting agricultural structure, and maintaining sustainable development in agriculture.
Keywords:- Remote sensed; soil quality index; land use/cover; Geo-information technology, Semi-Arid region; Iraq.
I.
INTRODUCTION
The soil is a critically important component of the earth biosphere as it functions not only in the production of food but also in the maintenance of environmental quality as related to fragile-ecosystem management and in formulating and evaluating sustainable agricultural and land use/cover policies [1-3]. In Iraq, soil quality was not discussed in the literature for nearly two decades because the primary emphasis of soil management was on controlling soil erosion and minimizing the effects of soil loss on productivity (e.g. [4]).
Influential soil properties i.e. soil quality may have significant influence on the health and productivity of an ecosystem and the related environment [5, 6]. Soil variability is not a problem, although it can be helpful in minimizing crop risk failure through design and implementation of site-specific management [7]. A significant decline in soil productive capacity has occurred worldwide through adverse changes in its physical, chemical and biological properties and contamination by inorganic and organic chemicals [8]. The rate of growth of global grain production dropped from 3% in the 1970s to 1.3% in the 2003 periods, and one of the key reasons of this decline is inadequate soil and water management [9]. The properties of soils may be determined by many attributes, whereas there is no fixed method to objectively select the parameters that affect soil quality. It is often a dilemma to decide how many and which of the measured parameters should be included in the assessment [10, 11]. A number of mathematical procedures such as AHP (Analytical Hierarchy Process), PCA (Principle Component Analysis) and LR (Linear Regression) were developed to help the screening of the parameters and determining of the weights [12-14].
The present study was carried out to assess the map quality of the soils under different land use/cover and proposed a quantitative formula for assessing soil quality and suggested that such assessments could help determine how soils responded to various management practices. Soil quality map began to be interpreted as a sensitive and dynamic way to document soil condition, response to management, or resistance to stress imposed by natural forces or human uses.The hypothesis is that soil properties build up at different land use/cover in very fragile soil is the driving force to resist a high degradation process.
II.
DESCRIPTION
AND
DATA
OF
THE
STUDY
AREA
The study region selected was Basra Province, Iraq (Fig. 1), representing a total area of 19,070 km2 between longitude 46o 60′ to 48o 60′ E and latitude 29o 13′ to 31o 29′ N. The predominant soil of Iraq is considered sedimentary, especially in central and southern parts of the country. Basra Province is situated in a desert-type environmental zone with a monsoon climate; summers are very hot, especially July and August, with a mean temperature of 37.4°C and a maximum temperature of 45°C. The average potential evapotranspiration exceeds 2450 mm/year, while average annual rainfall is less than 100 mm/year [15].
A multi-temporal Landsat (WRS2: 165/39, 166/38, 166/39 and 166/40, dated March 2003) image dataset covering the study area was assembled and analyzed for land use/cover change as part of the soil degradation indicator analysis. The spatial resolution of one pixel of the ETM image was 28.5 m by 28.5 m. A county-level topographic map, geological map, soil map, meteorological data and all thematic layers were generated in a GIS environment at a scale of 1:250 000. The software packages employed in the present study were ERDAS (image processing), Arc/GIS (analysis and presentation of results) and SPSS (statistical analysis).
Fig.1:General location of study area showing counties boundary and soil sites.
III.
METHODS
OF
THE
STUDY
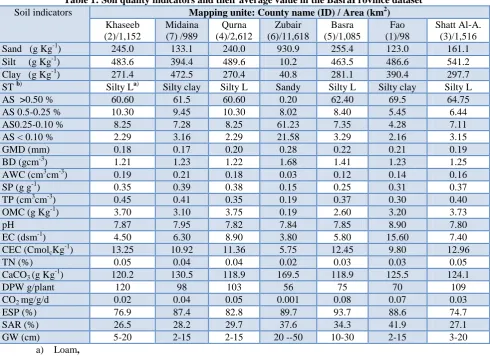
Table 1: Soil quality indicators and their average value in the BasraProvince dataset
Soil indicators Mapping unite: County name (ID) / Area (km2)
Khaseeb (2)/1,152
Midaina (7) /989
Qurna (4)/2,612
Zubair (6)/11,618
Basra (5)/1,085
Fao (1)/98
Shatt Al-A. (3)/1,516
Sand (g Kg-1) 245.0 133.1 240.0 930.9 255.4 123.0 161.1
Silt (g Kg-1) 483.6 394.4 489.6 10.2 463.5 486.6 541.2
Clay (g Kg-1) 271.4 472.5 270.4 40.8 281.1 390.4 297.7
ST b) Silty La) Silty clay Silty L Sandy Silty L Silty clay Silty L
AS >0.50 % 60.60 61.5 60.60 0.20 62.40 69.5 64.75
AS 0.5-0.25 % 10.30 9.45 10.30 8.02 8.40 5.45 6.44
AS0.25-0.10 % 8.25 7.28 8.25 61.23 7.35 4.28 7.11
AS < 0.10 % 2.29 3.16 2.29 21.58 3.29 2.16 3.15
GMD (mm) 0.18 0.17 0.20 0.28 0.22 0.21 0.19
BD (gcm-3) 1.21 1.23 1.22 1.68 1.41 1.23 1.25
AWC (cm3cm-3) 0.19 0.21 0.18 0.03 0.12 0.14 0.16
SP (g g-1) 0.35 0.39 0.38 0.15 0.25 0.31 0.37
TP (cm3cm-3) 0.45 0.41 0.35 0.19 0.37 0.30 0.40
OMC (g Kg-1) 3.70 3.10 3.75 0.19 2.60 3.20 3.73
pH 7.87 7.95 7.82 7.84 7.85 8.90 7.80
EC (dsm-1) 4.50 6.30 8.90 3.80 5.80 15.60 7.40
CEC (CmolcKg-1) 13.25 10.92 11.36 5.75 12.45 9.80 12.96
TN (%) 0.05 0.04 0.04 0.02 0.03 0.03 0.05
CaCO3 (g Kg-1) 120.2 130.5 118.9 169.5 118.9 125.5 124.1
DPW g/plant 120 98 103 56 75 70 109
CO2 mg/g/d 0.02 0.04 0.05 0.001 0.08 0.07 0.03
ESP (%) 76.9 87.4 82.8 89.7 93.7 88.6 74.7
SAR (%) 26.5 28.2 29.7 37.6 34.3 41.9 27.1
GW (cm) 5-20 2-15 2-15 20 --50 10-30 2-15 3-20
a) Loam,
b) (ST) = Soil texture, (AS) = Aggregate size (mm), (GMD) = Grain mean diameter, (BD) = Bulk density,
(AWC) = Available water capacity, (SP) = Saturation percentage, (TP) = Total porosity, (OMC) = Organic matter content, (pH) = Soil pH, (EC) = Electrical conductivity, (CEC) = Cation exchange capacity, (TN) = Total nitrogen, (CaCO3) = calcium carbonate, (CO2) = Respiration rate, (DPW) = Dry
plant weight,(ESP) = exchangeable sodium percentage,(SAR) = sodium adsorption ratio (SAR), and (GW) = Ground water.
IV.
METHODS
OF
THE
STUDY
Soil quality indicators were selected using the approach suggested by Cameron [19]. The approach is based on the equation:
, ,
, ,
M
S U M I R
(1)where A = acceptance score for indicator, S = sensitivity of indicator to degradation or remediation processes, U = ease of understanding of indicator value, M = ease and/or cost effectiveness of measurement, I = predictable influence of property on soil, plant/animal health and productivity, R = relationship to ecosystem processes (especially those reflecting wider aspects of environmental quality and sustainability). Each parameter in the equation is given a score (1 to 5) based on expert‟s knowledge and experience of it. The sum of the individual scores give the level of acceptance (A) score which can then be ranked in comparison to other potential indicators, thus aiding the selection of indicators for a site. For example, organic matter content (OMC) received the following scores (S = 5, U = 4, M = 4, I = 3, and R = 2) giving an A value of 72% i.e. (A=18/25×100 = 72%). The „A‟ is high for OMC and is selected to be one of the indicators for soil quality assessment for crop production function. The following indicators were then selected based on the above approach: bulk density (BD), soil texture (ST), available water capacity (AWC), saturation percentage (SP), total porosity (TP), organic matter content (OMC), soil pH (pH), electrical conductivity (EC), cation exchange
capacity (CEC), total nitrogen (TN), calcium carbonate (CaCO3), and dry plant weight (DPW). The contribution
V.
SOIL
QUALITY
MODEL
Assessment of soil quality was often used to solve particular problems, such as soil erosion, soil pollution and soil nutrient depletion. The soil quality evaluation data was collated into the five major land use/covers: (1) vegetation land, (2) sand land, and (3) unused land. The other classes viz (4) urban area and (5) water bodies have not been included in this analysis. The twelve soil quality indicators were examined for each land use/cover class.Table 2 shows a comparison of the sites sampled in the Basra province, grouped by land use/cover according to the south parts of Iraq land use/cover database derived from landsat ETM 2003 and the frequency of occurrence of that land use/cover in the soil quality evaluation set. There is a large bias in the soil quality data, with unused land 1.3 being greatly underrepresented and arable crops and horticulture being greatly over-represented according to the actual area extent. A bias factor 0.43 and 0.80 means the number of samples in the soil quality data corresponds well to the area extent of that land use/cover. The quality of soil function was assessed using Multiple Variable Indicator Transform (MVIT) by Smith [20]. The indicators were transformed on the basis of their ability to attain a critical level or range. Any indicator that is equal to or above the critical level for crop production is scored 1 and anyone below the critical level is giving 0. These were later integrated into percentage quality ratings (Table 2):
No. indicators that attain critical level
% Quality Rating
100
(2)
Total No. of indicators assessed
The soil quality model is to qualitatively describe the attributes of a high-quality soil, where soil quality is defined based on its capacity to perform a certain function [21]. Based on the results of modeling, we can compare effects of different practices on similar soil types or temporal trends on the same soil type, and to understand the complete value of dynamic soil quality assessment [9]. Karlen and Stott [22] suggested a simple additive model:
(3)
Q
q
1
wt
q k
wt
Where Q is the soil quality index (SQI), qk variables represent values for different soil quality attributes, and wt is the weights applied to each attribute. In order to combine all the indicator measurements with totally different measurement units, each indicator has to be normalized, often using ranges established by the soil‟s inherent capability to set the boundaries and shape of the membership functions.
Table 2: The proportion of land use/cover class in 2003 and their representation
Land use/cover class Area
(Km2)
Proportion (%)
Number of Soil sites
Proportion (%)
“bias” factor
Vegetation land 4595.9 24.1 292 56.5a) 0.43b)
Sand land 4557.7 23.9 153 29.8 0.80
Urban area 3794.9 19.9 1 0.19 No data
Unused land 3356.3 17.6 70 13.5 1.30
Water bodies 2955.9 15.5 0 0 No data
Total 19,070 100 516 100
a) Proportion (%) =292 × 100 / 516 b)
Bias factor =24.1 / 56.5
VI.
RESULTS
AND
DISCUSSION
A. Soil indicators evaluation
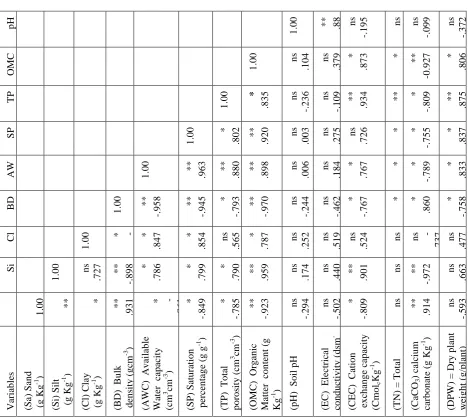
Correlation analysis with SPSS packages was made for soil properties measurements 0-30 soil depths which indicted intra and inter-relationships among the soil properties while revealing significant and non-significant correlations between the variables assayed (Tables 3). The study results provide a non-significant negative correlation (r > -0.94) between the bulk density (gcm-3) and the saturation percentage (g g-1). Another significant positive correlation (r > 0.87) was found between the organic matter content (g Kg-1) and total nitrogen (%), while the correlation between cation exchange capacity (CmolcKg-1) and calcium carbonate (g Kg
-1) was significant negative (r >-0.91); however, most of the soil properties were negatively correlated with sand
there were obstacle layers in soils of study location and need improvement. CEC and EC both took a share of 10.7% each. It is well known that CEC represents the soil‟s ability of holding nutrients and soil texture could affect the availability of some nutrients and also influences some other properties. The biological attributes, dry plant weight (DPW) and soil respiration rate (CO2), did not appear to contribute significantly toward the total variance and were among the twelve attributes of the lowest communality values. The data presented in Table 5 show the soil quality ratings for crop production function. In mapping units viz Abu Khaseeb and Shatt Al-Arab, Al Midaina, Al-Qurna, Basra, Fao, and Al Zubair counties have number indicators which met the threshold value requirement for crop production function, so they have 74.6, 66.4, 49.8, 58.1, 41.5, 34.5, and 33.2% quality ratings respectively. With these results, the soils have low to high inherent quality for crop production function. The statistical analysis showed that soil organic matter has a significant correlation with dry plant weights‟ positive change (r > 0.80). Organic matter content (OMC) is an important component of the soil because it is relevant to all biological, chemical and physical functions in the soil. Biologically, soil organic matter is the source of energy for soil microorganisms (or microbes). Microbes are the 'engine' that drives the cycling of nutrients within the soil[23]. Chemically, soil organic matter is a major reservoir of plant nutrients. It is the major source of plant nitrogen, sulphur and phosphorous, which are cycled through accumulation and decomposition of soil organic matter[22]. Other nutrients, such as calcium, magnesium, potassium and sodium, are loosely attached as positively charged cations to the negatively charged bonding sites on organic matter. Physically, soil organic matter stabilises soil structure and soil pores and therefore has a marked effect in enhancing structural stability, aeration, water storage capacity and rainfall infiltration[8].
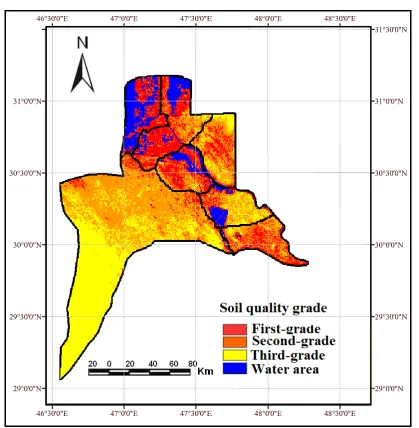
B. Distribution map of soil quality
Fig.2:Distribution map of soil quality in the Basra Province
Table 3: Matrix of correlation coefficients for soil properties in the fragile-ecosystem
DPW 1.0
0
C
aCO
3
1
.0
0 ns
-.
6
4
5
TN 1.00 ns
-.
6
6
2 **
.9
7
6
C
E
C
1
.0
0 *
.8
2 9
**
-.
9
1
3 *
.7
9
9
EC 1.00 ns
.1
4
Ns
-.0
8
1
ns
-.
3
8
4 ns
-.1
6
pH 1 .0 0 ** .8
8 2ns
-. 1 9 5 ns -. 2 8 3 ns -. 0 9 9 ns -. 3 7 2 OM C 1 .0 0 ns .1 0 4 ns .3 7 9 * .8 7 3 * .8 3 3 ** -0 .9 2 7 * .8 0 6 TP 1 .0 0 * .8 3 5 ns -. 2 3 6 ns -. 1 0 9 ** .9 3 4 ** .8 7 9 * -. 8 0 9 ** .8 7 5 SP 1 .0 0 * .8 0 2 ** .9 2 0 ns .0 0 3 ns .2 7 5 ns .7 2 6 * .8 4 0 * -. 7 5 5 * .8 3 7 AW C 1 .0 0 ** .9 6 3 ** .8 8 0 ** .8 9 8 ns .0 0 6 ns .1 8 4 * .7 6 7 * .8 1 1 * -. 7 8 9 * .8 3 3
BD 1.00
** -. 9 5 8 ** -. 9 4 5 * -. 7 9 3 ** -. 9 7 0 ns -. 2 4 4 ns -. 4 6 2 * -. 7 6 7 * -. 7 7 9 * .8 6 0 * -. 7 5 8 Cl 1 .0
0 *
-.8 5 1 * .8 4 7 * .8 5 4 ns .5 6 5 * .7 8 7 ns .2 5 2 ns .5 1 9 ns .5 2 4 ns .4 5
4 ns
-.7 3 7 ns .4 7 7 Si 1 .0 0 ns .7 2 7 ** -. 8 9 8 * .7 8 6 * .7 9 9 * .7 9 0 ** .9 5 9 ns .1 7 4 ns .4 4 0 ** .9 0 1 ns .7 2 1 ** -. 9 7 2 ns .6 6 3 Sa 1 .0 0 ** -.9 4 5 * -.8 4 7 * * .9 3
1 *
-.8 6 1 * -. 8 4 9 * -. 7 8 5 ** -. 9 2 3 ns -. 2 9 4 ns -. 5 0 2 * -. 8 0 9 ns -. 6 5 2 ** .9 1 4 ns -. 5 9 3 Var iab les (Sa) San d (g Kg -1 ) (Si) Silt (g Kg -1 ) (C l) C lay (g Kg -1 ) (B D) B u lk d en sity ( g cm -3 ) (AW C ) Av a ilab le W ater ca p ac ity (cm 3 cm -3 ) (SP ) Satu ratio n p er ce n tag e (g g -1 ) (T P) T o tal p o ro sity ( cm 3 cm -3 ) (OM C ) Or g an ic Ma tter co n ten t (g Kg -1 ) (p H) So il p H (E C ) E lectr ical co n d u ctiv ity ( d sm
-1 ) (C
E C ) C atio n ex ch an g e ca p ac ity (C m o lc Kg -1 ) (T N) = T o tal n itro g en ( %) (C aCO 3 ) ca lciu m ca rb o n ate (g Kg -1 ) (DPW ) = Dr y p lan t weig h t ( g /p lan t)
*, ** Indicated relationships significance level at p <0.05 and p<0.01; ns- non-significant and „-‟ sign denoted negatively correlated (n=101).
Table 4: Soil quality indicators and weights
Indicator Weight Contributing to soil quality Recommended by
BD (gcm-3)
0.1447 Bulk density is the weight of soil in a specified volume. Bulk density provides a measure of how loose or compacted the soil is. Loose soils may be subject to increased risk of erosion. Compaction reduces the porosity and stability of soil aggregates. The consequences may include reduced supply of air to plant roots, increased resistance to penetration that may limit root extension and germination, and reduced capacity of the soil to store water that is available to plants.
[29]
ST (gKg-1)
0.1519 Root growth, rate of water movement, soil volume
expression, retention and transport of water and nutrients
[3]
AWC (cm3cm-3) 0.0355 The preferred indicators for soil physical condition is
available water, as give an indication of the number of larger pores in soil, which are crucially important for aeration and storage of plant-available water.
[30]
TP (cm3cm-3)
0.0562 Water/air balance, water retention, root growth [32]
OM (gKg-1)
0.1795 Available water, nutrient, root growth, environmental
concern
[28]
pH 0.0311 Measure of the acidity or alkalinity of soil, is an
important indicator because acidity influences both the ability of plants to grow in soil, the availability of
nutrients, and the functioning of beneficial
organisms. Acidification is a natural soil process, but can be accelerated by cropping, excessive use of fertilizers, leaching, and application of acidic wastes.
[33]
EC (dsm-1)
0.1335 Soil chemical characteristic to be included as basic
indicator
[34]
CEC (CmolcKg -1)
0.1188 The CEC of a soil often indicates its natural fertility and its development and ability to supply Ca, Mg, and K for plant growth. It is also a measure of the ability of the soil to store added nutrients (fertilizers). Soils which have a low CEC cannot store large amounts of plant nutrients and must be replenished more regularly.
[31]
TN (%) 0.0934 Indicator of soil quality change due to Land
use/cover change
[35]
CaCO3
(gKg-1)
0.0327 Plant productivity and environmental quality
functions of SQI.
[36]
DPW g/plant 0.0061 Index for microbial biomass (i.e. biological function). [32]
(BD) = Bulk density, (ST) = Soil texture, (AWC) = Available water capacity, (SP) = Saturation percentage, (TP) = Total porosity, (OMC) = Organic matter content, (pH) = Soil pH, (EC) = Electrical conductivity, (CEC) =
Cation exchange capacity, (TN) = Total nitrogen, (CaCO3) = calcium carbonate, and (DPW) = Dry plant weight.
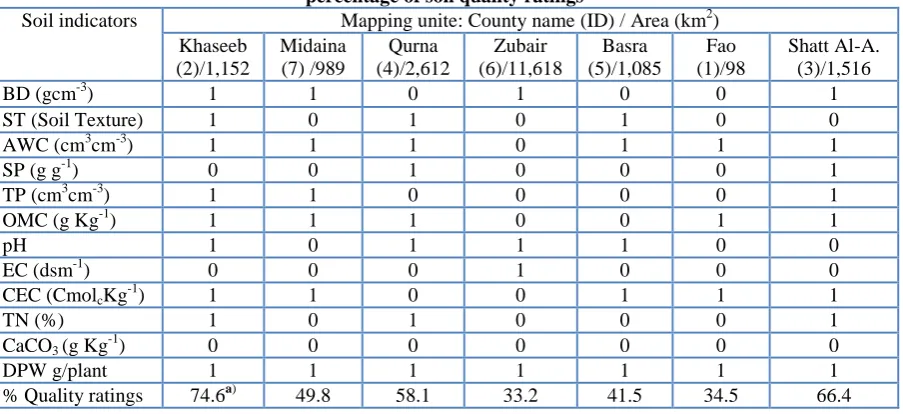
Table 5: Information used in calculating the value of parameter in Eqn 2 for percentage of soil quality ratings
Soil indicators Mapping unite: County name (ID) / Area (km2)
Khaseeb (2)/1,152
Midaina (7) /989
Qurna (4)/2,612
Zubair (6)/11,618
Basra (5)/1,085
Fao (1)/98
Shatt Al-A. (3)/1,516
BD (gcm-3) 1 1 0 1 0 0 1
ST (Soil Texture) 1 0 1 0 1 0 0
AWC (cm3cm-3) 1 1 1 0 1 1 1
SP (g g-1) 0 0 1 0 0 0 1
TP (cm3cm-3) 1 1 0 0 0 0 1
OMC (g Kg-1) 1 1 1 0 0 1 1
pH 1 0 1 1 1 0 0
EC (dsm-1) 0 0 0 1 0 0 0
CEC (CmolcKg-1) 1 1 0 0 1 1 1
TN (%) 1 0 1 0 0 0 1
CaCO3 (g Kg -1
) 0 0 0 0 0 0 0
DPW g/plant 1 1 1 1 1 1 1
% Quality ratings 74.6a) 49.8 58.1 33.2 41.5 34.5 66.4
a) High = > 65%, Medium = 35 – 65%, Low = <35% [25]
(BD) = Bulk density, (ST) = Soil texture, (AWC) = Available water capacity, (SP) = Saturation percentage, (TP) = Total porosity, (OMC) = Organic matter content, (pH) = Soil pH, (EC) = Electrical conductivity, (CEC) =
C. Soil quality evaluation
The study area was divided into three grades according to SQI values (Table 6). According to Table 6, the third-grade quality (III) accounted for nearly half of total stud area (56.3%), subsequently was second-grade quality (II), with a percentage of 23.9%, and then was the first-grade quality (I), the highest quality soil was only 19.8%, which indicated that soils in Basra Province were not capable of sustaining agriculture.As the predominant texture classes were sandy soil, silty loam, and silty clay,the soils are usually dry in all parts of the year and do not have cracks or lithic and or paralithic contact within 60 cm of the soil surface. They have a torric moisture regime and thermic characteristics. Therefore, these soils are placed in the order Entisols, suborder Orthents, and great group TypicPetroargids (PetrogypsicPetroargids) according to the USA Soil Taxonomy. Soil representatives for the different land use/cover were not having any diagnostic horizons. They have sand to medium texture, a high content of CaCo3, and the soil temperature regime being thermic. The
different values of CaCo3 content revealing the original deposits formations in these soil, which may be due to derivation from calcareous parent rocks and it was distributed in coarse sand, fine, silt and clay fractions. These soils represent the flat soil association are mineral soils, devoid of any observable signs of soil development and do not have any diagnostic horizons, therefore, these soils can be classified into order Entisols, suborder Psamments, great group Quartzipsamments and subgroup TypicQuartipsamments. Generally, the soils of Iraq are considered as sedimentary soil according to the USA Soil Taxonomy these are TypiPetroargids (PetrogypsicPetroargids) especially in the central and southern parts.
VII.
CONCLUSION
Numerous studies had been carried out in assessing soil quality aiding with various mathematical methods for sampling strategy, indicator selection, weight determination and model construction. With the advance of spatial information science, geo-information technologies provide powerful tools for data manipulation and information acquisition, which may, along with the previously stated methods, bring the research of soil quality assessment into a new era. This research, selecting south part of Iraq as study area, assessed the spatial variability of soil quality and explored the variation features of soil quality under different land use/covers and a total of 516 sites in the location have been examined to assess soil quality condition, using a set of 12 key indicators. About two-third of the sites (70%) met all soil quality targets, specific to those soils, and using these data and other ancillary spatial information in the GIS environment, it is possible to identify and map similar soil characteristics that can be used to predict potentials and constraints of land for specific crop production. Soil quality maps indicate areas with a high probability of having good soil quality according to predetermined criteria. This procedure and the resultant maps can be produced at various time intervals to monitor changes in soil quality due to management practices or treatments. Moreover, by evaluating individual indicators over time, it is possible to identify specific soil properties that are affected by management practices. The probability map produced from this study is more useful than rating soil quality on a scale of 1 to 10, and provide more flexibility to incorporate management decisions and environmental constraints into the soil quality profile. The spatial distribution pattern of soil quality matched the distribution of land use/cover. Among various land use/cover types, irrigated lands and orchards had the best quality. We concluded that the soil quality restoration in the non-vegetation sandy areas should emphasize increasing the base saturation and CEC reducing in the aluminum saturation, and increasing the soil organic matter. Greater soil physical change occur at the soil surface and are closely related to the soil organic matter content, which in turn, affects aggregate stability, pore size distribution and water flux. For the fact that soil quality was a complex process, there was need for it to be corrected by soil physical, chemical, and environmental factors to form the actual productivity of land. Further studies be carried out to determine the most important soil properties and their respective critical values for each land use/cover type that should be considered in developing minimum datasets for SQ index determination and there is need to determine the optimum sampling strategies and intensities that will give consistently good result of predicted parameters at un-sampled locations at coarser scales e.g. regional levels.
Table 6: Soil quality grades and their properties in Basra Province
Grades Area (km2) % Soil properties
quality (I) 3775.86 19.8 The first-grade quality (I) is good have few problems for
the relatively good field conditions, the soil is suitable for crop production. Risk for sustainable crop production is generally < 25% but risk can be reduced with good conservation practices.
quality (II) 4557.73 23.9 The second-grade quality (II) is moderate productive, with few
management-related constraints. This grade requires important inputs of conservation managements. In fact, no crop production must contemplate in the absence of a good conservation plain. Lack of plant nutrients is a major constraint and so a good fertilizer use plan must be adopted. Soil degradation must be continuously monitored. This class productivity is not high and so low-input farmers must receive considerable support to manage these soils or be discouraged from using them. Soil can be set aside for orchards regions. In the semi-arid areas, they can be managed for range. Risk for sustainable crop production is 25-50%.
quality (III) 10736.41 56.3 The third-grade quality (III) is belonging to very
fragile-ecosystem or is very uneconomical to use for crop production. The soil should be retained under their natural state. Some area may be used for recreational purposes but under very controlled conditions. In the third-grade quality (III), which is largely confined desert area, re-vegetation must be done very carefully with considerable attention to ecosystem damage. The third-grade quality (III) is mainly deserts where biomass production is very low. Risk for sustainable crop production is >75%
Total 19,070 100 The study area, in general, is exposed to a high risk of soil
degradation caused by salinization, wind erosion, and The continuous use of unsustainable practices, damage of the infrastructure during the War, and poor maintenance worsened by sanctions, has caused a further soil and plant deterioration.
REFERENCES
[1]. A. S. Yakovlev, V. M. Gendugov, G. P. Glazunov, M. V. Evdokimova, and E. A. Shulakova,
“Methodology for the environmental assessment of the soil state and regulation of the soil quality” Eurasian Soil Science. 42 (8), pp 916-925 (2009).
[2]. V. I. Kiryushin,” Assessment of land quality and soil fertility for planning farming systems and agrotechnologies” Eurasian Soil Science. 40 (7), pp 785-791 (2007).
[3]. D. Granatstein, and D.F. Bezdicek, “The need for a soil quality index: Local and regional perspectives” American Journal of Alternative Agriculture, 17, 12-16 (1992).
[4]. M.T. Jabbar, “Soil loss by wind erosion for three different textured soil treated with polyacrylamide and crude oil, Iraq”Journal of China University Geosciences 2:113–116 (2001).
[5]. R.D.Connolly, D.M. Freebairn,and M.J. Bell, ”Change in soil infiltration associated with leys in
south-eastern Queensland”Australian Journal of Soil Research 36, 1057-1072 (1998).
[6]. L.F.C.Leite, E.S. Mendonca,and PLOA. Machado, “Influence of organic and mineral fertilisation on organic matter fractions of a Brazilian Acrisol under maize/common bean intercrop” Australian Journal of Soil Research 45, 25–32 (2007).
[7]. Z.Wang, A.C. Chang, L. Wu, and D.Crowley, “Assessing the soil quality of long-term reclaimed wastewater-irrigated cropland”Geoderma,114, 261– 278 (2003).
[8]. M.A. Arshad, and S.Martin, “Identifying critical limits for soil quality indicators in
agro-ecosystems”Agriculture, Ecosystems and Environment 88, 153–160 (2002).
[9]. L. Douglas, C. A.Karlen, Ditzler, and S. A. Susan. “Soil quality: why and how?”Geoderma, 114,145–
156 (2003).
[10]. B.P. Warkentin, “The changing concept of soil quality” Journal of Soil Water Conservation. 50, 226–
228 (1995).
[11]. N.R. Hulugalle, and F. Scott, “A review of the changes in soil quality and profitability accomplished by
sowing rotation crops after cotton in Australian Vertosols from 1970 to 2006” Australian Journal of Soil Research 46, 569–576 (2008).
[13]. M.T. Jabbar, and C. Xiaoling, “Land degradation assessment with the aid of geo information techniques” Journal of Earth Surface Processes and Landform 31:777–784 (2006).
[14]. F. Yang, G.M. Zeng, C.Y. Du, L. Tang, J.F. Zhou, and Z.W. Li, “Spatial analyzing system for urban
land-use management based on GIS and multi-criteria assessment modeling” Progress inNatural
Science. 18(10): 1279-1284(2008)
[15]. M.T. Jabbar, and X. Zhou, “Eco-environmental change detection by using remote sensing and GIS techniques: a case study Basra province, south part of Iraq” Environment Earth Science 64:1397–1407 (2011).
[16]. M.T. Jabbar, Z. Shi, T. Wang, and C. Cai, “Vegetation change prediction with geo-information techniques in the three gorges area of China” Pedosphere16(4):457–467 (2006).
[17]. N.A. Al-Mossawi, “Spatial variance of properties of Basra soil a study of soil geography” Ph.D. Dissertation, Basra University, (2005). (in Arabic).
[18]. G. R. Black, “Bulk Density. In: Black C A, Evans D D, White J L, eds. Methods of Soil Analysis” Part
1. Agronomy. 9: 379-390 (1965).
[19]. K. Cameron, M.H. Beare, R.P. McLaren. and H. Di, “Selecting physical, chemical, and biological indicators of soil quality for degraded or polluted soils” Proceedings of 16th world congress of soil science registration No. 2516. Symposium No. 37. August 20-26, (1998). Montpelier, France.
[20]. J.L. Smith, J.J. Halvorson, and R.I. Papendick, “Multiple Variable Indicator Kriging: A procedure for
integrating soil quality indicator. In: Defining and assessing soil quality for a sustainable environment” Soil Science Society of America, Special Publication No. 35:149-156 (1994).
[21]. S. H. Schoenholtz, H. V. Miegroet, and J, A. Burger, “A review of chemical and physical properties as
indicators of forest soil quality: challenges and opportunities” Forest Ecology and Management, 138, 335-356 (2000).
[22]. D.L. Karlen, and D.E. Stott, “A framework for evaluating physical and chemical indicators of soil quality. In: Doran, J.W., Coleman, D.C., Bezdick, D.F., Stewart, B.A. (Eds.), Defining Soil Quality for a Sustainable Environment” Soil Science Society of America, Special Publication No. 35, pp. 53-72 (1994).