e-ISSN: 2278-7461, p-ISSN: 2319-6491
Volume 7, Issue 1 [January 2018] PP: 66-70
Wind Effects Statistics of Diagrid High-rise Building
Mohammad Bhuiyan
1, Roberto Leon
21Department of Math & CS, West Virginia State University, WV, USA
Corresponding Author: Mohammad Bhuiyan
Abstract: Building codes typically provides a “basic wind speed (V)” corresponding to a given Mean Recurrence Interval (MRI) as a design value based on extreme value analyses. From the wind design standpoint, the use of a single wind velocity as a design load input assumes that systematic differences in the input necessarily cause systematic differences in the response of a structure. This assumption is based mostly on the results of studies on low-rise buildings, for which the assumption seems to hold. However, for high rise buildings it may not be true that the structural response hazard level will be proportional to the wind loading hazard level. In this paper, aerodynamic pressure time series from wind tunnel test are used to run 3D time history analyses on a numerical model of a diagrid high rise building. For the thirty years recorded wind speed data, thirty full scale time history analyses are performed on the FE model. For a particular response quantity, thirty response values are obtained and fit to an extreme value distribution to obtain a design value for a particular MRI. This value represents the “response hazard” for a particular hazard level (50-yr MRI for this case). Similarly, “response hazard” values are calculated for other response quantities such as base shear, base moment, base torsion, roof acceleration, and roof displacement. Using a single design wind speed, these response quantities are calculated and compared with the “response hazard” values. The result shows that design quantities based on “design wind speed” always overestimate the response except for maximum roof acceleration. If a diagrid high rise building is designed using a “design wind speed”, it will underestimate the acceleration at roof level compared to the acceleration value calculated based on “response statistics”.
Keywords: Diagrid Building, Hazard level, High-rise, Wind
--- ---Date of Submission 20-01-2018 ---Date of acceptance: 15-02-2018 --- ---
I.
INTRODUCTION
Building codes typically provide a “basic wind speed (V)” corresponding to a 50-yr Mean Recurrence Interval (MRI) as a design value. This value implies a 64% probability that the wind speed V will be exceeded in 50 year and is based on extreme value analyses. From the wind design standpoint, the use of a single wind velocity as a design load input assumes that systematic differences in the input necessarily cause systematic differences in the response of a structure.
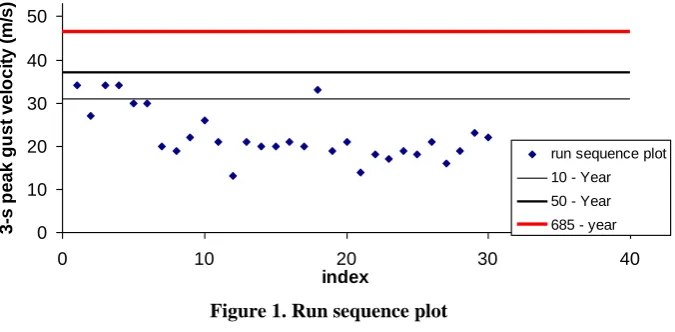
In this paper a statistical analysis of the response of a 64-story diagrid structure is carried out based on the directional maximum annual wind speed data for Sacramento, California from 1950 to 1979 collected by the National Institute of Standards and Technology (NIST). This data is summarized in Fig. 1, where reference lines at certain threshold values (e.g., 10-yr, 50-yr & 685-yr MRI wind speed) are shown. The data in Fig. 1 contains directional wind speeds at 10m above ground in open terrain, based on data reported in Simiu et al. (1979). As this is data from California, it does not contain either hurricane or tropical storms.
The statistical analyses will use data from wind tunnel test performed on a scale model of the building described in the next section. This data provides the pressure time histories to run wind analyses on a numerical model of the building. For each wind speed corresponding to a particular year from Fig. 1, a full scale 3D time history analysis (THA) is performed and response quantities (e.g. displacement and acceleration at the building roof, base shear and base overturning moment, etc.) are obtained. Thus, for the thirty 3-sec peak gust velocities shown in Fig. 1, thirty full scale time history analyses are performed. Note that because of similitude and scaling issues, the few seconds of the actual wind tunnel test data results in wind records with durations of ranging from over 3.5 to over 9 hours for the prototype structure.
For a particular response quantity (for example base shear, FX), thirty response values are obtained and fit to an extreme value distribution (a Gumbel distribution is used in this study) to obtain a design value for FX for a particular MRI (say a 685-yr MRI). Denoting this design value as FX685, this value represents the “response hazard” for a particular hazard level (685-yr MRI for this case). For comparison purposes, consider the design wind speed of 46.46 m/s calculated for a 685-yr MRI (bold red line in Fig. 1). Using this 46.46 m/s wind speed, a full scale 3D time history analysis of the building is conducted and the maximum base shear value is recorded. Let denote this design quantity as FX685 – this value represent a design response quantity for a
conclusions regarding whether designing a structure based on “loading hazard” is adequate or not. Following the same procedure, other response quantities of interest can be compared.
0 10 20 30 40 50
0 10 20 30 40
index
3
-s
p
e
a
k
g
u
s
t
v
e
lo
c
it
y
(
m
/s
)
run sequence plot
10 - Year
50 - Year 685 - year
Figure 1. Run sequence plot
II.
DESCRIPTION OF THE BUILDING AND WIND TUNNEL TEST
The initial wind data comes from a 1:600 scaled model used in a wind tunnel study for a building in a suburban terrain. This test was conducted at the CRIACIV Boundary layer wind tunnel (Ilaria, 2005). The wind is acting perpendicular to the long face of the building as shown in Fig. 2, where Cartesian axes are also defined along with the dimensions of the 64-story diagrid prototype building (Bhuiyan, 2011). Aerodynamic pressure time series were recorded at 120 pressure tap locations on the building envelope.
Figure 2. Building Dimensions and Wind Direction
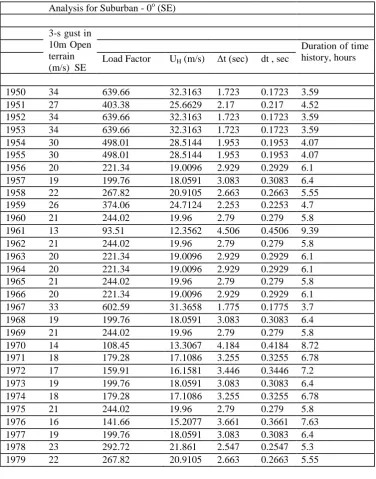
Table 1 presents the calculation summary to convert the scale model pressure time series data into a prototype force time series data to use in the numerical analysis of the model of the full scale building. The load factor in Table 1 is a multiplication factor used to convert the pressure time series into a force time series. In Table 1, UH
Table 1. Calculation Summary to convert model scale pressure time series data into prototype force time series data to use in the numerical model of the full scale building
Analysis for Suburban - 0o (SE)
3-s gust in 10m Open terrain (m/s) SE
Duration of time history, hours Load Factor UH (m/s) Δt (sec) dt , sec
1950 34 639.66 32.3163 1.723 0.1723 3.59
1951 27 403.38 25.6629 2.17 0.217 4.52
1952 34 639.66 32.3163 1.723 0.1723 3.59
1953 34 639.66 32.3163 1.723 0.1723 3.59
1954 30 498.01 28.5144 1.953 0.1953 4.07
1955 30 498.01 28.5144 1.953 0.1953 4.07
1956 20 221.34 19.0096 2.929 0.2929 6.1
1957 19 199.76 18.0591 3.083 0.3083 6.4
1958 22 267.82 20.9105 2.663 0.2663 5.55
1959 26 374.06 24.7124 2.253 0.2253 4.7
1960 21 244.02 19.96 2.79 0.279 5.8
1961 13 93.51 12.3562 4.506 0.4506 9.39
1962 21 244.02 19.96 2.79 0.279 5.8
1963 20 221.34 19.0096 2.929 0.2929 6.1
1964 20 221.34 19.0096 2.929 0.2929 6.1
1965 21 244.02 19.96 2.79 0.279 5.8
1966 20 221.34 19.0096 2.929 0.2929 6.1
1967 33 602.59 31.3658 1.775 0.1775 3.7
1968 19 199.76 18.0591 3.083 0.3083 6.4
1969 21 244.02 19.96 2.79 0.279 5.8
1970 14 108.45 13.3067 4.184 0.4184 8.72
1971 18 179.28 17.1086 3.255 0.3255 6.78
1972 17 159.91 16.1581 3.446 0.3446 7.2
1973 19 199.76 18.0591 3.083 0.3083 6.4
1974 18 179.28 17.1086 3.255 0.3255 6.78
1975 21 244.02 19.96 2.79 0.279 5.8
1976 16 141.66 15.2077 3.661 0.3661 7.63
1977 19 199.76 18.0591 3.083 0.3083 6.4
1978 23 292.72 21.861 2.547 0.2547 5.3
1979 22 267.82 20.9105 2.663 0.2663 5.55
III.
RESULTS
From each response quantity time series, expected peaks are estimated. Table 2 summarizes the results obtained for the thirty analyses. The column “FX" represents the estimated peaks from the time series for the base shear in the X-direction (FX). The other columns in Table 2 represent similarly estimated peaks.
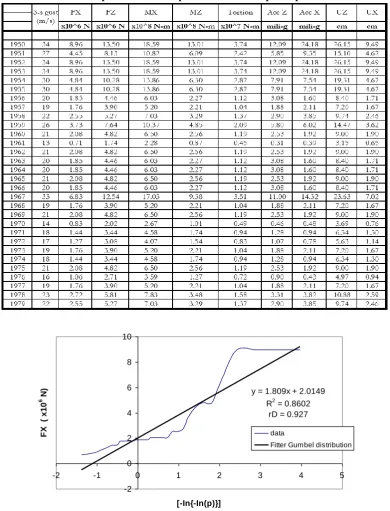
Fig. 3 shows the fitted Gumbel distribution for the yearly peaks of base shear FX (column 3 of Table 2). From the fitted Gumbel distribution, a design base shear FX of 13.8253x10⁶ N is estimated for a hazard level of 685-yr MRI. As described in the last paragraph of Section I, let’s denote this design value as FX685 – which may be called “response hazard” as it was predicted from the probability distribution of the response base shears, FX. In Section I, it was estimated that the design wind speed for a 685-yr MRI was 46.46 m/s; this yields a base shear FX equal to 20.5181x10⁶ N. Let’s denote this design quantity as FX685 – which may be called design base
shear FX for a particular wind “loading hazard” level (685-yr MRI for this case). Comparing FX685 =
13.8253x10⁶ N with FX685 =20.5181x10⁶ N, it is evident that designing a high-rise building based on design
Table 2. Expected Maximum peaks for several response quantities
y = 1.809x + 2.0149 R2 = 0.8602
rD = 0.927
-2 0 2 4 6 8 10
-2 -1 0 1 2 3 4 5
[-In{-In(p)}]
F
X
(
x
1
0
6 N
)
data
Fitter Gumbel distribution
Figure 3. Fitted Gumbel distribution to the yearly peaks of base shear FX
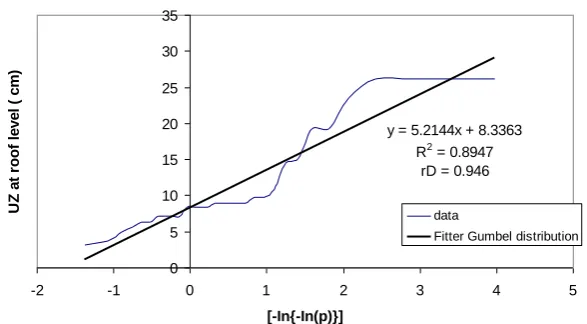
Fig. 4 shows the fitted Gumbel distribution to the displacement UZ at the roof level. From the fitted curve, an UZ50 of 28.68 cm is estimated for a hazard level corresponding to a 50-yr MRI. A design wind speed of 37 m/s was estimated from Section I for 50-yr MRI. Using this wind speed a THA is conducted and a roof displacement UZ50 of 31.6 cm is recorded. Comparing UZ50 = 28.68 cm with UZ50 =31.6 cm, it is evident that
designing a high-rise building based on design wind speed is adequate.
y = 5.2144x + 8.3363 R2 = 0.8947
rD = 0.946
0 5 10 15 20 25 30 35
-2 -1 0 1 2 3 4 5
[-In{-In(p)}]
U
Z
a
t
ro
o
f
le
v
e
l
(
c
m
)
data
Fitter Gumbel distribution
Figure 4. Fitted Gumbel distribution to the yearly peaks of roof displacement UZ
Table 3. Comparison of design quantities estimated based on “response statistics” & “design wind speed”
IV.
CONCLUSION
Thirty full scale 3D time history analyses were carried out using pressure time series data from wind tunnel test to determine the structural response-hazard level. The study showed that design quantities based on “design wind speed” always overestimate the response except for maximum roof acceleration. If a high-rise building is designed using “design wind speed”, it will give an underestimated value for acceleration at roof level compared to the acceleration value calculated based on “response statistics”.
REFERENCES
[1]. Bhuiyan, M. (2011), Response of Diagrid Tall Building to Wind and Earthquake Actions, PhD thesis, submitted to ROSE School, Pavia, Italy.
[2]. Simiu, E.; Heckert, N.; Filliben, J.; Johnson, S. (2001). Extreme wind load estimates based on the Gumbel distribution of dynamic pressure: an assessment. Structural Safety, 23, pp. 221–229.
[3]. Simiu, E.; Scanlan, R. (1996). Wind Effects on Structures, John Wiley & Sons, New York.
[4]. Venanzi, I. (2005), Analysis of the Torsional response of Wind-Excited High-rise buildings, PhD thesis, submitted to Universita Degli Studi Di Perugia, Italy.