Supervised Learning Method N Neural Network
Algorithm for the Analysis of Diabetic Mellitus
and its Comparative Analysis
J.Vijayashree1, J.Jayashree2
School of Computer Science and Engineering, VIT, Vellore.
Abstract : Diabetes is the key critical issue needs to be concerned for various problems in our body. Increase in glucose and fructose content in our body results diabetes mellitus. When a body generates higher insulin level than the required, results increased urination and excessive thirstiness which in turn results kidney failure and other cardio related issues. Many research agencies invested their funds on defining the predictive methodology and finding the root cause those results in mellitus. Mellitus results highest mortality rate compared to any other disease reported by the health organizations across the globe. In this, the predictive methodologies, various classification techniques are discussed and the results are analyzed. The classification methodology could be on medications, Food Habits, Personal behaviours, Age factors and so on. The datasets are processed and analyzed with the Neural Network algorithms and the results are compared with one another. The datasets are taken from the National Family Health Survey results published during the period of 2016-2017. The result implies that men between ages 15-49 among 1 billion people have reported with diabetes mellitus. Diagnose and forecast on this disease is done by recognizing the pattern formation and grouping the similar structures. Various algorithmic techniques like M-Layer Perceptron, Nearest Neighbour, Vector machines, Data regressions, Binary Regression and their accuracy of forecast, speed and sensitivity is calculated, analyzed and compared to define the accurate prediction methodology over a short span of time. The Forecast methodologies are focussed to provide solutions to avoid the intensive care system provided proper medications with a long duration when it is been predicted to be a risk factor. A statistical method of analyzing is performed for the comparative analysis. The learning and training methodologies are discussed in this system. Accuracy, Specificity, sensitivity is the key parameters to define the best forecast methodology. Classification on Association, Regression techniques and Neural Algorithmic techniques are analyzed and compared to refine the best predictive forecast methodology by processing 30 Samples across the states of India with focus on determining the type of mellitus along with the accuracy on definition. The forecast data utilized to define the type of mellitus and the prediction on critical measures over a period of time.
IndexTerms - Mellitus, Neural Algorithms, Mellitus Classification, M-Layer Perceptron, Regression techniques, Nearest Neighbour, Learning techniques, MATLAB.
I.INTRODUCTION
Diabetes Mellitus is a serious health issue needs to be appropriately diagnosed and treated with proper medications and regular check-up. Mellitus is caused due to the excessive insulin secretion or due to the lack of insulin needed for the body biological balance. The excessive insulin secretion is due to improper physical fitness, increased intake of starch contents, excessive carbohydrates and low secretion is due to excessive dilution, enormous medication intake, skipping the meals, less food intake than required level. The normal level of glucose for all the conditions of Non-diabetic and diabetic conditions are given in the table 1. Exceeding these level results various clinical disorders in the human body. The issue could be from normal to extreme intensive conditions. The intensive conditions could be damage of cells in kidney, nervous disorder and defective retinal aperture. The severity can be classified with three types of disorders. The level-1 disorder results improper insulin secretion and defects pancreas in generating the insulin. This type disorder is caused by the genetic system and causes damage in the nerve cells. Thenerve cell adhered back to the retina is defected by the damage in nerve cell and results blindness. Due to improper secretion of insulin level, pancreas affected which in turn affects the kidney functionality [2].
Level 2 mellitus disorder usually occurs in the teenage is due to the excessive weight, Hypertension, Fat contents and improper BMI. Combination of this level of mellitus disorder along with Hypertension results cardiac vascular disorders such as cardiac arrest and myocardial infractions. The insulin secretion at the pancreas is not sufficient for the normal body functionality. Also, the excessive weight imposes the improper secretion of insulin level. The improper secretion is by the fat muscles and liver which is formed due to the improper food intake and restless sleep. However this level of mellitus disorder can be controlled by implementing proper diet, physical fitness, Regular and timeliness food intake and sleep. There is another type of mellitus which only causes during the pregnancy is called gestational mellitus. This mellitus disorder results the inhabitant growth of the child inside the womb.
Table 1: Normal Glucose level recommended by the national clinical Institute
Target Condition Upon day Start (mmol/L)
Pre-Meal (mmol/L)
Post-Meal (mmol/L)
Non-Diabetic 4 to 5.9 <7.8
Type 2 Diabetic 4 to 7 <8.5
Type 1 Diabetic 5 to 7 4 to 7 5 to 9
<12 Years with Type 1 Diabetes 4 to 7 4 to 7 5 to 9
Gestational mellitus should be brought under the control and a high intensive care, physical fitness and precautionary medication without excessive medication intake should be followed. There is a 55-60% chance for the continuation of Gestational mellitus into level 2 mellitus disorder during the post pregnancy. In absence of intensive care on gestational mellitus increases the risk factor of unborn baby which in turn results excessive weight gain at the womb stage, breathing issue, level 2 mellitus state of mellitus once after born. The Gestational mellitus also increases the risk factor for the normal delivery of baby.
Various research works on diabetes prediction are represented with important terminologies in section II. The Neural Algorithms and training procedures are represented in section III. The section III has various algorithmic techniques which are implemented and processed with the diabetic datasets on various classifications with 14 instances as datasets.
II. LITERATURE REVIEW
In this section, various methodologies involved in the prediction of mellitus disorder using various neural algorithmic techniques are analyzed. This results in enhanced usage of various datasets for the different neural algorithmic techniques to improvise the system on accuracy, specificity and sensitivity.
Classification of datasets with 100 observations and 7 class instances like pressure level, Serum albumin, and age, type of diabetic disorders, Tri-fold thickness, cholesterol, BMI, and personal behaviour are taken into consideration. Binary Logistic regression methodology, KNN, MLP is the neural algorithmic techniques taken for the comparative analysis. The results found to be 0.809 sensitive, 0.56 specific and 0.69 accurate for Binary logistic regression methodology and 0.825 for both MLP and KNN. The results found to be more accurate in KNN compared to MLP with 72 to 81 instances and 19-28 incorrect or noise data. [3]
Naive Bayes method of forecasting methodology is analyzed with 760 samples using the PIMA Indian level II mellitus disorder datasets. Among the 760 samples, only 76 samples were used for the testing purpose and the rest is for the training the datasets. The accuracy on training the datasets and testing it found to be 89% of training accuracy and 81% of testing accuracy respectively [4].
III.PROPOSED WORK
3.1 Neural Algorithmic technique for forecasting Mellitus Disorder with Level State
Multidimensional analysis datasets has been calculated with the help of datasets provided by the National Family Health survey committee. There are about 10 attributes which are taken into consideration for the forecasting method. This forecast method is accurate to find the type of mellitus occurred with the computed data, generated from the patient with his normal blood test. Various observations on the test has been carried out and multiple datasets are generated from multiple patients. The datasets and the class instances are described in section 3.1 with the table, attributes and their values.
3.2 Input Datasets
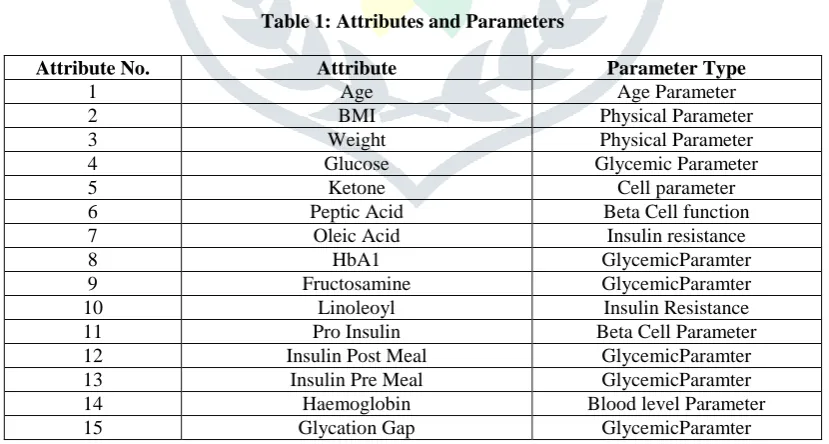
In general, Dataset instances are Age, blood group, Haemoglobin level, Glucose/insulin level, weight, BMI, Ketone level, Serum albumin, Post Meal and Pre Meal test insulin level, Blood Pressure level, HbA1, Fructosamine, Fatty Acid, Oleic Acid, Linoleoyl-GPC, Peptides, Pro insulin which are beta cells function estimations of Insulin level from the blood test analysis.
Table 1: Attributes and Parameters
Attribute No. Attribute Parameter Type
1 Age Age Parameter
2 BMI Physical Parameter
3 Weight Physical Parameter
4 Glucose Glycemic Parameter
5 Ketone Cell parameter
6 Peptic Acid Beta Cell function
7 Oleic Acid Insulin resistance
8 HbA1 GlycemicParamter
9 Fructosamine GlycemicParamter
10 Linoleoyl Insulin Resistance
11 Pro Insulin Beta Cell Parameter
12 Insulin Post Meal GlycemicParamter 13 Insulin Pre Meal GlycemicParamter
14 Haemoglobin Blood level Parameter
Table 2: Insulin level and their indication status
Value Indication Level
<3.9mmol/L Low Fasting insulin level
3.9<x<6mmol/L Normal fasting level for adults
6.1<x<6.9mmol Pre-diabetic fasting level
>7.0mmol/L Presence of Diabetic mellitus
3.9<x<7.8mmol/L Post Meal Normal level
7.9<x<10.9mmol/L Border post meal level
<3.9mmol/L Hypoglycemia initial state
2.8mmol/L Hypoglycemia fasting level
<2.8mmol/L High risk of Insulin
8<x<11mmol/L Determines early diabetic mellitus
>11mmol/L Determines generalized diabetic mellitus
The Laboratory test results of patients and the risk factors on different parameters analyzed from the blood test results
3.3 M-Layer Perceptron
The M-Layer Perceptron Neural Technique is efficient and fast computing methodology, uses feed forward network topology with minimal training datasets. In general, M-Layer Perceptron Consists of Three layers as depicted in the figure 1. The primary layer is input layer which has one or more neuron, The middle layer is Hidden layer which has n+1 neurons and the end layer is output layer which has one neuron. The mellitus datasets are taken as class instances and given as input dataset. The Hidden layer do multiple analyze on the data and form a pattern which is then grouped with similar datasets. This system of neural network algorithm is not defined with feedback signal for the error cancellation and noise reduction. The n+1 neurons in hidden layer determines the system stability and overfits under the RoC analysis. The accountability of neurons in the hidden layer cannot be performed. In this paper, concept of understanding and comparative analysis can be performed with 6 hidden neurons.
Figure1: M-Layer Perceptron Neuron Architecture
The datasets after processing with the hidden layer associated with the weight W(m,n) along with the input am can be described as
This can be represented as the function in equation
Where f defines the activation function associated with the weighted inputs. It can be simple, tangential and trigonometric function to define the best results at the output layer. To initialize the weight of neuron in the hidden layer, The weights of the neuron will be assumed to be small in numbers in which it has be multiplied with the input neuron for the processing.
The Hidden layer has multiple neurons in which one layer has the weight of any random numbers which defines the subset formation. The weight of hidden layer neurons are need not be the same and it can differ at any layer. The output layer is a combination of both the input layer and the hidden layer associated with the weights of the neuron.
Where the Pm defines the output from the previous layer which is taken as an input to the second level; Wmn defines the weight of the neurons associated in the hidden layer; Zm defines the output neuron; defines the bias function of the System.The M-Layer Perceptron results highest accuracy when compared to the any other neural algorithmic technique due to multiprocessing on the input system.
3.4 Nearest Neighbour Neural Algorithm
Nearest Neighbour Neural technique is a classification methodology requires memory for computation and classification. The algorithmic technique uses the memory to behold the data values which are computed and analysed in the series of array in which all the datasets are store and compared with each other to find the nearest neighbouring point. Once the nearest neighbour is found by the nearest possible integer, the existing memory will be updated with the new memory and again the computational iteration will be carried out. The number of iterations in this mode of prediction methodology requires huge memory space to store the buffer values. The buffer values are nothing but the values that are not nearest to the main memory value. The number of iterations, memory space and buffer values are found to be huge for this computational mechanism.
Algorithm for Nearest Neighbor:
Step1: The dataset values are computed with the nearest neighbor neural technique by means of feed forward and classification of datasets based on the similarity in pattern formation and recognition.
Step2: The output value will be stored in the main memory till the comparative analysis is been done with the next subset value. Step3: if the main memory value is lesser than the data subset value, then the main memory value will be replaced with the subset value which it means the first nearest neighboring node is found and updated.
Step4: If the value is greater, then the main memory value retains the same and the subset value is recomputed and compared. The process continuous from step 3.
Step4: if the validation of step 3 is correct then the distance between the neighbor nodes can be found by using the equation mentioned above. The node distance can be found by comparing the main memory value and data subset value.Equation to
calculate the distance of the neighbouring points and the main memory behold value is specified below.
Where defines the main memory value, defines the computed value. The iterations are performed by the limits from 1 to p which is probabilistic in nature.
3.5 Vector Machine
Vector Machine is a classification methodology used in neural algorithmic technique for pattern formation and classification. This system generalizes the datasets and forms patterns of similar and dissimilar class instances. This type of neural technique supports string and float datasets. Vector Machines is to judge the datasets and define the specificity of datasets and their associated class instances. The ideology separates the patterns and during this separation process, the vector machine collects the input data and matches the class instances with the data inputs to identify the similarity in patterns. The patterns are formed in cluster and plotted in space where the similar patterns are formed as group of cloud in the space and dissimilar patterns are observed separately from the cloud. The planes are constructed in multidimensional plot space which separates the class instances. Vector Machine can handle regression and association with classification methodology which can hold the continuous and discrete datasets with category. The category parameters are created with the dummy parameters with either positive or negative instances.
A (1, 0, 0); B (0, 1, 0) & C (0, 0, 1)
The hyper-planes are constructed with iteration which minimizes the error class instances. The error class instances are classified into groups by the vector machine
a. Vector Machine by Classification (C-CVM) b. Vector Machine by Classification-2 (µ-CVM) c. Vector Machine by Regression-1(ε-RVM) d. Vector Machine by Regression-2(µ-RVM)
a. Vector Machine by Classification(C-CVM)
In this type of classification system, the error class instances can be minimized by the equation,
Where W is the constant of the class instance capacity and C is the coefficient of Vector machine matrix. The determines the
parametric constants associated with the inputs. The iterations are performed to increase the accuracy of the prediction methodology and pattern formation and recognition. It also enhances the conversion methodology to minimize the noise signals into useful similar pattern system.
Vector Machine by Classification-2 (µ-CVM)
The system defines with the increased iteration to minimize the noise datasets.
b. Vector Machine by Regression-1(ε-RVM)
The noise signal is a function of input signals which are related and equated to the output datasets. This can be represented as
The function of the input signals by the pattern formation and identify the new conditions on this prediction methodology. The Vector machine achieved for training the system with the sample sets and the error functions.
c. Vector Machine by Regression-2(µ-RVM)
The vector machine regression system of methodology enhances the further regression system by eliminating the noise signals and increases the accuracy of the prediction methodology.
3.6Insulin levels and their indications.
The Insulin level analyzed from the algorithmic techniques indicates their status for the intensive care and generalized medication purpose. The forecast methodology founds to accurate in indicating the status of the insulin level with the post processing state.
The various disorders of Diabetic disorders are
a. Polyurea- result excessive urination
b. Polydipsea- results excessive thirst
c. Polyphagea- results excessive hunger and increased secretion of hydrochloric acid
IV.RESULTS & DISCUSSION
The datasets are taken from the blood test analysis of a person and this value has been utilized for the neural algorithmic technique for processing the data. The class instances are referred to as parameters and the patient database is taken into consideration. But for the preliminary testing a patient result has been taken into consideration along with the baseline values and the risk factor values.
Table3: Risk values and their parameters
Parameters Patient Data
High Risk Intermediate Risk
Risk Range
Intermediate Risk Range
Optimal Risk Range
Glucose 70 100 >120 90-110 60-89
HbA1 4.2 8.2 - >6 4.9-5.5 <4.5
Fructosamine 320 385 - >340 290-332 <290
Glycation Gap 0.35 - >0.7 0.30-0.45 <0.30
Post Meal Insulin Level
5.5 15 - >7.5 5.0-6.9 <5.0
Fatty Acid 0.49 0.40 - >0.5 0.4-0.7 <0.4
Oleic Acid 60 80 - >75 50-69 <50
Linoleoyl Acid 9.2 8.1 - <10 9-10.5 <8.9
Insulin 9.2 10 - >10 9-10 <9
Pro Insulin 7.2 7.9 - >12 7-14 <6.9
Peptides 3.0 - 0.7 >4.2 2.9-3.7 <2.8
The patient data is taken into the neural algorithmic process state and it is first processed with M-Layer Perceptron along with the datasets resulted by the National Family Health Survey Committee. The results are displayed in table4.
Table4: Accuracy of M-layer Perceptron
Instances Percentage (%)
Similar Instances 79 79
Dissimilar Instances 21 21
The training Accuracy of the of the system found to be 79.02% and the testing accuracy found to be 77.9% which is depicted in the figure2.
Figure2: M-Layer Perceptron Training accuracy and testing accuracy
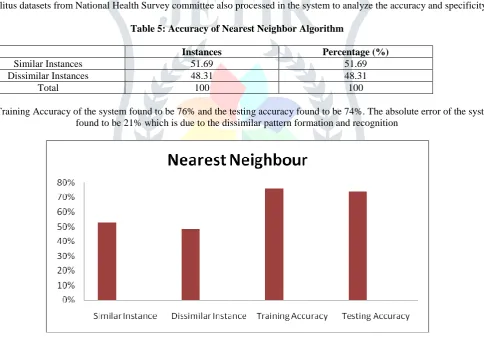
By means of nearest neighbor algorithm the class instances are obtained from the patient data obtained in real time along with the mellitus datasets from National Health Survey committee also processed in the system to analyze the accuracy and specificity.
Table 5: Accuracy of Nearest Neighbor Algorithm
Instances Percentage (%)
Similar Instances 51.69 51.69
Dissimilar Instances 48.31 48.31
Total 100 100
The Training Accuracy of the system found to be 76% and the testing accuracy found to be 74%. The absolute error of the system found to be 21% which is due to the dissimilar pattern formation and recognition
Figure3: Nearest Neighbor Training accuracy and testing accuracy
The Vector machine system of classification is also analyzed with the datasets provided in real time and also with the dataset provided from National family health survey committee. The results is given in table6.
Table6: Accuracy of Vector Machine
Instances Percentage (%)
Similar Instances 68 68
Dissimilar Instances 32 32
Total 100 100
Figure4: Vector Machine Training accuracy and testing accuracy
The datasets are iterated to the value and the accuracy, specificity, and the sensitivity are analyzed with the respect to the iteration.
Table7 defines the iteration of algorithm and their accuracy values are determined at each stage of iteration. Table 7: Accuracy of Classifiers
Algorithm K=1 K=2 K=3 K=4 K=5 K=6 K=7
M-Layer Perceptron 71.26 73.39 75.83 76.71 77.49 78.21 79
Nearest neighbor 65.54 69.98 71.63 72.29 72.63 73.79 74
Vector Machine 62.30 65.78 67.41 69.92 70.74 71.82 72
The results shows for iteration k=7, the training accuracy of are found to be equal to the theoretical analysis and the graph depicts the accuracy of system at various levels of k.
Figure 5: Comparative Analysis of Accuracy along with iterative measurement
V.CONCLUSION
In this classification methodology of supervised learning system, The M-Layer perceptron, Nearest Neighbour and Vector Machine neural algorithmic technique are analyzed with the real dataset and the dataset obtained from National Family Health survey committee. The mean factor and the distribution of datasets based on various classification conditions such as person behaviour, Mellitus disorder type and the forecast results over a period of time performed in this system. The M-Layer Perceptron results found to have accuracy compared with any other methodology due to feedback system which rectifies the deviation from the original dataset to the erroneous dataset. The accuracy of M-Layer perceptron found to be 79% and it is same in the training phase and in testing phase it is found to be 77%. By change in the value of key attributes the intensive caring period is avoided by the forecast methodology by improvising the noise cancellation and elimination of the processed datasets. The noise elimination is done by means of feedback signals which reduce the error by 0.8%.
REFERENCES
[1] https://www.diabetes.com/diabetes_care/blood-sugar-level-ranges.html [2] https://www.webmd.boots.com/diabetes/types-diabetes-mellitus
[3]Selvakumar, SenthamaraiKannan, “Prediction of Diabetes Diagnosis Using Classification Based Data Mining Techniques”, International Journal of Statistics and Systems, 2017
[4]Zahed, Ahmed Jafarian, “A New Artificial Neural networks Approach for Diagnosing Diabetes Disease Type II”, International Journal of Advanced computer Science and Applications, Vol.7, 2016
[5]Pradhan, Ranjit Kumar, “Predict the onset of diabetes disease using Artificial Neural Network”, International Journal of Computer Science & Technologies, Vol.2, 2011
[6]Rahimloo, Ahmad Jafarian, “Prediction of Diabetes by using Artificial Neural Netowork logistic Regression Statistical model and Combination of them”, Bulletin de la societe des sciences de liege, Vol.85, 2016
[8]Mukesh, Anshul and RajanVohra, “Prediction of Diabetes using Bayesian Network”, International Journal of Computer Science and Information Technology, Vol.5, 2014
[9]Kaliselvi and Durairaj, “Prediction of Diabetes using Soft computing techniques- A Survey”, International Journal of Scientific & Technology Research, Vol.4, 2015