Numerical Analysis in the Effect of Undertray
Application to Coefficient of Lift and Drag at
Formula Student Racing Car Type
Fauzun1, Arviyan Dendi Mahendra2.Mechanical and Industrial Engineering Department, Faculty of Engineering, Universitas Gadjah Mada, Jalan Grafika 2 Kompleks UGM, Yogyakarta.
Corresponding Author : [email protected]
Abstract-- Formula student racing car type is a miniature of a formula racing car that designed by many teams all across the world to compete in Formula Student Competition. Formula student car is designed so it can accomplish a race in a shortest time as much as possible. Aerodynamic is a fundamental aspect for a car to accomplish a race in a shortest time. Wind force make a great contribution to the development of speed in the car. This research is subjected to analyze the effect of undertray application to coefficient of lift and drag with numerical method. There will be several model of undertray with a variation in the angle of the diffuser at the back of undertray. Because the strong relationship between undertray and ground cleareance, the effect of ground cleareance will also be analyzed. The desired output is to find the right geometry for undertray so the car can go faster with a good handling.
Index Term— Aerodynamic, FSAE, Numerical analysis, Race car, Undertray.
I. INTRODUCTION
The automotive world is always bustling with enthusiast and constantly developing in terms of performance and standards. Advancement in the automotive industry is also driven by a variety of sports competitions such as Formula, Rally, Moto GP, Motocross, and others. Formula car racing is a competition that is currently the pinnacle of the automotive world research. There are various classes of formula cars, one of which is student formula SAE a competition designed for students from all universities across the world. The formula student competition organized by the parent organization of the automotive world is the Society of Automotive Engineers (SAE) and must comply with the regulations [1].
Aerodynamic is one the fundamental aspect to race car performance in the track. It may seem that the loads created by the motion of air is unimportant especially within the speed range encountered by automobiles but actually we can feel serious forces exerted by put our hand out of the car. History already recorded that aerodynamic contribute significantly to one lap record speed in Indianapolis Speedway Competition. One lap record speed is increased gradually from 1900 to 1960 but have a significant different in the end of 1960 because of the aerodynamic part using like rear wing, front wing, and undertray
aerodynamic investigation with computational fluid dynamic in bus model. These investigation led to some improvement in reducing coefficient of drag with modification in the back of bus model. The addition of channel at the bottom of the bus give the best reduction at 4 channel with 0,51% and the best angle for diffuser is 12 degree with 0,81% compared to model with no diffuser [3-5]. Numerical investigation had already performed too in investigating aerodynamic improvement in commercial vehicle model. It led to a significant improvement in reducing coefficient of drag and lift which contributing to fuel efficiency and better car handling. The addition of diffuser at 12 degree can reduce 22% coefficient of drag in the commercial vehicle [6-9]. The aerodynamic improvement in commercial and mass automobile is inspired by the technology that applied earlier in racing car type. S Helman et al were testing Nascar COT model with the addition of roof flaps and wings. The result is the addition of roof flaps and wing can generate downforce and make handling stability in car [10].
Ali Asgar S. et al doing a numerical investigation to outlet angle modification in undertray to generated downforce and drag force in formula style race car. It result in 14 degree outlet angle is the best angle to generate most downforce and 11 degree oulet angle is the best angle to reduce the drag force [11]. Numerical and experimental investigation had already performed in formula student racing car type too. Scoot wordley and Jeff Saunders doing a research with experimental method to test the effect of wing addition in Monash University Formula Student car. The addition of wing make significant contribution in dynamic event like skidpad, autocross and endurance. The winged car can achieve skidpad area in 4,9 second better compared to non winged car that can only finish skidpad in 5,2 sec [12]. Undertray usage already analyzed too by Karl Jensen with the variation of vehicle speed. The result state that downforce is increased gradually as the speed increased. The best downforce is 45 lbs with maximum test speed at 60 kmh [13].
This research is aimed to analyze numerically the undertray application in Universitas Gadjah Mada Formula Student car with modification in slicing angle at the back of undertray and ground clearance.
171206-3535-IJMME-IJENS © December 2017 IJENS
𝐶𝑑𝑝=
𝐹𝑝𝑟𝑒𝑠𝑠𝑢𝑟𝑒 1 2 𝜌𝑉2𝐴
Friction drag force is a force which is caused by the shear stress that appear in the surface of the model. The equation for coefficient of friction drag is :
𝐶𝑑𝑓=
𝜏 1 2 𝜌𝑉2𝐴
Coefficient of drag total is a sum of the two kind of drag force : 𝐶𝑑𝑡𝑜𝑡 = 𝐶𝑑𝑝+ 𝐶𝑑𝑓
𝐶𝑑𝑡𝑜𝑡=
𝐹𝑡𝑜𝑡
1 2 𝜌𝑉2𝐴
Lift force is a aerodynamic force which have a direction perpendicular to the direction of the airflow. The coefficient of lift equation is :
𝐶𝑙 = 1𝐹𝑙𝑖𝑓𝑡 2 𝜌𝑉2𝐴
Coefficient of pressure is a tool to quantify the magnitude of the local pressure in a point of the body :
𝐶𝑝 =𝑃 − 𝑃∞1 2 𝜌𝑉2𝐴
III. RESEARCH METHOD
Fig 1. Research method diagram.
The model that will be tested is a simplification from the bimasakti formula student car geometry.
Start
Making model geometry
Model can be meshed?
Meshing model
Qualify the desired quality?
Simulation
Qualify the convergence
criteria?
Collecting and analyzing data
Stop Yes No
Yes
No
Yes
Fig. 2. Simplificication geometry (bottom) to real geometry (top)
Slicing angle is a angle of the diffuser that located at the back of undertray and ground clearance is the length from the lowest point of the car to the ground.
Fig. 3. Diffuser degree definition at the back of undertray
Numerical analysis is performed with ANSYS Fluent software with some criteria according to reference [14-17] :
Residual convergence : 10-4
Minimum orthogonal quality : 0,25
Maximum skewness : 0,9
Beside of that meshing independency is performed to assure the accuracy of the result and a result which independent with the quality of mesh ;
Table I Meshing Independency
No Mesh Amount Cl Error Time consumption
1 2,3 million 0.831 - 3 hour
2 2,5 million 0.847 2% 3 hour 27 minute
3 2,7 million 0.854 1% 3 hour 38 minutes
4 3 million 0.860 0.7% 3 hours 54 minutes
5 3,2 million 0.8609 0.01% 4 hours 10 minutes
From the table I above it can be concluded that 3 million mesh is the most accurate and efficient number of mesh.
Fig. 4. Mesh view of the model
Properties of the velocity inlet and fluid that will be used in the simulation is adjusted with the climate in the shizuoka japan :
Velocity : 12,5 m/s
Tempereature : 23o C
Dynamic Viscosity : 0.01853724 cP
Density : 1,1691 kg/m3
Reynold number : 2,4 x 10⁶
Another boundary condition that will be used is atmospheric pressure at the pressure outlet and moving wall at the road. Velocity inlet is located at 2 times long of the model and pressure outlet is located at 5 times long of the model.
171206-3535-IJMME-IJENS © December 2017 IJENS
IV RESULT AND DISCUSSION
4.1 Slicing angle effect
The first trial is to analyze the effect of the slicing angle diffuser at the back of the undertray with a 60 mm ground cleareance.
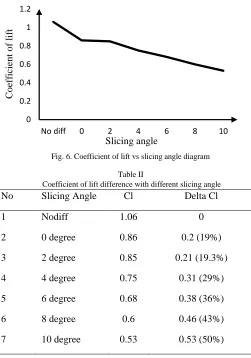
Fig. 6. Coefficient of lift vs slicing angle diagram
Table II
Coefficient of lift difference with different slicing angle
No Slicing Angle Cl Delta Cl
1 Nodiff 1.06 0
2 0 degree 0.86 0.2 (19%)
3 2 degree 0.85 0.21 (19.3%)
4 4 degree 0.75 0.31 (29%)
5 6 degree 0.68 0.38 (36%)
6 8 degree 0.6 0.46 (43%)
7 10 degree 0.53 0.53 (50%)
The magnitude of the coefficient of lift is tend to decrease linearly with the increase of the slicing angle diffuser. Undertray is proven to effectively reduce the magnitude of the coefficient of lift. The highest reduction is showed by the undertray with 10 degree diffuser angle with 50 % reduction. Also need to be considered that the application of the undertray with no diffuser already give a better coefficient of lift to the car with 19 % reduction.
Fig. 7. Coefficient of drag vs slicing angle diagram
Table II
Coefficient of drag difference with different slicing angle
No Slicing Angle Cd Delta Cd
1 Nodiff 0.63 0
2 0 degree 0.59 0.04 (6%)
3 2 degree 0.61 0.02 (3%)
4 4 degree 0.61 0.02 (3%)
5 6 degree 0.62 0.01(1,5%)
6 8 degree 0.61 0.02 (3%)
7 10 degree 0.61 0.02 (2%)
The magnitude of the coefficient of drag is tend to decrease with the increase of the slicing angle even not significant. The most reduction is showed in the model with 0 degree slicing angle with 6 % reduction. From 0 to 10 degree slicing angle the magnitude of coefficient of drag relatively constant.
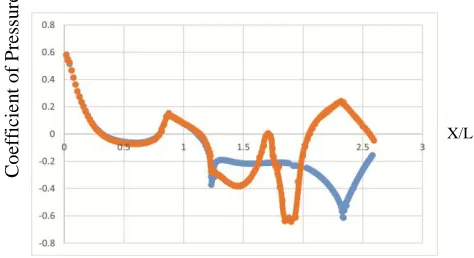
The magnitude of the coefficient of lift that drastically decrease with the increase in slicing angle diffuser can be explained with coefficient of pressure graphic.
0 0.2 0.4 0.6 0.8 1 1.2
No diff 0 2 4 6 8 10
0.57 0.58 0.59 0.6 0.61 0.62 0.63 0.64
No diff 0 2 4 6 8 10
C
o
ef
ficie
n
t o
f
li
ft
Slicing angle
Fig. 8. Coefficient of pressure diagram model 0 degree slicing angle.
Fig. 9. Coefficient of pressure diagram model 2 degree slicing angle.
Fig. 10. Coefficient of pressure diagram model with 4 degree slicing angle.
Fig. 12. Coefficient of pressure diagram model with 8 degree slicing angle.
Fig. 13. Coefficient of pressure diagram model with 10 degree slicing angle.
Fig. 14. Reference length for coefficient of pressure diagram.
C
o
ef
ficie
n
t o
f
P
ress
u
re
C
o
ef
ficie
n
t o
f
P
ress
u
re
C
o
ef
ficie
n
t o
f
P
ress
u
re
C
o
ef
ficie
n
t o
f
P
ress
u
re
C
o
ef
ficie
n
t o
f
P
ress
u
re
C
o
ef
ficie
n
t o
f
P
ress
u
re
X/L
X/L
X/L
X/L
X/L
X/L
171206-3535-IJMME-IJENS © December 2017 IJENS
The picture above show us how pressure changing at the bottom surface of the car. Orange graphic is representing the pressure in the model with no undertray and blue graphic is representing model with undertray application. The difference is located at the point 1,25 where the most front point of the undertray is located. Inconsistency is showed in the orange graphic because of its trend that increase and decrease with extreme gradient. Otherwise, the blue graphic tend to get more stabile curve after point 1,25. It tells us that diffuser at the back of undertray tend to stabilize the local pressure in the area around it and also decrease the pressure. The most lowest coefficient of pressure is situated in the first point of the diffuser. The lowest point is decrease with the increase of the slicing angle and affected the magnitude of coefficient of lift.
Fig. 15. Pressure contour at the bottom of the car with no undertray.
Fig. 16. Pressure contour at the bottom of the car with 0 degree slicing angle.
Fig. 17. Pressure contour at the bottom of the car with 2 degree slicing angle.
Fig. 18. Pressure contour at the bottom of the car with 4 degree slicing angle.
Fig. 19. Pressure contour at the bottom of the car with 6 degree slicing angle
Fig. 20. Pressure contour at the bottom of the car with 8 degree slicing angle.
Fig. 21. Pressure contour at the bottom of the car with 10 degree slicing angle.
An interesting phenomena is happening at the side of undertray which is called as “leaked” airflow. This leaked phenomena is described with the yellow area at the side of undetray in fig . It explain that the airflow at that area is slowed and the pressure increase. The leaked airflow is caused because the velocity of airflow at the side of the car is slower than the airflow at the bottom of the car. The yellow area is decrease with the increase of the slicing angle of the diffuser. This phenomena also urge to give a partition at the diffuser.
Fig. 22. Velocity contour at the back of model with no undertray in symmetry plane.
Fig. 23. Velocity contour at the back of model with 0 degree slicing angle in symmetry plane.
The first picture tell us about the velocity contour at the back of the model with 0 degree diffuser and the second is about velocity contour at the back of the model with no undertray. The decrease of the coefficient of drag is explained with the difference of the blue area at the bottom of the engine. The blue area explains us that there is a flow separation at the bottom of the car precisely at the bottom of the engine. Flow separation increase the magnitude of the pressure drag that happen on the car. This flow separation effect also explain why coefficient of drag increase with the addition of diffuser at the undertray.
Fig. 24. Velocity contour at the back of model with diffuser in the symmetry plane.
4.2 Ground cleareance effect
Ground clearance then will be investigated to see it’s impact to undertray performance. The investigation is using model with the 10 degree diffuser because it have lowest coefficient of lift among the others.
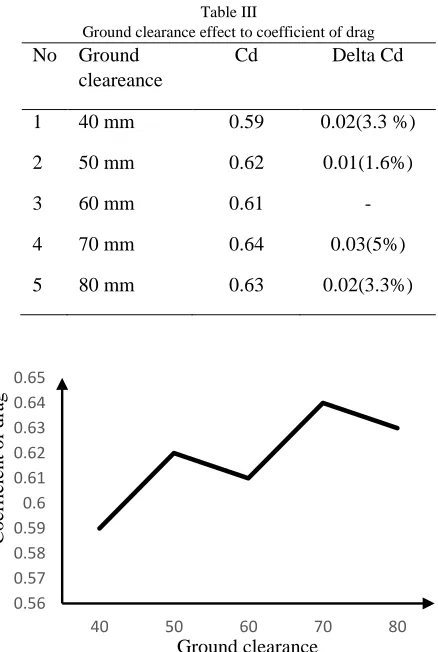
Table III
Ground clearance effect to coefficient of drag No Ground
cleareance
Cd Delta Cd
1 40 mm 0.59 0.02(3.3 %)
2 50 mm 0.62 0.01(1.6%)
3 60 mm 0.61 -
4 70 mm 0.64 0.03(5%)
5 80 mm 0.63 0.02(3.3%)
Fig. 24. Coefficient of drag vs ground clearance diagram
The magnitude of coefficient of drag tends to increase with the increase of the ground clearance. The lowest coefficient of lift is achieved with 40 mm ground clearance. The magnitude is 0.59 or less 3,3% than 60 mm ground clearance. The highest magnitude of coefficient of drag is achieved with 70 mm ground cleareance. The magnitude is more 5 % than 60 mm ground clearance. This number make sense because with the increase of ground clearance the flow separation area at the diffuser will also increase.
0.56 0.57 0.58 0.59 0.6 0.61 0.62 0.63 0.64 0.65
40 50 60 70 80
0.49 0.5 0.51 0.52 0.53 0.54 0.55 0.56 0.57 0.58
40 50 60 70 80
C
o
ef
ficie
n
t o
f
d
rag
Ground clearance
C
o
ef
ficie
n
t o
f
li
171206-3535-IJMME-IJENS © December 2017 IJENS
Table IV
Ground clearance effect to coefficient of lift No Ground
Cleareance
Cl Delta Cl
1 40 mm 0.57 0.04(7.5%)
2 50 mm 0.56 0.03(5.6%)
3 60 mm 0.53 -
4 70 mm 0.52 0.01(1.8%)
5 80 mm 0.55 0.02(3.8%)
Otherwise the magnitude of coefficient of lift have a unique trend compared to coefficient of drag. The magnitude of coefficient of lift is increased with the increase of ground clearance behind 70 mm ground clearance and increase with the increase of ground clearance forward 70 mm ground clearance. The highest magnitude of coefficient of lift is achieved at 40 mm ground clearance which 7,5% lower than 60 mm ground clearance and the lowest magnitude of coefficient of lift is achieved at 70 mm ground clearance which 1,8% lower than 60 mm ground clearance.
This trend can be explained with velocity contour at the back of the vehicle :
Fig. 26. Velocity contour at the back of model with 40 mm ground clearance in symmetry plane.
Fig. 26. Velocity contour at the back of model with 50 mm ground clearance in symmetry plane.
Fig. 26. Velocity contour at the back of model with 60 mm ground clearance in symmetry plane.
Fig. 26. Velocity contour at the back of model with 70 mm ground clearance in symmetry plane.
Fig. 26. Velocity contour at the back of model with 80 mm ground clearance in symmetry plane.
The magnitude of the coefficient of lift of the car increase with the increase of the area with a high velocity at the back of the car. With the increase of the area with a high velocity there will be also an increase of the area with low pressure at the bottom of the car.
We can conclude that the magnitude of the coefficient of lift is decreased with the increase of the ground clearance before 70 mm. That is caused by the more speed airflow can achieve at the back of the car. The increase of the velocity is caused by the less skin friction between undertray and ground which tend to slow the airflow. After 70 mm point ground clearance the coefficient of lift tend to increase with the increase of the ground clearance because the effect of skin friction start to disappear and surface area increase which tend to slow the airflow become dominant.
V. CONCLUSION
From the other result that other researcher achieve the diffuser modification at formula student car geometry give more significant impact at lowering coefficient of drag and lift. We can conclude some point from the explanation above :
The coefficient of lift value is decreased drastically with the increase in slicing angle.
The coefficient of drag value is decreased slightly with undertray application.
The most reduction value is 6% at 0 degree diffuser compared to no undertray application.
The trend of the magnitude of the coefficient of drag tends to increase with the addition of the ground clearance.
The trend of the magnitude of the coefficient of lift is decreased with the increase of the ground clearance before 70 mm and increase after that.
VI. REFERENCES
[1] SAE International. (2016) 2017-18 Formula SAE Rules. [Online]. Available: http://students.sae.org/cds/formulaseries/rules/
[2] Joseph Katz, “Race Car Aerodynamics Designing for Speed”, Bentley Publishers, 2nd Edition, 1995.
[3] Eyan Amen Mohamed, Muhammad Naem Radhwi, A. F. A. Gawad, “Computational investigation of aerodynamic characteristics and drag reduction of a bus model”, American Journal of Aerospace Engineering, Vol 2, pp. 64-73, 2014.
[4] Sabdono Abdi Sucipto, Wawan Aries Widodo, “Numerical Study of Multiple Channel Diffusers on the Rear Bus Body”, American Institute of Physics Conference Proceeding 1788, 2017.
[5] Mutiara Nuril Karohmah, Wawan Aries Widodo, “Numerical Study of flow characteristic on the rear bus body with angle variation”, Enginering journal pomits Vol 1, pp. 1-5, 2012.
[6] Akhsay Parab, Ammar Sakarwala, Bhusab Paste, Vaibhav Pathil, “Aerodynamic Analysis of a Car Model Using Fluent-ANSYS 14.5”, International Journal of Recent Technologies in Mechanical and Electrical Engineering, Vol 1, pp. 7-13, 2014.
[7] S.O. Kang, S. O. Jun, H.I. Park, K.S. Song, “Actively Translating Rear Diffuser Device for The Aerodynamic Drag Reduction of a Passangger Car”, International Journal of Automotive Technology Vol 13, pp. 583-592, 2012.
[8] S.M Rakkibul Hassan, Toukir Islam, Mohammad Ali, Md. Quamrul Islam, ‘Numerical Study on Aerodynamic Drag Reduction of Racing Car”, International Conference on Mechanical Engineering Proceeding, pp. 308-313, 2014.
[9] Asif Ahmed A, Murtaza M.A, “CFD Analysis of Diffuser in a Car for Downforce Generation”, International Journal of Research in Engineering and Technology, Vol 5, pp. 158-164, 2016.
[10] S. Hellman, M. Uddin, P.T. Tkaccik, S. D. Kelly, “Experimental Study Comparing Racecar Aerodynamic, Downforce-Generating Devices Using Scale Model Nascar COT”, International Journal of Automotive Technology, Vol 17, pp. 281-288, 2016.
[11] Ali Asghar, S. Khokhar, Suhas S. Shirolkar, “Design and Analysis of Undertray Diffuser for a Formula Style RaceCar”, International Journal of Research in Engineering and Technology, Vol 4, pp. 202-210, 2015.
[12] Scott Wordley, Jeff Saunders, “Aerodynamic for Formula SAE: Initial Design and Performance prediction”, SAE International, Paper number 2006-01-0806.
[13] Karl Jensen, “Aerodynamic Undertray Design for Formula SAE”, Thesis, Oregon State University, 2010.
[14] ANSYS. (2013) ANSYS Fluent Meshing User’s Guide. [Online]. Available: Ansys.com