Monte Carlo Analysis of the Human Vertebra
Based on Compressive Loading
A. Zulkifli, and A.K. Ariffin
Abstract— The objective of this study is to determine the
probability of injury of human crack vertebra condition subjected to compressive loading. The model had been used in this study was reconstructed from image processing and develop using SolidWorks software. The three dimensional finite element model of lumbar vertebra was organized using Ansys software. In this work, all the model components were meshed using the tetrahedral solid element (SOLID186). In order to simplify it, all the components were modeled as an isotropic, elastic material and symmetry model. The model failure was occurred when the stress intensity factor (SIF) of the bone exceeds the fracture toughness. Biological structures as well as vertebrae inherent a lot of related uncertainties and should not be solved by deterministic analysis. A Monte Carlo Simulation (MCS) technique was performed to conduct the probabilistic analysis using a built-in parametric design language (APDL) module. The results discovered that the highest stress was found on adjacent pedicle to create the weakness area and probability of failure for cracked structure condition is 2%. Therefore, pedicle was become the most crucial area to be emphasize. In addition, any flaws exist on the model such as crack will give a huge impact to the results, especially fracture. Hence, the current study was very useful to examine how the bone toughness and bone characteristics capable of sustained compressive loading in terms of probabilistic approach.
Index Term— Monte Carlo, Finite element model, Lumbar spine, Monte Carlo, Crack
I. INTRODUCTION
Biological structure such as a vertebra has many aspects of biomechanics and orthopedics parameters which variable in nature. These uncertainties are usually described by randomness, fuzziness, and intervals [1]. Normal bones in humans and animals are known to exist small cracks in vivo [2], [3]. Due to this discrepancy, chances of bone failure and fracture are higher. Obviously, the prediction of crack shape is based on the SIF solution [4]. The uncertainties of fracture response parameters are including the crack geometry, loading distribution, material properties and clinical outcomes [5]. Any uncertainty in these parameters is then accounted for by a safety factor. Conversely, this approach may be unacceptable for structures due to the maximum potential of the structure is not realized, and reliability of the structure is
This work was supported in part by the Universiti Malaysia Pahang under Grant RDU100373.
A. Zulkifli is with the Centre of Sport Engineering, Faculty of Mechanical Engineering, Universiti Malaysia Pahang, 26600, Pekan, Pahang, Malaysia.
(phone: +609-4246286; fax: +609-4246222; e-mail: [email protected]). A.K. Ariffin was a Deputy Dean of Undergraduate and Alumni in Faculty
of Engineering and Built Environment, Universiti Kebangsaan Malaysia, 46300, UKM Bangi, Selangor, Malaysia. He is now with the Department of
Mechanics and Materials (e-mail: [email protected]).
never quantified [6]. Moreover, significant uncertainty in the response of the system due to the inherent variability of the parameters and the degree of uncertainty increases as more parameters are considered [7].
In the finite-element analysis (FEA), the stresses of the structure are determined using fixed values for the fracture response parameters that control the behaviour of the structure [7]. This deterministic analysis was developed and validated to neglect the existence uncertainty in the systems. However, a purely deterministic approach provides an incomplete picture of the reality [8]. Therefore, probabilistic analysis was proposed to account for the uncertainty of fracture response parameters. This probabilistic approach can be also considered an extension of previous deterministic studies [9], [10].
The most common and traditional probability method is Monte Carlo simulation (MCS). Probabilistic analysis allows the effects of uncertainty in the parameters to be included explicitly in the analysis and the resulting statistical variation in the system response. Probabilistic analysis considers the potential interaction effects between parameters by perturbing multiple input parameters in each trial [5]. The analysis is modeled accurately, the effect of structure integrity can be observed in actual behavior [11]. Each random variable is sampled underlying its distribution and probability of failure is determined by repeating the deterministic analysis.
The ideal of surface crack geometry in bone is approximately semi-ellipse [12]. However, some element constraint such as irregular cracks, vertebra, and material properties need to modify the following crack shape [4]. Obviously, the prediction of crack shape is based on the stress intensity factor (SIF) [11].
The aims of the present study were to determine the probability of failure based on SIF of crack shape of a vertebra under compressive loading. Sensitivity analysis becomes a significant tool to determine which crucial parameters relative to failure condition.
II. METHODOLOGY
A. Finite element model
The finite element model was created using with 20-nodes tetrahedral elements (SOLID186). This element is a higher order 3D type that exhibit quadratic displacement behavior and well suit to modeling irregular meshes.
that have been used in this study were summarized in Table 1.
TABLEI
MATERIAL PROPERTIES
Description Parameters Mean COVa Distribution
Young Modulus YOUNG 12GPa 0.21 Lognormal Poisson ratio PSSNRAT 0.3 ±0.017 Uniform
Body force FORBDY 414 N 0.1 Normal Facet force FORFCT 46 N 0.1 Normal Body area AREBDY 1298 mm2 0.1 Lognormal Facet area AREFCT 166 mm2 0.1 Lognormal
Crack radius R 3.0 mm 0.1 Normal
Fracture K 1.46 MPa.m2 0.19 Lognormal
acoefficient of variation
The vertebrae are comprised by six components. There are vertebral body, spinous process, transverse process, lamina, pedicle, and facet joints.The boundary condition of vertebra anatomy was shown in Figure 1 while the unilateral crack was developed on the left pedicle. Pressure force of loading was subjected to the superior at the vertebral body whereas fixed in the inferior side.
Superposition principle was employed to estimate the SIF, in order to avoid modeling cracks on the model. This technique required the crack develop before attached together with the original vertebrae. The area of the critical region is refined using finer meshes so that the reliable results are necessarily produced especially in the vertebra body.
Consider a mixed mode problem for this case, uncertain mechanical and geometric characteristics for cracked structure that is subject to random loads. Let random variables, X that affected from other parameters are given by
, , , , c
X R EW K (1)
where R is crack radius, E is the Young modulus, υ is Poisson ratio, W total body weight and Kc is fracture toughness for this model.
B. Fracture toughness
For simple boundary value problems with idealized crack geometry, the SIF or fracture toughness may be expressed as
K f R (2)
where f is the correction factor, σ is applied stress and R is the crack radius. Alternatively, fracture toughness can be derived in terms of the strain energy release rate, G, defined as the change in potential energy per unit increase in crack area. For linear elastic release rate (LEFM), the relationship
between strain energy and SIF were close. It can be expressed in terms of the mode I, II, and III as follows:
2 2 2
' ' 2
I II III
K K K
G
E E
(3)
where µ is the shear modulus, υ is Poisson ratio and E’ is defined as follows:
2
' (Young Modulus) in plane stress
' /(1 ) in plane strain
E E
E E
(4)
The crack was dividing by three type modes of loading condition. Mode I is represented the crack opening, mode II is crack sliding and mode III is tearing. Typically, SIF is given by the subscript such as KI, KII, or KIII. In order to make SIF significant to the real condition, three modes of loading must be considered. However, this complex shape model limits the evaluation. Hence, the assessments only refer to the most significant fracture on the structure which is mode I.
Further modification of this superposition technique was required to obtained the effective SIF method defined in Eq. (5)
2
2 2
1 III
eff I II
K
K K K
(5)
where Keff is the combination between three modes of crack
loading on the model.
C. Monte Carlo Analysis
Uncertainties of parameters were determined which affected to the stress intensity factor. Denote by X and n
number of total samples with components X1,X2,…,Xn
characterizing the load, crack geometry and material properties. By formulating a performance function g(X), which is a function of random variables and typically defined as
( ) ( ) ( )
g X R X S X (6)
Fig. 1. Boundary condition of vertebra Pressure Force, P
Transverse Process Spinous Process Vertebral
body Lamina
Pedicle Facet joints
where R(X) is the limiting strength of material or resistance and S(X) is applied stress. The probability of failure, Pf is
given by
( ( ) 0)
f
P P g X (7)
It is the likelihood that the stress exceeds the strength, whereas the reliability of the structure is the converse Ps= 1
– Pf. Nevertheless, probability of failure may be expressed
as
/
f f T
P N N (8)
where Nf is the number of the sample will be fail divide by
the total number of samples, NT.
Fig. 2. Algorithm of the automatic probability of failure
The probabilistic algorithm in Figure 2 demonstrates the steps have been used to develop programming code using the built-in modules in ANSYS. The most commonly applied probabilistic model is the Monte Carlo method which involves randomly generating values for each variable according to its distribution and then predicting the distribution of performance through repeated trials [9]. This method is computational expensive as the accuracy due to dependent on the number of samples. For this study, number of samples, n equal to 100 after considering the irregular surface, number of elements, and size of crack.
Latin hypercube sampling (LHS) was used to generate the parameters according to its distribution type. It also requires fewer sampling point and more accurate rather than direct Monte Carlo sampling technique (DMCS). Besides it, LHS will decrease time consuming for analyze the data since the number of samples decrease.
D. Sensitivity Analysis
In designing the sensitivity parameter, output response parameter was needed to determine first. Requirements of that parameter due to the model failure are based on strength and fracture toughness of the vertebra. So, therefore, the most sensitive parameter was a measure from small changes the input parameters gives huge effect to the output parameter. This determines from gradient correlation of the scatter plot. Commonly, Spearmann and Pearson rank correlation is the most popular used in study the monotonic relationship.
Relative sensitivities are commonly referred to as probabilistic sensitivity factors, α and the change in safety
index, β with respect to the standard normal variate, u. The probabilistic sensitivity factor was defined as
i
i i
p
u u p
(9)
where p equal to a specific probability level.
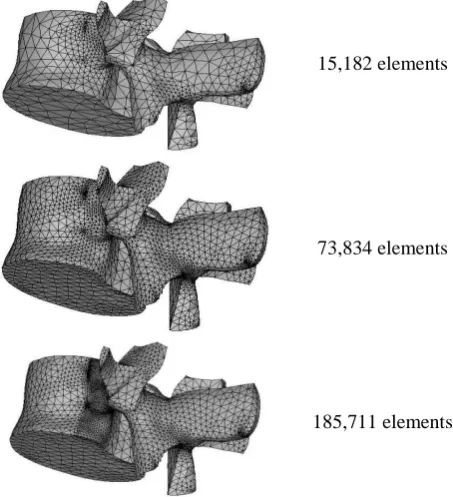
15,182 elements
73,834 elements
185,711 elements
Fig. 3. Different mesh density on pedicle
The optimum number of elements for this model was evaluating by using the element sensitivity analysis. Fig. 3 illustrates the contours of maximum stress for each different mesh density and the stress has focused on the pedicle with increasing mesh density. The sensitivity element for meshing is very important in ensuring a more accurate analysis result. However, the mesh density should not exceed the appropriate elements to allow faster analysis. Optimum number of elements acquired through graph in Fig. 4.
Fig. 4. Element sensitivity analysis
Fig. 4 shows that the graph of stress versus the number of elements in percent (%). Stress refers to the proportion of stress distribution between the minimum and maximum values of the model. Stress with a value of 100% is represents the number of elements to achieve an optimum elements. Therefore, a number of optimum elements to meshing this vertebra exhibit by dashed line arrow which is 185,711 elements with stress 2.2 MPa. This appoint element was taken due to the graph depicted no changes occurred Determine the fracture response parameters, X
Solve stress analysis and SIF using FEA
Arrange the deterministic information
i = 1
Probabilistic of failure, Pf = Nf/ NT
Generate the parameters randomly, n
in = i + 1
i < n
despite increase the number of elements. This phenomenon proves that the density of the mesh is in optimum condition.
III. RESULTS &DISCUSSION
The maximum stress in Figure 5 was appeared at the left superior at the pedicle with 4.5 MPa Von mises stress. It is due to the crack exist, and moment effect occurred on the same area. The critical fracture area is commonly on the crack tip due to stress fracture. According to the [16], the maximum stress is located in the inferior part of the pedicle and facet surface. In the same results by [17] pointed out that the pedicle work as pivot to performed the bending moment. It is convinced that the pedicle is the most critical region in vertebra structure. The value of 4.5 MPa is greater than the yield stress which is obtained from [18]. It is due to the vertebra components were assumed as same material which is cortical. The failure or fracture on bone started to exist at the highest stress concentration area in this stage [19]. However, yield assessment did not account for the plastic deformation in crack tip, and SIF will take place the failure evaluation of analysis.
Crack tip stresses can be observed in Fig. 5(a) that proves the presence of crack will increased the risk of model to be failure while the Fig. 5(b) is a half model of crack structure. Research by [20] reported that the crack driving force acting at the crack tip causing it to grow and propagate and lead to failure. This condition occurs due to the crack tip plastic zone of generation of the elastic stress distribution resulting yield stress. Therefore, the failure evaluation of this model is not applicable for the yield approach. The stress results in the plastic zone will be determined using the by the value of SIF assessment. Since the thickness of the bone is bigger than the size of the plastic zone, plane strain approach was performed on the model.
Fig. 5. Von Mises stress on crack tip
Fig. 6. SIF value for different number of contour
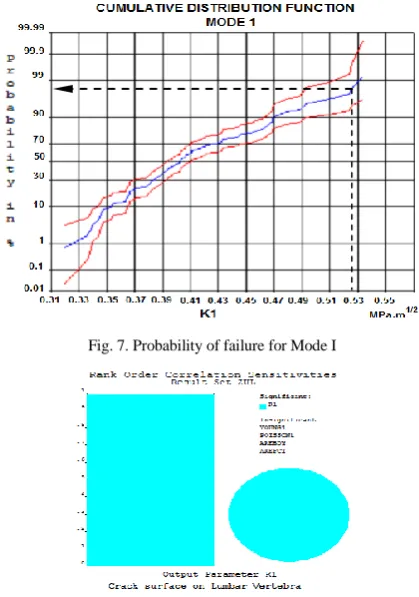
Based on the five contours evaluation around the crack tip, the average of SIF was plotted in Fig. 6. The deterministic analysis of SIF evaluation indicates that the crack tip occurred stress fracture. Mode I become the greatest crack loading since the shape and loading conditions are representing to the crack opening. The SIF effective value is 0.525 MPa.m1/2 while the fracture toughness is 1.46 MPa.m1/2. Despite, it shows that the value still not exceeded the critical fracture toughness and assumed the structure is not failed. Nevertheless, the uncertainties are affected the vertebra structure in random variables. The probabilistic analysis was performed to determine the probability of failure based on deterministic analysis. Therefore, Figure 7 illustrated the probability of failure of crack mode I based on the maximum SIF.
The probability for maximum value of SIF is representing by projected line from 0.525 MPa.m1/2 reflects to the 98% of probability in percent. The graph shows that the value greater than the 0.525 MPa.m1/2 is referring 1-0.98=0.02. It is meant the probability of failure for this model is 2%. From this result, conclude that the uncertainties inherent the biological structure is to affect the vertebra failure. However, all parameters related to the uncertainty still cannot determine by this figure. Therefore, Figure 8 indicates the sensitivity parameter analysis based on Spearman correlation value.
Fig. 7. Probability of failure for Mode I
Fig. 8. Sensitivity parameter analysis
The sensitivity parameter can be determined by using Spearman correlation with monotonic relationship. From figure 5, the most significant parameter for the fracture toughness evaluation is crack size. Besides it, that parameter is almost equivalent to one. It symbolizes that only crack size sensitive and significant than the vertebra failure rather than others. Therefore, the crack parameter needs to be emphasized to control the vertebra failure conditions. The insignificant or unimportant random variables have (a)
eliminated from the sensitivity chart to improving the computational efficiency.
IV. CONCLUSION
Finite element analysis was performed to measure the SIF for vertebra structure in the unilateral crack. This study objective is achieved to determine the probability of failure of a vertebra under compressive loading. The uncertainties are reflected the structure to be fail depends on the three basic parameters in material properties, loading and geometry. In deterministic, the SIF is indicated that the structure is not failed while in probabilistic analysis shows in contrast. Effect of uncertainties in biological structure is significant into representing the real-life phenomena. About 2% probability of failure obtained from probabilistic analysis with respect to the SIF 0.525 MPa.m1/2. Crack size becomes the most significant parameter affect the failure evaluation on sensitivity analysis. Therefore, emphasizing of this parameter is too crucial in order to avoid the system failure. For the future research, the model will be considered the bilateral pedicle fracture with different size of crack. The material properties for different segment in vertebra and ligaments need to be assigned well.
ACKNOWLEDGMENT
This research was funded by the Universiti Malaysia Pahang under grant number RDU100373. The authors wish to thank all members in Sport & Human Engineering Group for their helps until this research was completed.
REFERENCES
[1] W. Gao, Song, C., and Tin-Loi, F., Probabilistic interval analysis for structures with uncertainty.Structural Safety, Vol. 32, n. 3, pp. 191-199, 2010.
[2] J.G. Hazenberg, Taylor, D., and Clive Lee, T., Mechanisms of short crack growth at constant stress in bone.Biomaterials, Vol. 27, n. 9, pp. 2114-2122, 2006.
[3] D. Taylor, Modelling of fatigue crack growth at the microstructural level.Computational Materials Science, Vol. 25, n. 1, pp. 228-236, 2002.
[4] H. Wu, Zhong, Z., Benseddiq, N., and Imad, A., Numerical simulation of the crack shape for the thermo-mechanical loaded valve.Engineering Failure Analysis, Vol. 18, n. 6, pp. 1487-1495, 2011.
[5] C.K. Fitzpatrick, Baldwin, M.A., Rullkoetter, P.J., and Laz, P.J., Combined probabilistic and principal component analysis approach for multivariate sensitivity evaluation and application to implanted patellofemoral mechanics. Journal of Biomechanics, Vol. 44, n. 1, pp. 13-21, 2011.
[6] D.S. Riha, Millwater, H.R., and Thacker, B.H., Probabilistic structural analysis using a general purpose finite element program.Finite Elements in Analysis and Design, Vol. 11, n. 3, pp. 201-211, 1992.
[7] C. Dopico-González, New, A.M., and Browne, M., Probabilistic analysis of an uncemented total hip replacement. Medical Engineering & Physics, Vol. 31, n. 4, pp. 470-476, 2009. [8] M. Pendola, Mohamed, A., Lemaire, M., and Hornet, P.,
Combination of finite element and reliability methods in nonlinear fracture mechanics. Reliability Engineering & System Safety, Vol. 70, n. 1, pp. 15-27, 2000.
[9] S.K. Easley, Pal, S., Tomaszewski, P.R., Petrella, A.J., Rullkoetter, P.J., and Laz, P.J., Finite element-based probabilistic analysis tool for orthopaedic applications. Computer Methods and Programs in Biomedicine, Vol. 85, n. 1, pp. 32-40, 2007. [10] J. Stolk, Verdonschot, N., Murphy, B.P., Prendergast, P.J., and
Huiskes, R., Finite element simulation of anisotropic damage accumulation and creep in acrylic bone cement. Engineering Fracture Mechanics, Vol. 71, n. 4-6, pp. 513-528, 2004. [11] S. Rahman and Rao, B.N., Probabilistic fracture mechanics by
Galerkin meshless methods – part II : reliability analysis. Computational Mechanics Vol. 28, n. 1, pp. 365-374, 2002.
[12] O. Akkus and Rimnac, C.M., Cortical bone tissue resists fatigue fracture by deceleration and arrest of microcrack growth.Journal of Biomechanics, Vol. 34, n. 1, pp. 757-764, 2001.
[13] T.X. Qiu, Tan, K.W., Lee, V.-S., and Teo, E.-C., Investigation of thoracolumbar T12-L1 burst fracture mechanism using finite element method.Medical Engineering & Physics, Vol. 28, n. 7, pp. 656-664, 2006.
[14] H. Yang, Ma, X., and Guo, T., Some factors that affect the comparison between isotropic and orthotropic inhomogeneous finite element material models of femur.Medical Engineering & Physics, Vol. 32, n. 6, pp. 553-560, 2010.
[15] L. Peng, Bai, J., Zeng, X., and Zhou, Y., Comparison of isotropic and orthotropic material property assignments on femoral finite element models under two loading conditions. Medical Engineering & Physics, Vol. 28 n. 1, pp. 227-233, 2006. [16] M. El-Rich, Arnoux, P.-J., Wagnac, E., Brunet, C., and Aubin,
C.-E., Finite element investigation of the loading rate effect on the spinal load-sharing changes under impact conditions.Journal of Biomechanics, Vol. 42, n. 9, pp. 1252-1262, 2009.
[17] A. Zulkifli, Ariffin, A.K., and Rahman, M.M., Probabilistic Finite Element Analysis of Vertebrae of the Lumbar Spine under hyperextension loading.International Journal of Automotive and Mechanical Engineering, Vol. 3, n. 1, pp. 256-264, 2011. [18] A.A. White and Panjabi, M.M., Clinical Biomechanics of the
Spine. Second ed. 1990: Lippincott Williams & Wilkins. 722. [19] A. Zulkifli, Ariffin, A.K., Ismail, A.E., Daud, R., and Akramin,
M.R.M., Stress and probabilistic study of the lumbar vertebra under compression loading.Applied Mechanics and Materials, Vol. 52-54, n. 1, pp. 1394-1399, 2011.