e-ISSN: 2278-067X, p-ISSN: 2278-800X, www.ijerd.com
Volume 12, Issue 1 (January 2016), PP.47-55
Numerical Coupled Electro-Thermo-Mechanical Simulation
Of the Processing Of High Alloy TRIP-Steel by
Field Assisted Sintering
Th. Halle
1, S. Decker
2, L. Krüger
2, St. Grützner
2, S. Hütter
1, I. Kadashevich
11Otto-von-Guericke University Magdeburg, Faculty of Materials Science and Joining Technology,
Grosse Steinernetischstrasse 6, 39104 Magdeburg.
2TU Bergakademie Freiberg, Faculty of Materials Science and Materials Technology,
Gustav-Zeuner-Strasse 5, 09599 Freiberg
Abstract:- In this study, a fully coupled simulation of the field assisted sintering process of a high alloy corrosion resistant TRIP-steel was performed. Special attention was paid to the prediction of temperature distribution, evaluation of density and stress distribution within the die during the short time sintering process. Furthermore, upscaling effects are addressed.
Keywords:- FAST, SPS, FEM, coupled simulation, upscaling, material model.
I.
INTRODUCTION
High alloy corrosion resistant transformation induced plasticity steels (TRIP) receive increasing attention due to their interesting combination of mechanical properties such as high strain hardening, high strength combined with high ductility and fracture toughness. Those materials can be processed by casting and possess rather large grain sizes [1,2]. If sintering technologies are applied, dependent on the initial particle size and the processing history, fine grained structures can be achieved. Therefore, the yield behaviour can be influenced by the grain size [3,4]. Field assisted sintering technology (FAST) also known as spark plasma sintering (SPS) or pulsed electric sintering (PECS) is a novel sintering technology which offers the processing of dense materials in a short time process. Therefore, FAST is regarded to be useful to process fine grained materials with excellent combination of flow stresses and damage tolerance. However, due to the inhomogeneity of the temperature during the processing, an inhomogeneous distribution of material properties such as density, strength, and deformability is expected. Furthermore, those differences increase with the dimensions of the sintered samples, known as upscaling effects. There are some studies [5-14] which address FAST process simulations, as well as descriptions using full systems of constitutive equations [10]. Less is known about fully coupled FE simulation including effects of changing densities during the FAST process of high alloy steels and experimental evaluation. Hence, the aim of this study was to develop and perform a fully coupled simulation to predict the development of local temperature and density of a high alloy TRIP-steel processed by FAST, and to evaluate upscaling effects. Different FE solvers like Abaqus [7,11,15], FlexPDE [6], Comsol Multiphysics [12], Ansys [11] or custom made have been used before, mainly for static thermo-electrical analysis without consideration of density changes during the sintering process [6,11].
In this investigation the Finite Element Method (FEM) software DEFORMTM version 11.0 is used. It allows to perform calculations for complex problems as a fully coupled electro-thermo-mechanical job with material compacting by using a sequential splitting in fully coupled separate tasks, e.g. thermo-mechanical and electric-heating. Numerical simulations of the whole FAST process have been performed for a predefined set of shapes to investigate upscaling effects. The distribution of the compacting powder density, temperature in the sample, as well as other process parameters is evaluated.
II.
METHODS
AND
MATERIALS
Field assisted sintering technique (FAST)
shown in Fig. 1a); the corresponding 2D axial symmetrical simulation setup is shown in Fig.1 b). During the sintering process, the temperature was measured in the punch by an axial pyrometer. Independent of the sample size, the powder was initially compacted to approximately 40 % density. Afterwards the sintering process was started to pass through the following stages, shown in Table I and Fig. 2:
Fig.1:a) experimental Setup; b) simulation task with axial symmetry: materials and boundary conditions. 1-die; 2-punch; 3-adapter (in simulation 2&3 are combined in one object); 4-graphite foil;
5-graphite felt; 6-sinter material (powder); 7- electrode/piston.
Boundary conditions: mechanical: 9-loading force and voltage applied, 8-bottom fixed and grounded, friction: b-f; electrical: a-g; thermal: heat radiation b,f.
The sintering starts with the phase I: compacting without heating - electrical current is switched off, the loading stress of 60 MPa is increased linearly up to the maximum value and is held constant until the end of phase IV. During phase II, the temperature is increased unregulated up to the intermediate value of 450 °C. Here it should be mentioned that the pyrometers in the experimental setup are not capable of measuring temperatures below 450 °C. Afterwards the current is controlled by the actual measured temperature. Subsequently the steel powder was heated up with ~100 K/min to 1100 °C in phase III. Afterwards, a dwell time of 20 minutes followed in in phase IV at maximum temperature and load. Finally, the sintered body was cooled down to 450 °C applying a cooling rate of ~100 K/min in phase V combined with linear force controlled unloading The phase VI consists of the uncontrolled cooling down to room temperature.
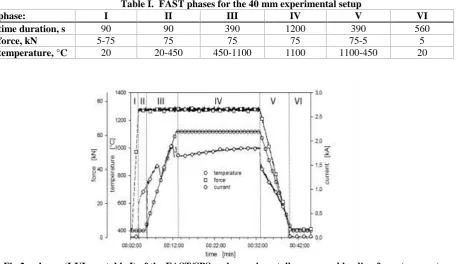
Table I. FAST phases for the 40 mm experimental setup
phase: I II III IV V VI
time duration, s 90 90 390 1200 390 560
force, kN 5-75 75 75 75 75-5 5
temperature, °C 20 20-450 450-1100 1100 1100-450 20
A typical force-temperature-current-regime versus time during sintering of a sample with 40 mm diameter is given in Fig. 2. The current and temperature drop visible in the transition between phases II and III is caused by the experimental setup, when the temperature controlled heating after 450 °C is enabled. Sintering is carried out in vacuum.
III.
MATERIAL
PROPERTIES
As mentioned before, the punches and die of the experimental apparatus are made out of graphite (Mersen: Graphite 2333), whose material properties are given by the manufacturer [16] and additionally are presented in Table II. No high temperature fracture stresses are given. The fully compacted TRIP-steel was tested by differential scanning calorimetry (DSC), laser flash testing and dilatometry to derive thermo-physical material properties like temperature dependent heat capacity, thermal expansion, thermal conductivity and density. The results are shown in Fig.3.
Fig.3: measured thermal physical properties of TRIP steel sintered at 1050 °C
To determine the critical flow stress of the sample at different temperatures during sintering, additional samples were heated up with 100 K/min to 800 °C, 950 °C and 1050 °C respectively, while applying a constant pressure of 60 MPa, and subsequently cooled very fast by switching off the power supply. Samples with 6 mm diameter and 6 mm height were machined for compression tests. Compression tests were carried out using a servo-hydraulic GLEEBLE HDS-V40 at a strain rate of 0.01 s-1 at the same temperature as the maximum sintering temperature of the particular sample. Out of these measurements a simplified flow-stress material model for the fully compacted material was derived, see Fig. 4. All material parameters are always defined for 100 % compacted bulk materials. To consider the reduced flow stresses and changed thermo-physical properties at lower densifications a very simple linear approach given by equation (1) was used:
σ = σref ρrel , (1)
where ρrel is the current relative density and σref is the reference critical flow stress at ρrel=1. This means that
for a relative density of 0.8, all material parameters are scaled to 80 % of the defined value.
The electrical resistivity was derived from the experimental data of measured current and voltage during the SPS process. Hence, these values describe the electrical resistivity of the complete setup. The resulting curve fit is shown in Figure 4b) and in Table II.
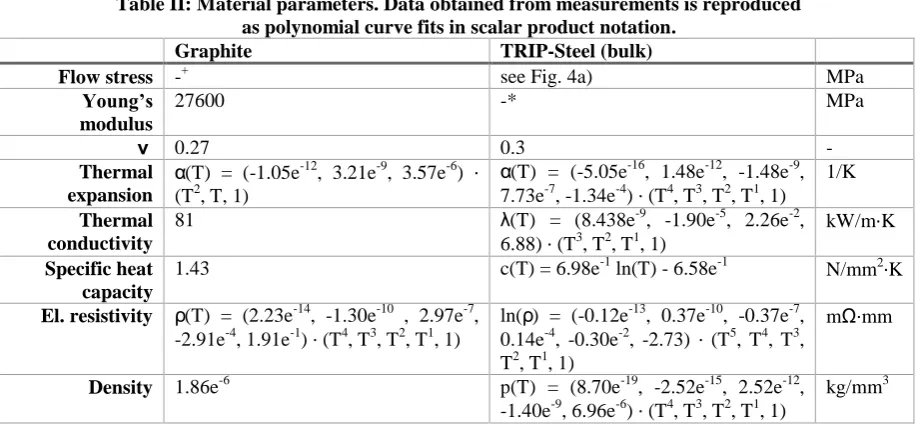
Table II: Material parameters. Data obtained from measurements is reproduced as polynomial curve fits in scalar product notation.
Graphite TRIP-Steel (bulk)
Flow stress -+ see Fig. 4a) MPa
Young’s modulus
27600 -* MPa
ν 0.27 0.3 -
Thermal expansion
α(T) = (-1.05e-12, 3.21e-9, 3.57e-6) ∙
(T2, T, 1)
α(T) = (-5.05e-16, 1.48e-12, -1.48e-9, 7.73e-7, -1.34e-4) ∙ (T4, T3, T2, T1, 1)
1/K
Thermal conductivity
81 λ(T) = (8.438e-9, -1.90e-5, 2.26e-2, 6.88) ∙ (T3, T2, T1, 1)
kW/m∙K
Specific heat capacity
1.43 c(T) = 6.98e-1 ln(T) - 6.58e-1 N/mm2∙K
El. resistivity ρ(T) = (2.23e-14, -1.30e-10 , 2.97e-7, -2.91e-4, 1.91e-1) ∙ (T4, T3, T2, T1, 1)
ln(ρ) = (-0.12e-13, 0.37e-10, -0.37e-7,
0.14e-4, -0.30e-2, -2.73) ∙ (T5, T4, T3, T2, T1, 1)
mΩ∙mm
Density 1.86e-6 p(T) = (8.70e-19, -2.52e-15, 2.52e-12,
-1.40e-9, 6.96e-6) ∙ (T4, T3, T2, T1, 1)
kg/mm3
* considered as pure plastic material in simulation +considered as pure elastic material in simulation
IV.
FE
SIMULATION
SETUP
The used Lagrangian-based FE software allows the use of coupled compaction, thermo-mechanic and electrical models, running on alternating time steps and updating the resulting material behaviour. The full system of equations for SPS can be found in the manuscripts [8,10]. The typical setup for FAST/SPS assembly has axial symmetry. Thus, the FE problem can be simulated as an axially symmetric 2D task. The geometry for the FAST/SPS assembly is created as a parametric model to enable easy changes to the tool shape and dimensions, allowing the prediction of process parameters for an upscaled sample size in the second part of this work while retaining the process definition. Numerical simulation couples mechanical, thermo-electrical and heat transfer sub-problems: during each time step the powder is mechanically compacted by the applied force, heated due to its resistance by the applied current, and the heat is also propagated through the dies, punches and sinter material. The groups of appropriate boundary conditions are mentioned in Figure 1b) and its description. Contrary to the experimental setup, in the numerical simulation the apparatus stands on the bottom punch and is loaded with the force (see Table I) on the top punch only, which was necessary to avoid numerical instabilities during force controlled loading. The electrical voltage is applied to the upper electrode; the bottom is grounded. The graphite foils (Fig.1a)-4) are omitted in the simulation setup and treated as boundary conditions for numerical calculations like it was implemented by Vanmeensel [11] for FE Abaqus software. The modelling and simulation are focusing on the calculation of heat distribution in the compacting material and solid parts of the setup, as well as on density of compacting powder.
Fig.5: FE simulation process schematic
updated to the new relative density. After this, a check is run to determine whether remeshing due to element distortion or critical strain will be necessary. As the next step, the electrical/electromagnetic model is executed to compute electric potentials, current flow and the amount of heat energy added due to resistive heating. The thermal model then handles heat propagation and phase changes in the simulated material. After writing the results to a file, the next time step is computed, starting again with the mechanical model.
Die and punches are numerically considered as elastic bodies; compacting powder (TRIP steel) is considered as a full plastic material with initial porosity of 63 %. The initial FE model is discretised with about 6500 quad elements, of which 4000 form the two punches, 1000 form the die and 1500 (equals an element size of ~0.4 mm) are used for the sample. The simulation is subdivided into approximately 40,000 time steps for each sub-model (mechanical, thermal, electrical, densification). During the simulation, the sample was remeshed multiple times to compensate for element distortion due to large deformations occurring during compaction. This was performed automatically when a critical per-element deformation of 25 % was reached, as well as after a fixed number of 20 time steps. Boundary conditions are defined to allow heat propagation, electrical resistance heating, and friction between the moving parts as mentioned in [12,13]. Total simulation time for typical FAST process was 3-4 hours. Due to limitations in the used FE Software some simplifications had to be done. For example, the dependence of electrical resistance is allowed only on the temperature or on the density. Hence, a simplification is required. As soon as the main heat production occurs near the contact region, and in this region the maximum density is reached soon after beginning of the process, the density is treated as constant and the electrical resistance is modeled as only dependent on temperature. The current is also simplified in the simulation as an effective DC current, due to the FE time step size being much larger than the pulsed current frequency in experiments.
V.
SIMULATION
RESULTS
AND
DISCUSSION
Validation of the FE simulation is done by comparison between experimental and calculated punch motion and temperature data over time for the die with 40 mm inner diameter, which is represented in the Figures 6a) (punch motion) and 6b) (temperature). A good agreement is clearly visible, demonstrating the capability of the proposed simplified model to describe the complete macroscopic sintering process.
Fig.6: experimental (squares) vs. simulation results (circles): a) punch motion, b) temperature
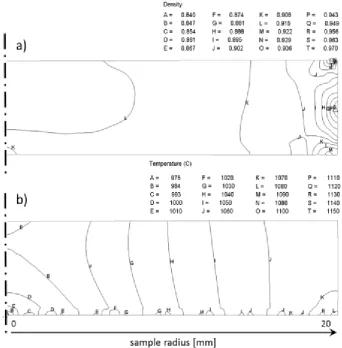
Distribution of the temperature and density in the sample with 40 mm diameter at the end of the phase IV is shown in the Figures 7a) and b) as isotherms and is density lines.
Fig.7: Density a) and Temperature b) contour plots at the end of phase IV of the simulated sintering process for samples with 40 mm diameter
In the second part of this work the attention is paid to the prediction of density and temperature distribution during sintering of samples of upscaled size. The experimental setup is assuming simple geometrical scaling of the process parameters. The tool geometry was adjusted to represent the second laboratory device (the die wall thickness is 10 mm and the inner diameter is 80 mm), the loading force was increased compared to Table II in such a way that the pressure exerted on the powder was the same. Current profiles were adjusted to fit the temperature profile as given by Table II. The material parameters are the same as mention above.
Fig.8: Density a) and Temperature b) contour plots at the end of phase IV of the simulated sintering process for samples with 80 mm diameter
A compaction profile of the scaled sample obtained along the horizontal middle line starting from the centre and going out towards the radius is shown in Fig. 9 in comparison with the same profile for 40 mm samples. The coordinate is shown as a normalised fractional position between the centre of the sample and the outer radius. For both samples, the maximum density is reached in the centre and a comparable decrease in density occurs at the outside of the profile. A difference in compaction is found with the 80 mm diameter sample showing a higher compaction, which may be explained by the higher force. The maximum difference in density is around 1 %, a density above 90 % is reached everywhere except near the outer radius. It has to be mentioned that the experimental observed densities (97 % in 40 mm, 98% in 80 mm samples) are underestimated by the simulation due to the simplified compacting model. The deviation is approximately 5 %.
Fig.9: computed local temperature in the middle of the samples at beginning and end of the dwelling phase; density at the end of controlled cooling
creating a limited heat reservoir in the die and punches. As the die mass is smaller compared to the punches, the punches can conduct more heat away from the sample at the beginning of phase V. Examination of the die temperature support this argument, as it can be seen that the die temperature quickly reaches a uniform distribution, while there is a gradient in the temperature of the punches. It should be mentioned that in the preheating phase the temperatures in the middle of the compacting powder are higher than near the die, during the sintering phase the point of maximum temperature moves to the outer surface of the compacting body. This means that as long as not all elements are in thermal equilibrium, a temperature gradient similar to that found by Räthel et al. [6] is present in the current simulation.
During the FAST experiments some of the dies fractured. Hence, die stresses were examined. Figure 10 shows concentrations of maximum principal stresses as expected in the middle of the die, where the compacting body is affecting the internal surface of the die. Investigations on the high-temperature strength of similar carbon die material [17] show that the fracture strength between 800 °C and 1200 °C is significantly reduced. This can explain why some dies broke during the experiments at lower stresses than expected. Due to the higher forces, stresses in the die with 80 mm diameter are considerably larger than within the dies with 40 mm inner diameter (Fig. 10). Therefore, it is expected that die damage due to stress fracturing is more likely for larger samples than for smaller ones. The simulation uses simplifications in the boundary conditions. Also simulation of the carbon felt and foils was left out for simplicity. To investigate this issue, a simulation including heat transfer to the environment as well as the carbon felt and foils that have been omitted here may be helpful.
Fig.10: predicted maximal principal stresses in the
a) 40 mm (maximum 18.5 MPa) and b) 80 mm (maximum 86.1 MPa) die setup
VI.
CONCLUSIONS
The proposed simulation shows good qualitative and quantitative agreement with experimental results. At the same time, the simulation has significant limitations due to two-dimensional calculation. Modest boundary conditions and a simplified compacting model are possible sources of the small deviations in the compacting behaviour, although indirectly these effects are included via the interpolation of experimental flow curves. Also, temperature/density dependence is included in a reduced form. To be able to fully describe the FAST/SPS not only on the macroscopic level, a more sophisticated model is needed.
Nevertheless, a good correlation was found between experimental and simulated temperatures and densifications. The range of the densification is slightly (in range of 5 %) underestimated in simulation compared to experimental results. The upscaled simulation predicts slightly less homogenous temperature and local densities as in setup of 40 mm die. The upscaled die is more likely to fracture due to increased stresses. The simulated temperature profile at the beginning of the sintering phase (phase IV) demonstrates a temperature concentration in the middle of the sample, afterwards migrating to the outside during phase IV. This can be explained due to the different assumptions in heat flow boundary conditions compared to the used simulation setup in [6].
ACKNOWLEDGMENT
The authors thank the Wi Web Bundeswehr research institute for Materials, Fuels and Lubricants for the financial support of this research.
REFERENCES
[1]. L. Krüger, S. Wolf, S. Martin, A. Jahn, A. Weiß, P.R. Scheller: Strain rate dependent flow stress and energy absorption behavior of cast CrMnNi TRIP/TWIP steels. Steel Research International, 82 (2011), Nr. 9, S. 1087-1093.
[2]. S. Martin, S. Wolf, S. Decker, L. Krüger, U. Martin: Deformation Bands in High-Alloy Austenitic 16Cr6Mn6Ni TRIP Steel: Phase Transformation and its Consequences on Strain Hardening at Room Temperature. Steel Research International, (2015) DOI: 10.1002/srin.201500005
[3]. Decker, S., Martin, S., Krüger, L.: Influence of Powder Particle Size on the Compaction Behavior and Mechanical Properties of a High Alloy Austenitic CrMnNi TRIP Steel during Spark Plasma Sintering. Metallurgical and Materials Transactions A, 47 (2016), pp. 170-177
[4]. Decker, S., Lange, K., Krüger, L., Dubberstein, T.: Influence of the Sulfur Content on the Sintering Behavior and the Mechanical Properties of a CrMnNi-TWIP-Steel. Steel Research International, 86 (2015), 5, pp. 544–549.
[5]. O. Guillon, J. Langer, D.V. Quach, J.R. Groza, A direct comparison between FAST and SPS based on the sintering of oxide ceramics, International Journal of Applied Ceramic Technology, 2011, Vol. 8 [6], pp. 1459-1467
[6]. J. Räthel, M. Herrmann, W. Beckert, Temperature distribution for electrically conductive and non-conductive materials during Field Assisted Sintering (FAST), Journal of the European Ceramic Society, 2009, Vol. 29, pp. 1419-1425
[7]. D. Tiwari, B. Basu, K. Biswas, Simulation of thermal and electric field evolution during spark plasma sintering, Ceramics International, 2009, Vol. 35, pp. 699-708
[8]. U. Anselmi-Tamburini, S. Gennari, J.E. Garay, Z.A. Munir, Fundamental investigations on the spark plasma sintering/synthesis process II. Modeling of current and temperature distributions, Materials Science and Engineering A 394, 2005, pp.139-148
[9]. J.E. Alaniz, J.R. Morales, J.E. Garay, The current activated pressure assisted densification technique for producing nanocrystalline materials, JOM, 2010, Vol. 62, pp. 58-62
[10]. Wang Yucheng, Fu Zhengyi, Study of temperature field in spark plasma sintering, Materials Science and Engineering B, 2002, Vol. 90, pp. 34-37
[11]. K. Vanmeensel, A. Laptev, J. Hennicke, J. Vleugels, O. Van der Biest, Modelling of the temperature distribution during field assisted sintering, Acta Materialia, 2005, Vol. 53, pp. 4379-4388
[12]. Cao Wang, Laifei Cheng, Zhe Zhao, FEM analysis of the temperature and stress distribution in spark plasma sintering: Modelling and experimental validation, Computational Materials Science, 2010, Vol. 49, pp. 351-362
[13]. Takashi Murakami, Jiahu Ouyang, Kazunori Umeda, Shinya Sasaki, Yuya Yoneyama, High-Temperature Friction and Wear Properties of X-BaSO4 (X: Al2O3, NiAl) Composites Prepared by
Spark Plasma Sintering, 2005, Materials Transactions, Vol. 46, pp. 182-185
[14]. A. Pavia, C. Laurent, A. Weibel, A. Peigney, G. Chevallier, C. Estournes, Hardness and friction behavior of bulk CoAl2O4 and Co–Al2O3 composite layers formed during Spark Plasma Sintering of
CoAl2O4 powders, Ceramics International, 2012, Vol. 38, pp. 5209-5217
[15]. Antonios Zavaliangos, Jing Zhang, Martin Krammer, Joanna R. Groza, Temperature evolution during field activated sintering, Materials Science and Engineering A, vol.379, pp.218-228, 2004
[16]. Mersen: Specialty Graphite Materials for Sintering, Datasheet,
https://www.mersen.com/uploads/tx_mersen/15-speciality-graphite-materials-for-sintering-Mersen_10.pdf (accessed 2016-01-17)