Analysis Mechanical Behavior of Hydrodynamic
Gear Pump using Taghuchi and Response Surface
Method
C. Raghunathan* and C. Manoharan
* King College of Technology, Nallur, Namakkal – 637 020, Tamil Nadu, India King College of Technology, Nallur, Namakkal – 637 020, Tamil Nadu, India
Abstract--
This analysis study is focused on the numerous
aspects of tribological development exploitation sort of experiments approach, results unit analyzed and compared to evaluate the gear performance. although heap of study work had been administered on the hydraulics gear below static plenty, till date no one deem the parameter say quantitative relation of load deflection, critical damping and conjointly the uniform pressure distribution at various crank angle below dynamic load conditions and its effects on inertia forces of gear pump. It covers bowed load, journal speed, face breadth and mass rate with connectedness variations in oil film thickness. Frictional check rig was accustomed live the resistance force associated oil film thickness at various crank Associate in Nursinggles for every three minutes at an interval of every fifteen degree crank angle. The response surface methodology (RSM) analysis shows appreciable can increase in respect of performances in mass rate, face width, speed and loading against the Taguchi sort of experiment results whereas the film thickness is form of same in every RSM and Taguchi sort of experiment results. Specific attention is given throughout this analysis sweat to search out but the variation in gear dimensions influences the characteristics of the hydraulics gear pump.
Index Term-- Hydraulics Gear Pump, Oil Film Thickness, Mathematical Modeling, Taghuchi and RSM, Eddy Current Cap Device
INTRODUCTION
A few researches has been disbursed in dynamic analysis of medication pumping this work problems external gear pumps for automotive applications, that operate at high speed and depression and presents a sensitivity analysis concerning the influence of favor and operational parameters on the pump dynamic behavior (Mucchi, 2007). The mathematical modeling was developed for eccentricity of shaft and pump, with the aim of beside all the vital effects, also on get a rather straightforward mode (Ravikumar et al., 2014). The model has been taken in to account for comparison with experimental vibration information, throughout an enormous selection of operational parameters conditions for many profile errors (Jae-seobkwak, 2005). This concept is targeting the dynamic analysis on the influence of the foremost vogue and operational parameters on the pump dynamic behavior. Specific, the results of clearance within the hydraulic gear between tooth tip and pump case, and in addition the results of the operational parameters like stiffness,
estimation is disbursed setting the sporadically variable pressure and meshing forces of the model to a relentless worth up to their mean values. Then the „stationary‟ axis positions (also referred to as orbit centroid) are computed as a result of the resolution of a non-linear system of mathematical equations obtained from the force balance of every gear. Materials and methods (Dalpiaz et al., 2006).
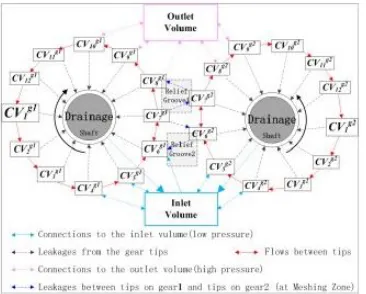
Pump Description
The pump body has been built in cast iron and material of the gear is steel. The tooth number of gear 1 is the same as that of gear 2. The Control Volumes (CVs) within the tooth gaps are variables dependent on the gear angle (Mucchi, 2007). The subscript is the index of these Control Volumes. The Outlet and Inlet volumes are two fixed volumes at the outlet and inlet ports respectively. To produce a flow within a gear pump, fluid is carried by the CVs from the intake side of the pump to the discharge side of the pump through the transition zone. As the gears rotate, these CVs increase their pressure to when reach the high-pressure chamber (Dalpiaz, 2006). As the gear teeth mesh in the meshing zone, flu-id is squeezed out of each tooth gap by the mating tooth. When two tooth pairs contact, a trapped volume is generated. This may cause positive pressure peaks and the onset of cavitations. On the intake side, the gear teeth are coming out of the mesh (Ravikumar and Mohamad Abdul Hafeez, 2014). The volumes of CVs increase so that fluid is inhaled into the tooth gaps. This process repeats itself for each revolution of the pump and
therefore displaces fluid at a rate proportional to the pump speed.
Major Contribution
In this section, we first give an overview of the pump model. Some components come from a free library HyLibLight based on Modelica (Mucchi, 2007). The aim of this paper is to construct a hybrid model of the external gear pumps. It considers the leakages, compressibility of the oil, flow ripple, pressure distribution, etc. Specifically, the pump is modeled under the following assumptions:
1. The gears and the housing case are rigid; only the oil is compressible
2. The position of the shaft is known before the simulation and is fixed during the simulation. 3. The pressure at every single isolated region and
fixed volume is well-proportioned.
4. The temperatures in all CVs are the same and constant.
5. The tooth numbers of the two gears are the same. A pump is divided into 2n+2 control volumes, where n is the tooth number of a gear. Figure 1 shows he flows between those control volumes. This method is similar to but not the same as that in. There is no variation in the number of the control volumes which causes variation in the number of differential equations.
Fig. 1. Shows the flows between those control volume
Experimental Data Analysis
Data from experiments is traditionally used to analyze the mean response and Importance of the Taguchi method. It is for study and analysis of the variation of the response-using Signal-to-Noise (S/N) ratio. The reason for this is to minimize the variation in the quality characteristics due to uncontrollable parameters (Manoharan and Arunachalam,
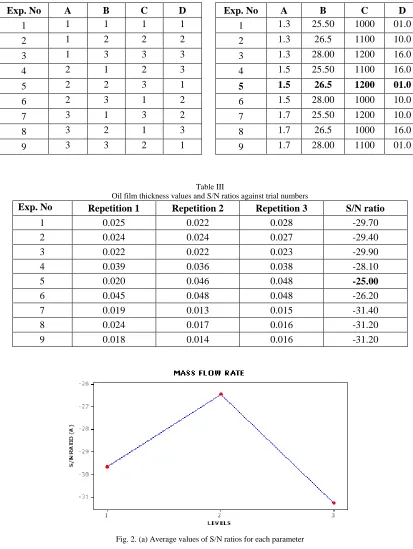
2007). The oil film thickness is a “larger the better” type quality characteristic. So the S/N ratio for that type of response was used in Table 2. The S/N ratios were computed for each of the 9 trial conditions .The values, the average for each parameter at different levels and the standard deviations
Exp. No A B C D Exp. No A B C D
1 1 1 1 1 1 1.3 25.50 1000 01.0
2 1 2 2 2 2 1.3 26.5 1100 10.0
3 1 3 3 3 3 1.3 28.00 1200 16.0
4 2 1 2 3 4 1.5 25.50 1100 16.0
5 2 2 3 1 5 1.5 26.5 1200 01.0
6 2 3 1 2 6 1.5 28.00 1000 10.0
7 3 1 3 2 7 1.7 25.50 1200 10.0
8 3 2 1 3 8 1.7 26.5 1000 16.0
9 3 3 2 1 9 1.7 28.00 1100 01.0
Table III
Oil film thickness values and S/N ratios against trial numbers
Exp. No Repetition 1 Repetition 2 Repetition 3 S/N ratio
1 0.025 0.022 0.028 -29.70
2 0.024 0.024 0.027 -29.40
3 0.022 0.022 0.023 -29.90
4 0.039 0.036 0.038 -28.10
5 0.020 0.046 0.048 -25.00
6 0.045 0.048 0.048 -26.20
7 0.019 0.013 0.015 -31.40
8 0.024 0.017 0.016 -31.20
9 0.018 0.014 0.016 -31.20
Fig. 2. (b) Shows that the influence of mass flow rate and load which are being maintained. For S\N ratio (speed noise ratio)
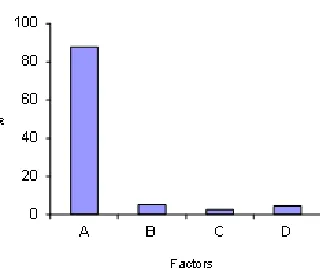
Fig. 3. Pareto chart for % contribution of factor
Figure 3 Shows for representing the contribution of source variation with respect to operational factors. The above said graph was constructed from the source of variation used in Table IV.
Table IV ANOVA Table
Source
of Variation
Sum
of Squares DOF Mean
clearance factor
Tangential at 5% level
A 36.38 2 18.19 16.84259 19
B 2.16 2 1.08 1 --
C 1 2 0.5 0.462963 19
ANOVA Calculation - Refer Table IV
Design of Surface Software
BW*MF R 1.8 1.5 1.2 29 28 27 26 25
JS* MF R
1.8 1.5 1.2 1300 1200 1100 1000 900 load*MF R 1.8 1.5 1.2 20 10 0 JS*BW 28.5 27.0 25.5 1300 1200 1100 1000 900 load*BW 28.5 27.0 25.5 20 10 0 load* JS 1200 1050 900 20 10 0 Hold Values MFR 1.7 BW 28 JS 1200 load 16 SNR
-35.0 - -32.5 -32.5 - -30.0 -30.0 - -27.5 -27.5 - -25.0 > -25.0 < -37.5 -37.5 - -35.0 Contour Plots of SNR
Fig. 4. Contour plots SNR (Speed Noise Ratio)
Column 1 2 3 4
FACTOR A1 A2 A3
B1 B2 B3
C1 C2 C3
D1 D2 D3
LEVEL SUM 89.00 79.00 -93.80
89.20 85.60 -87.30
87.10 88.70 -86.30
85.90 87.00 -89.20
Total Sum -262.10 -262.10 -262.10 -262.10
Square 7921 6288.49
8798.44
7956 7327.36 7621.29
7586 17867 7447
7378 17569 956.64
Sum of Square 23007.93 22905.29 22901.79 22904.45
Mean Sum of
Square 7669.31 7635.10 7633.93 7634.82
Correction 7632.93 7632.93 7632.93 7632.93 Total
Total Sum of
Squares 36.38 2.16 1.00 1.88 41.42
Contribution
Ratio 0.88 0.05 0.02 0.05
i 30.0 SNR -32.5 27.5 -30.0 -27.5 -25.0 BW 1.0 MFR1.5 2.0 25.0
1200 SNR -40 -35 -30 -25 1050JS 1.0 1.5 900
2.0 MFR 20 SNR -35 10 -30 -25 load 1.0 1.5 0
2.0 MFR 1200 SNR -35 -30 -25 1050JS 25.0BW27.5 30.0 900
20 SNR -32.5 -30.0 10 -27.5 -25.0 load 0 25.0BW27.5 30.0
20 SNR -35 10 -30 -25 load 0 900 1050 1200JS
Hold Values MFR 1.7 BW 28 JS 1200 load 16 Surface Plots of SNR
Fig. 5. Surface plots of SNR
The figure 4 and 5 are located and represented for surface contains, which has developed by response surface method (RSM) for new arrival of surface plots with respect to the formation and position in two and three dimensional view.
Influence of operational parameters: pressure and rotational speed, load, friction & torque
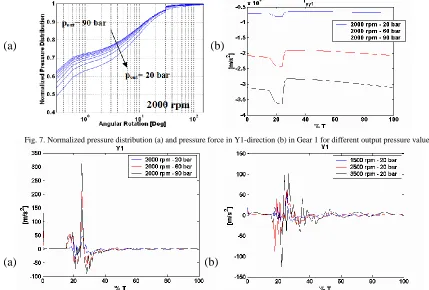
Figure 6 and Figure 7a illustrate the influence of the output pressure on the stationary centre locations and on pressure distribution around the driving gear. The simulation results are obtained at rotational speed of 2000 rpm and increasing the output pressure from 20 to 90 bars the circle in Figure 6 represents the maximum displacement of gear axes, allowed by the nominal clearance (hrn) of 0.0245 mm between gears and pump case.
The results depicted in Figure 6 show that as the output pressure increases, the eccentricity modulus of both gears increases, in fact the markers in Figure 6 move closer to the maximum displacement circle. This behavior can be interpreted as a consequence of the gear (Gabriella Delino et al., 2010) reaction increase due to the enhancing of the gear pump output pressure (Mucchi, 2007). In fact, as the pressure forces increase, the new axis centre locations move reducing the actual clearance in gear tooth profile and therefore the gear reaction increases; this way, the new reaction can balance the
increased pressure forces.
On the other hand, the pressure distribution in the tooth spaces, normalized to the output pressure value as shown in Figure 7a.It exhibits a sudden variation in the first tooth spaces as depicted , due to the eccentricity direction, the minimum meat us height is located in the first tooth spaces (Palanikumar, 2008). Moreover, the higher output pressures, the more anticipated in the first isolated spaces, this sudden variation (Palanikumar, 2008). This behavior can be explained referring to the volumetric flow rate. In fact, it is worth noting that the volumetric flow rate directly depend on the pressure drop ∆pi between two consecutive vanes and on the meatus height hi Qi ∝ hi⋅ ∆pi, subscript i refers to the generic meatus while the meatus height strictly depends on gear eccentricity.
Considering the volumetric flow rate as approximately constant in all the meatus, the global pressure drop from outlet to inlet volumes is distributed among the meta as inversely proportional to h3 (Dalpiaz et al., 2006) . Therefore, increasing the output pressure value, the actual clearance between tooth (Jae-seobkwak, 2005) tip and pump case globally decreases, but this alters the ratios between two consecutives meatus heights h 3 in such a way that the sudden variation of the Normalized pressure distribution is more anticipated in the first isolated spaces (Ravikumar and Mohamad Abdul Hafeez, 2014).
Fig. 6. Characteristics curve for pressure Variation and speed load, friction
Figure 7 b Stationary centre position for the driving gear with different output pressure values; the representation is in the reference frame of the circle represents the maximum displacement of gear axes, allowed by the nominal clearance hrn = 0.0245 mm between gears and pump case (Mucchi, 2007). Furthermore, Figure 8 shows the influence of the pressure variation on the pressure force concerning the driving gear in Y-direction, for one meshing period T, starting at the instant when the second tooth pair comes in contact. It can be noted that the pressure force is noticeably affected by an increase of output pressure due to their direct dependence on
sure distribution; the same behavior occurs for the other directions and for the driven gear, not shown hereafter (Ravikumar et al., 2014). On the other hand, for the gear accelerations, depicted in Figure 8a, the output pressure dependence is not as pronounced as for the pressure forces because the gear accelerations are the balance between all the dynamic forces anyway, considering the peaks in the accelerations at about 25% of the meshing period, the higher peaks are relative to the accelerations obtained at higher output pressure.
(a)
(b)
Fig. 7. Normalized pressure distribution (a) and pressure force in Y1-direction (b) in Gear 1 for different output pressure values
(a)
(b)
i The influence of the rotational speed on the stationary centre position is similar to the influence of the pressure already described above; in particular as the shaft rotational speed decreases from 3500 to 1500 rpm, the eccentricity modulus value increases from 0.02284 to 0.02372 mm for gear 1 and from 0.02308 to 0.02384 mm for gear. In fact, as the rotational speed decreases, the bearing reaction tends to decrease too, due to the direct relation with the operational speed and the new axis centre location will change, decreasing the actual clearance in the gear this way, a new equilibrium between the dynamic forces is established (Gabriella Delino et al., 2010). As a consequence, when the rotational speed decreases, the pressure distribution in the tooth spaces is altered in a similar way as occurs when the output increases, for analogous reasons. In addition, Figure 4b shows the influence of the operational speed variation on the acceleration in Y1-direction for gear 1: it can be noted that an increase of the operational speed determines an increase of the gear acceleration.
Effect of Design Parameters
Effect of Clearance Modifications
In the pump under testing, the nominal clearance hrn between pump case and tooth tip has the same value as the nominal clearance Cr in the journal bearing, equal to 0.0245 mm (Ravikumar et al., 2014). These dimensions, as shown below, have an important influence on pressure distribution, on gear accelerations as well as on the stationary centre position. In this section the influence of a modification of the nominal clearances Cr and hrn will be shown. Reference includes all the details about the clearances involved in the pump working and several clarifying figures. The simulation results presented in this section are obtained at the operational condition of 3350 rpm and 20 bar (Ford lumban gaol et al., 2011). Table 1 collecting the normalized eccentricity modulus and the eccentricity direction angle in the stationary centre position, shows the influence of a clearance alteration on the stationary centre position of gear 1; it can be observed that as the nominal clearance increases, the stationary centre position becomes closer to the maximum
allowed displacement, in fact the eccentricity modulus increases too. Moreover, Table I Collects the values of the actual minimum clearance Cr , χ in the journal bearings that obviously depends not only on the nominal clearances Cr but also on the eccentricity ( Cr , χ = (1 − χ ) Cr). It can be noted that as the nominal clearance Cr increases, the bearing reaction tends to decrease; so, due to the dynamic force equilibrium, the actual minimum clearance decreases. On the other hand, about the influence of these clearances on pressure distribution around the driving and driven gear, it can be noted that as the nominal clearance value increases, the pressure in the first tooth spaces reaches a higher pressure value earlier (as it occurs if the output pressure increases) (Gabriella Delino et al., 2010). This pressure distribution behavior can be explained as a consequence of the increase of the eccentricity modulus (Table 1) which alters the ratios between two consecutives meatus heights (h3) as explained in the previous section.
The pressure forces depend on clearance alteration too, since they are obtained using the pressure distribution. Figure 9 (a) and 9 (b) shows the influence of the clearance value on pressure force evaluated over one meshing period, starting at the instant when the second tooth pair comes in contact. It can be noted that, as the clearance value increases, the pressure force amplitude also increases due to the different trends on the pressure distribution (Jae-seobkwak, 2005). Finally, Figure 5b shows the clearance influence on the acceleration acting on gear 1 at operational condition of 3350 rpm and 20 bar expressed as a function of meshing period. No important differences in accelerations between the three clearance conditions can be observed; in fact, even if pressure forces increase as the clearance value increases, the bearing reactions change in order to balance the pressure forces at best. For this reason, the accelerations, that are obviously the consequence of the balance between the pressure forces, meshing forces and the bearing reaction forces, do not change in an important way (Mucchi, 2007). Table 5shows the clearance influence on stationary centre position (in modulus and direction angle) at 3350 rpm and 20 bar for gear 1 and influence on the actual minimum clearance.
Table V
Clearance influence on stationary centre position
Nominal clearance [mm] 0.019 0.0245 0.0275
Eccentricity modulus χ (normalized) 0.900 0.935 0.946
Actual minimum clearance Cr , χ [mm] 0,0019 0,0016 0,0015
Eccentricity direction angle [deg] in the reference frame O1X‟1Y‟1
(a) (b)
Fig. 9. Clearance influence on (a) Pressure Force and (b) Acceleration
Figure 9 Clearance influence on (a) pressure force and (b) acceleration in X1-direction for gear 1 over one meshing period T; operational conditions of 3350 rpm and 20 bars.
Effect of the relief groove dimension
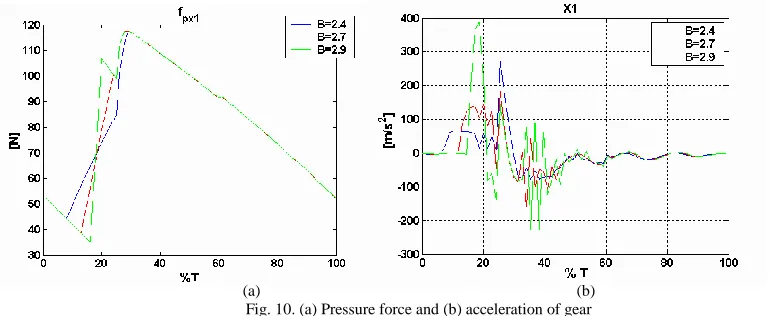
Figure 6 shows the pressure force in X1-direction for different kinds of relief grooves such a dimension has great influence on the performance of the gear pump, in fact it
can be noted that with reduced length B (Gaitonde et al., 2006), the discontinuities on the pressure forces is smoother due to the increase of the contemporaneous communication of the inlet and outlet chambers. In fact, remembering equation the contemporaneous communication between the inlet and outlet volume is 3.5% of the meshing period with dimension B of 2.9 mm, while with B=2.7 mm it is 10% and finally with B=2.4 mm it is 20%.
(a) (b) Fig. 10. (a) Pressure force and (b) acceleration of gear
Figure 10 (a) Pressure force and (b) acceleration of gear 1 in X1-direction over one meshing period with different dimensions of the relief grooves (length B of 2.4, 2.7 and 2.9 mm).
The results in terms of gear accelerations (Figure 10 a & b) show that the relief grooves with length 2.9 mm determine larger oscillations than with lower relief groove lengths due to the decrease of the contemporaneous communication with the inlet-outlet volumes; moreover the smaller length B (Gaitonde et al., 2006), the lower the pump efficiency. Therefore, the designer has to take into account that in order to reduce the gear vibrations (Dalpiaz et al., 2006), the relief groove length has to be reduced, but in order to increase the pump volumetric efficiency, the relief groove
length has to be increased (Dalpiaz et al., 2006). CONCLUSIONS
the designer has to require into thought that therefore on reduce gear noise, vibrations and friction the path of arc of contact has to be hyperbolic, but therefore on extend the pump performance; the clearance has to be maintained.
i) The live of force and effects of oil fortifier in mechanics gear pump below dynamic loading conditions and investigation of mechanics gear pump below vertical curvilinear unsteady lots.
ii) The live of oil film pressure distribution, identification of dynamic stiffness, and
damping Co-efficient.
iii) The film pressure can increase with surface roughness effects below the constant
mean Reynolds‟s selection.
iv) Surface contours put together arrived for gear strength analysis practice kind of code
package.
v) Finally, this work area unit about to be useful therefore on gauge vogue directions so
on foresee the influence of in operation conditions and elegance modifications on friction, vibration and noise generation. This analysis work will contribute the necessity of the industries like pump business, automobile, aircraft, assortment and scrutiny & testing. The novel technique that covers the Taghuchi and RSM (response surface method) for facultative the comparable results [10] that obtained by practice kind of experiments. The name of experiments is for measure the resistance force, eddy current Cap device and oil film thickness. The on high of techniques unit combination of every.
REFERENCES
[1] Dalpiaz, A., Elia, G.D., Mucchi, E., and Fernandez Del Rincon, A., Modeling run in process in external gear pumps, Proceedings of ESDA 2006, Torino, Italy, 2006.
[2] Dalpiaz, G., Elia, G.D., Mucchi, E., and Fernandez Del Rincon, A., Modeling run in process in external gear pumps, Proceedings of esda 2006-95466, 2006.
[3] Ford lumban gaol, Mehdi Roopaei, Svetlana Perry and Jessica Xu, Application of taguchi and response surface methodologies for surface roughness in rotary tool polishing hardness mould steels, Potejansak potejana et al., Applied Mechanics and Materials, 87, 82., 2011.
[4] Gaitonde, V.N., Karnik, S.R., Achyutha, B.T., Siddeswarappa, B., Multi-response optimization in drilling using Taguchi‟s quality loss function. Indian Journal of Engineering and Materials Sciences, 13: 484-488, 2006.
[5] Gabriella Delino, Jack P.C. Kleijnen and Carlo Meloni. Robust optimization in simulation: taguchi and response surface methodology. International Journal of Production economics, 125: 52-59, 2010.
[6] Jae-seobkwak. Application of taguchi and response surface methodologies for geometric error in surface grinding process. International Journal of Machine Tools and Manufacture, 45(3): 327-334, 2005.
[7] Manoharan, C., and Arunachalam, V.P., Dynamic analysis of hydrodynamic bearing performance in IC engines using Taguchi
[8] Mucchi, E., Dynamic analysis of external gear pumps by means of non linear models and experimental techniques, Ph.D. Thesis, EnDIF- Engineering Department in Ferrara, Universita degli Studi di Ferrara, Ferrara, Italy., 2007.
[9] Palanikumar, K., Application of Taguchi and response surface methodologies for surface roughness in machining glass fiber reinforced plastics by PCD tooling, International Journal of Advanced Manufacturing Technology, 36(1): 19-27, 2008. [10] Ravikumar, R., Mohamed Abdul Hafez, M., Velmanirajan, K., and
Nanthakumar, K., Investigation of machining parameters in CNC turning of en3 low carbon steel using genetic algorithm and response surface methodology, Applied Mechanics and Materials, 592: 883-887, 2014.
[11] Ravikumar. R., and Mohamad Abdul Hafeez, M., Investigation of
machining parameters for burr minimization in CNC turning of brass using RSM and GA. Applied Mechanics and Materials, 627: 54-59, 2014.
[12] Shivapragash, B., Chandrasekaran, K., Parthasarathy, C., and