e-ISSN: 2278-7461, p-ISSN: 2319-6491
Volume 6, Issue 1 (Jan 2017) PP: 40-48
Effects of w/b Ratio and Binder Content on Mechanical and
Durability Properties of High Performance Concrete
MohammadReza Sharbaf
1, Navid Salehi Najafabadi
2, Mohammadreza Eftekhar
3 1Department of Civil and Environmental Engineering and Construction, University of Nevada las Vegas, USA2Department of Civil Engineering, University of Houston, USA 3
Department of Civil Engineering, Isfahan University of Technology, Iran
Abstract:-
Effects of water to binder (w/b) ratio and binder content on mechanical and durability properties of High Performance Concrete (HPC) are investigated in this study. Twelve combinations with w/b ratios of 0.3, 0.34, 0.38, and 0.42 and binder contents of 330, 440, and 550 kg/m3 were made. All mixes contained silica fume which are amounted to 10% of the cement content. Compressive strength tests at 7 and 28 days of curing and flexural strength tests at the age of 28 days were made as mechanical properties of concrete. Durability tests were performed on the specimens, which included water absorption, sorptivity, initial water absorption and electrical resistivity. According to the test results, a reduction in w/b ratio is accompanied by an increase in compressive strength. Besides, the highest compressive strength after 7 and 28 days of curing belonged to concrete mixes with binder contents of 550 and 440 kg/m3, respectively. In the case of flexural strength, an increase in binder content was accompanied by an increase in flexural strength for most of the w/b ratios. Although the changes in w/b ratios have remarkable effects on the durability properties of HPC, but no unique conclusion can be made regarding these changes. Moreover, as concluded from the experiment results, the more we decrease the binder content the more improvement in durability properties was obtained, regardless of the w/b ratio.Keywords: High performance concrete, Mechanical properties, Durability, Electrical resistivity
I.
INTRODUCTION
Based on their results, the electrical resistivity of concrete also increases by increasing in cement content. Similar results were observed in the capillary water absorption tests. Zhutovsky and Kovler [8] carried out sorptivity tests. They reported that an increase in w/c ratio is accompanied by an increase in sorptivity values. For example, after 28 days they recorded sorptivity values of 58, 67, and 92 mm/min1/2 for w/c ratios of 0.21, 0.25, and 0.33. The last quarter of the 20th century brought about some technological improvements in the manufacturing of cement. Cements with higher blaine fineness values and higher tricalcium silicate contents were produced. This came as an answer to the demand of high early strength concrete. When this higher quality cement became available, it was then possible to reduce the cement content and yet achieve the same levels of strength. Moreover, the finer cement also called for higher w/c ratios. The resulting concretes were less durable than those previously produced. Consequently, many concrete structures built in 1970s, have been suffering from durability problems [9]. Nowadays, to counter such durability issues, currently concrete codes have set some limitations for the maximum w/c ratio, and higher workability is achieved by the addition of superplasticizers. These standards also set a minimum limit for the cement content in concrete [10, 11]. They believe that the more usage of cement results in the more durable concrete. In contrast, some of researches have opposed this theory [4, 5]. Therefore, one of the goals of this study is to investigate the effects of cement content on durability properties of HPC.On the other hand there is a lack of research on the effects of w/b ratio and binder content on properties of HPC. So the aim of this work is to investigate the effects of these parameters on mechanical and durability properties of HPC. 7 and 28 days compressive strength and flexural strength tests were carried out to investigate the mechanical properties of concrete. Durability parameters including water absorption, initial water absorption, sorptivity, and electrical resistivity were measured.
II.
EXPERIMENTAL
PROCEDURE
A. Materials
The cement used in this study was Type II Portland Cement (PC) conforming to Iranian standard (ISIRI). Silica fume was used in the production of the HPC mixtures. The chemical compositions of cement and silica fume are presented in Table 1, and their physical characteristics are presented in
Table 2.
Constituent Cement Silica fume
SiO2 22 85.5
Al2O3 5 1.3
Fe2O3 3.82 1.8
CaO 64 1.3
MgO 1.9 1.7
SO3 1.5 0.5
K2O 0.49 1.5
Na2O 0.25 0.49
L.O.I. 1.5 >3.5
Table 1- Chemical compositions of cement and silica fume
Property Cement Silica fume
Specific gravity 3.15 2.2
Blaine fineness (cm2/kg) 3240 21150
Initial setting time (min) 95 -
Final setting time (min) 150 -
Table 2- Physical properties of cement and silica fume
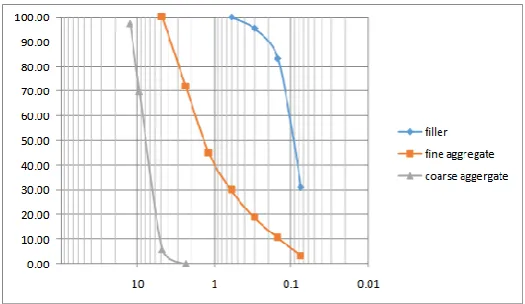
For coarse aggregate, limestone gravel with a nominal maximum size of 12.5 mm was used. For fine aggregate, a mixture of limestone powder (as filler) and crushed limestone sand were used. The sand had a maximum size of 4.75 mm. Fineness modulus of crushed fine aggregates was equal to 3.25. The physical properties and sieve analysis results for the aggregates are shown in Table 3. Besides, Fig. 1 presents gradation curves of aggregates. The superplasticizer (SP) was of polycarboxylic-ether type with a specific gravity of 1.096 in liquid state. The solid content of SP was 32%.
Sieve size (mm) Filler
(%passing)
Fine aggregate (%passing)
Coarse aggregate (%passing)
12.5 100 100 97.4
9.5 100 100 69.7
4.75 100 98.2 5.8
2.36 100 72.3 0
1.18 100 44.7 0
0.6 100 29.9 0
0.3 100 18.6 0
0.15 92.3 10.4 0
0.075 31.1 3.1 0
Specific gravity 2.88 2.43 2.68
Absorption (%) 8.9 5 1.4
Table 3- Sieve analysis and physical properties of aggregates
Fig. 1- Particle size distribution curves of aggregates
B. Mix Design Proportions
A total number of 12 concrete mixtures were designed. The four different w/b ratios were 0.3, 0.34, 0.38 and 0.42. For each w/b ratio three binder contents of 330, 440 and 550 kg/m3 were used. Silica fume dosage was chosen as 10% of the cement content for all mixes. The selection of SP dosage was based on the goal that all
mixtures shall have the same prescribed workability. The mix proportions of concrete mixes and their details are
presented in table 4.
A short-form naming system had been adopted for convenience. A hyphenated name was assigned to each concrete mix. The first part of the name is the w/b ratio times 100. The second part of the name is the binder content in kg/m3 divided by 10. For example, 38-44 is a representation of the mixture with a w/b ratio of 0.38 and binder content of 440 kg/m3.
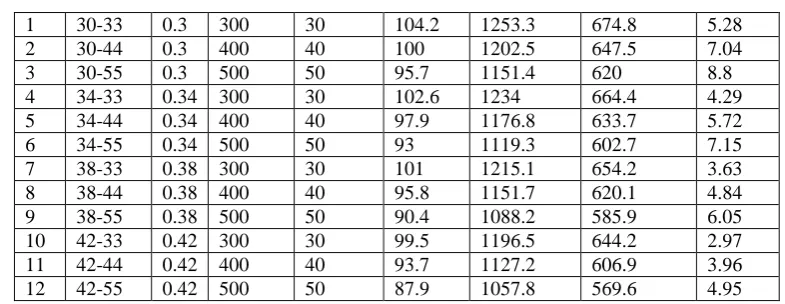
No. Mixture Name w/b
1 30-33 0.3 300 30 104.2 1253.3 674.8 5.28
2 30-44 0.3 400 40 100 1202.5 647.5 7.04
3 30-55 0.3 500 50 95.7 1151.4 620 8.8
4 34-33 0.34 300 30 102.6 1234 664.4 4.29
5 34-44 0.34 400 40 97.9 1176.8 633.7 5.72
6 34-55 0.34 500 50 93 1119.3 602.7 7.15
7 38-33 0.38 300 30 101 1215.1 654.2 3.63
8 38-44 0.38 400 40 95.8 1151.7 620.1 4.84
9 38-55 0.38 500 50 90.4 1088.2 585.9 6.05
10 42-33 0.42 300 30 99.5 1196.5 644.2 2.97 11 42-44 0.42 400 40 93.7 1127.2 606.9 3.96 12 42-55 0.42 500 50 87.9 1057.8 569.6 4.95
Table 4- Mix proportions of the concrete specimens
C. Mixing Procedure
Half of the mixing water was mixed with the superplasticizer and silica fume. The mixing procedure was performed in a high speed mixer with a speed of 500 RPM for 3 minutes which resulted in formation of a homogenized gel. Filler, sand and coarse aggregates were mixed for 3 minutes in a rotary mixer. In next step, the cement and the mentioned gel were added to the mixer and the mixing process was continued for another 2 minutes. Then the rest of the mixing water was added to mixture and the mixing continued for another 5 minutes.
D. Preparation of Specimens
Cubic molds with dimensions of 150×150×150 mm were used for compressive strength test. For flexural tests, 100×100×500 mm beam molds were used. Cylindrical molds with diameter of 100 mm and height of 50 mm were made for sorptivity, initial water absorption and water absorption tests. For the electrical resistivity test, cylindrical molds with diameter of 100 mm and height of 200 mm were casted. The molds were covered with a moist thick textile for 24 hours. Then the specimens were demolded and cured in water at the temperature of 20 °C until the time of the test.
III.
TESTING
OF
THE
SPECIMENS
A. Compressive and flexural strength
Tests performed on hardened concrete included the compressive and flexural strengths which are aimed to determine the mechanical properties. Compressive strength tests were carried out on cubic specimens after 7 and 28 days of curing. The flexural strength tests were made on beam specimens after 28 days. Then the strength values are the average of three tests.
B. Water absorption
This test is based on ASTM C642 [12] for testing water absorption of hardened concrete. This test was performed on the cylindrical specimens with a height of 50 mm and a diameter of 100 mm. They were initially kept in drying oven for 72 hours at the temperature of 110° C and then were submerged in water for 72 hour. After boiling the specimens in water for 5 hours, the surfaces of the specimens were dried (as in SSD conditions) and then they were weighted. The relative water absorption was calculated by dividing the weight of the absorbed water by their initial weight and the resulting value was multiplied by 100.
C. Sorptivity and initial water absorption
This test was performed according to the ASTM C1585 [13] standard. The specimens were dried in oven at 110 °C for 72 hours. In order to prevent water evaporation, sides of the specimens were insulated with epoxy resin. The specimens were placed on rods and they were immersed in water by a depth of 5 mm. The sorptivity tests determine the capillary water absorption of concrete specimens. Neville [14] gives a relation for sorptivity:
Equation 1 :
Initial water absorption is the quantity of absorbed water by a unit surface area during 1st hour of the test in unit of kg/m2. This test is important in the cases in which a structure is exposed to a temporary wetting such as concrete facades exposed to rain and other resembling events.
D. Electrical resistivity
One of the most common approaches to evaluate the porosity and permeability of concrete is the electrical resistivity test. This parameter is also a good representative parameter indicating the resistance of concrete against the chloride ion penetration. The related specimens were 100 mm in diameter and 200 mm in height. The specimens were tested in saturated conditions at two different voltages and the corresponding current was measured. The electrical resistance and the electrical resistivity were calculated by Eq. 2 and Eq. 3, respectively. Polarization generates excess resistance in addition to actual resistance of concrete. The use of Eq. 2 will cause the effects of polarization to be vanished.
Equation 2:
Equation 3:
IV.
TEST
RESULTS
AND
DISCUSSION
The results of mechanical and durability tests are shown in Fig. 2 to 8. In all these diagrams, the x-axis represents the w/b ratio and the y-axis represents the relevant parameter under discussion. Each curve is a representative of constant binder content. Looking at the diagrams in the vertical direction shows how the binder content affects the desired parameter. In the following each parameter is discussed separately.
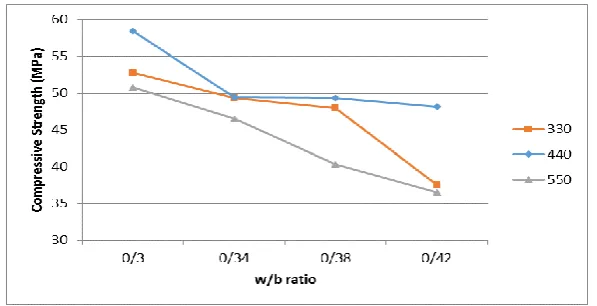
A. Compressive Strength
Fig. 2- Results of 7days compressive strength test for different w/b ratios and binder contents
Fig. 3- Results of 28 days compressive strength test in different w/b ratios and binder contents
B. Flexural Strength
Fig. 4- Results of flexural strength test in different w/b ratios and binder contents
The results of the flexural test are plotted in Fig. 4. Except for the case of w/b = 0.42, an increase in the binder content resulted in an increase in flexural strength. As concluded from the diagrams, it can be seen that no particular relationship exists between the w/b ratio and the flexural strength. The highest flexural strength was observed in the 30-55 group.
Fig. 5 - Results of water absorption test in different w/b ratios and binder contents
C. Water absorption
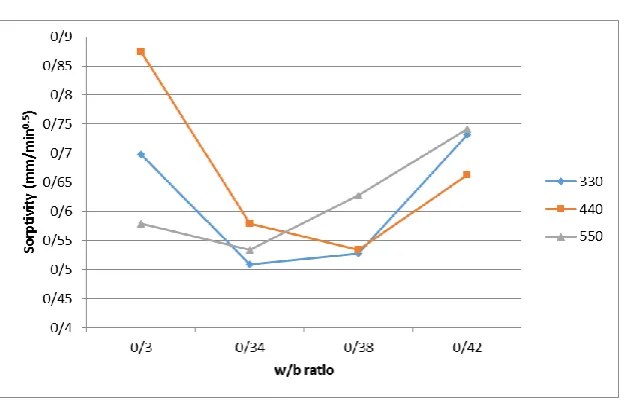
Fig. 6 - Results of sorptivity test in different w/b ratios and binder contents
D. Sorptivity
The results of this test are shown in Fig. 6. Lower sorptivity indicates better durability characteristics. The curves have a bowl-like shape and attain their minimum values in the middle ranges (0.34, 0.38) of the w/b ratios. No conclusion can be made about the effect of binder content on sorptivity. Moreover, in higher w/b ratios the binder content of 550 kg/m3 represents the highest sorptivity values and as a conclusion the lowest durability. This conclusion is in accordance with water absorption tests results. Besides, in lower w/b ratios (0.3, 0.34) the highest sorptivity belongs to the binder content of 440 kg/m3.
Fig. 7 - Results of initial water absorption test in different w/b ratios and binder contents
1) Initial Water Absorption
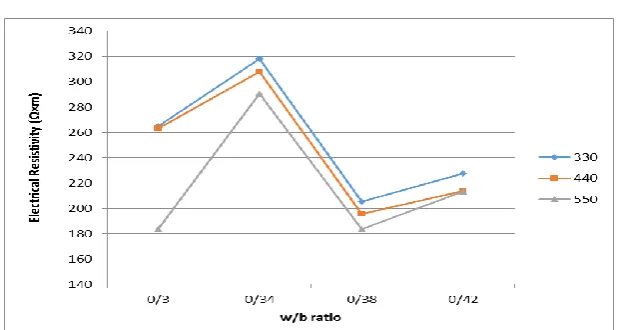
Fig. 8 - Results of electrical resistivity test in different w/b ratios and binder contents
2) Electrical resistivity
Fig. 8 shows the results of the electrical resistivity tests (calculated by Eq. 2 and Eq. 3). Higher values of electrical resistivity represent better durability properties. Resistivity values have the dimension of Ω×m. An increase in binder content is accompanied by a reduction in electrical resistivity in all w/b ratios. Curves with different binder contents nearly coincide with each other. The highest values of electrical resistivity belong to water to binder ratio of 0.34 in all binder contents. As concluded from Fig.8, the changes of w/b ratios have much more prominent effects on electrical resistivity in comparison with the changes of binder content.
V.
SUMMARY
AND
CONCLUSION
The following conclusions are drawn from the results of the tests:
- An increase in the w/b ratio was accompanied by a decrease in compressive strength for both 7 and 28 days tests regardless of binder content. No relationship was observed between the w/b ratio and flexural strength of HPC specimens.
- An increase in 7 days compressive strength was observed when the amount of binder content was elevated in all w/b ratios. Somewhat similar results were observed for the case of flexural strength. The case of 28 days compressive strength was noteworthy. The highest strength in this category was observed in groups with 440 kg of binder per cubic meter of concrete in all w/b ratios.
- Increasing the binder content leads to an increase in the water absorption and initial water absorption and a decrease in electrical resistivity of concrete.
- From most of the tests it is understood that specimens with lower binder content demonstrate better durability properties.
- In higher w/b ratios the binder content of 550 kg/m3 intensely declines the durability properties of HPC including water absorption, sorptivity and initial water absorption.
- In general middle ranges of w/b ratios (0.34, 0.38) have the lower sorptivity and initial water absorption amounts regardless of binder content.
- The changes of w/b ratios have much more prominent effects on electrical resistivity in comparison with the changes of binder content.
VI.
ACKNOWLEDGEMENT
This research was supported by Bekar Construction Company. We thank Bekar Company for providing required materials and test equipment.
REFERENCES
[1] Mehta PK and Aïtcin PC, Principles Underlying the Production of High- Performance Concrete. Cement, Concrete and Aggregates Journal, 1990, 12(2) : 70- 78.
[2] Newman J and Choo BS, Advanced concrete technology (concrete properties). Elsevier, London, UK,, 2003, pp. 4/5 & 8/23.
[3] Aïtcin PC, The durability characteristics of high performance concrete: a review. Cement & Concrete Composites, 2003, 25: 409–420.
[4] Wassermann R, Katz A and Bentur A, Minimum cement content requirements: a must or a myth?. Materials and Structures, 2009, 42:973–982.
[6] Parichatprecha R, Nimityongskul P, Analysis of durability of high performance concrete using artificial neural networks. Construction and Building Materials, 2009, 23: 910–917.
[7] Jalal M., Mansouri E., Sharifipour M. and Pouladkhan A.R., Mechanical, rheological, durability and microstructural properties of high performance self-compacting concrete containing SiO2 micro and nanoparticles. Materials and Design journal, 2012, 34: 389–400.
[8] Zhutovsky S and Kovler K, Effect of internal curing on durability-related properties of high performance concrete. Cement and Concrete Research, 2012, 42: 20–26.
[9] Mehta PK and Monterio PJM, Concrete, microstructure, properties and materials, McGraw-Hill, CA, USA, 2006
[10] EN (2000) 206-1: Concrete - Part 1: Specification, performance, production and conformity (English version). European Committee for Standardization, Brussels, Belgium, p. 65.
[11] ACI (American Concrete Institute) (1991- reproved 1997) ACI 211-91: Standard Practice for Selecting Proportions for Normal Heavyweight, and Mass Concrete. American Concrete Institute, Farmington Hills, MI, USA. P. 10.
[12] ASTM (2006) C 642: Standard Test Method for Density, Absorption, and Voids in Hardened Concrete. ASTM International, West Conshohocken, PA, USA.
[13] ASTM (2004) C 1585: Standard Test Method for Measurement of Rate of Absorption of Water by Hydraulic-Cement Concretes. ASTM International, West Conshohocken, PA, USA.