Volume 1, Issue 4 (September2012) PP: 58-67
An Experimental and Analytical Study On Composite High
Strength Concrete – Fibre Reinforced Polymer Beams
R.S.Ravichandran
1, K. Suguna
2and P.N. Raghunath
31Assistant professor, 2Professor and 3Professor
1,2,3Department of Civil and Structural Engineering, Annamalai University, Chidambaram-608 001, India
Abstract––This paper presents the results of a nonlinear Finite Element (FE) analysis conducted on Reinforced High Strength Concrete (HSC) beams strengthened with Glass fibre reinforced polymer (GFRP) laminates. Modeling the complex behavior of reinforced concrete, which is both non-homogeneous and anisotropic, is a difficult confront in the finite element analysis of civil engineering structures. The accuracy and convergence of the solution depends on factors such as mesh density, constitutive properties of concrete, convergence criteria and tolerance values etc., Three-dimensional finite element models were developed using a smeared crack approach for concrete and three Three-dimensional layered elements for the FRP composites. The results obtained through finite element analysis show reasonable agreement with the test results.
Keywords–– Reinforced Concrete, Nonlinear Analysis, Finite Element Analysis and GFRP.
I.
INTRODUCTION
Strengthening or upgrading becomes necessary when the structural elements cease to provide satisfactory strength and serviceability. Fiber Reinforced Polymer (FRP) composites can be effectively used as an external reinforcement for upgrading such structurally deficient reinforced concrete structures. The most common types of FRP are aramid, glass, and carbon; AFRP, GFRP, and CFRP respectively. Many researchers have found that FRP composites applied to reinforced concrete members provide efficiency, reliability and cost effectiveness in upgradation[4,5,9]. The use of FEA has been the preferred method to study the behaviour of concrete. Wolanski[2] studied the flexural behavior of reinforced and prestressed concrete beams using finite element analysis. The simulation work contains areas of study such as Behavior at First Cracking, Behavior at Initial Cracking, Behavior beyond First Cracking, Behavior of Reinforcement Yielding and Beyond, Strength Limit State, Load-Deformation Response of control beam and Application of Effective Prestress, Self-Weight, Zero Deflection, Decompression, Initial Cracking, Secondary Linear Region, Behavior of Steel Yielding and Beyond, Flexural Limit State of prestressed concrete beam. Arduini, et al.[3] used finite element method to simulate the behaviour and failure mechanisms of RC beams strengthened with FRP plates. The FRP plates were modeled using two dimensional plate elements. However the crack patterns were not predicted in that study. Kachlakev, etal.[7] studied the finite element modeling of reinforced concrete structures strengthened with FRP Laminates with ANSYS and the objective of this simulation was to examine the structural behaviour of Horsetail creek bridge with and without FRP laminates and establish a methodology for applying computer modeling to reinforced concrete beams and bridges strengthened with FRP laminates.
II.
EXPERIMENTAL BEAMS
2.1Materials used
The concrete used for all beam specimens had a compressive strength of 64MPa. The concrete consisted of 450 kg/m3 of ordinary Portland cement, 780 kg/m3 of fine aggregate, 680 kg/m3 of coarse aggregate, 450 kg/m3 of medium aggregate, 0.36 water/cement ratio and 0.8% of hyperplasticizer. The longitudinal reinforcement consisted of high yield strength deformed bars of characteristic strength 456MPa. The lateral ties consisted of mild steel bars of yield strength 300MPa. The specimens were provided with 8mm diameter stirrups at 150 mm spacing. Two types of GFRP laminates were used for the study, namely, Chopped Strand Mat (CSM) and Uni-directional Cloth (UDC) of 3mm and 5mm thickness. The properties of GFRP are shown in Table 1.
TABLE1 Properties of GFRP Laminates Type of
GFRP
Thickness (mm)
Elasticity Modulus
(MPa) Ultimate Elongation (%)
Tensile Strength (MPa)
Chopped Strand Mat
3 7467.46 1.69 126.20
5 11386.86 1.37 156.00
Uni-Directional Cloth
3 13965.63 3.02 446.90
2.2 Details of Beams
A total of 15 beams were tested. The main test variables considered in the study were steel reinforcement ratio, type of GFRP laminate and thickness of GFRP laminate. The beams were 150 x 250 mm in cross-section and 3000 mm in length as shown in Figs.1-3. The beams of A series were reinforced with two numbers of 10 mm diameter bars giving a steel ratio of 0.419%. The beams of B series were reinforced with three 10 mm diameter bars giving a steel ratio of 0.628%. The beams of C series were reinforced with three 12 mm diameter bars giving a steel ratio of 0.905%. Stirrups of 8 mm diameter, at a spacing of 150 mm, were used for the beams. Out of fifteen beams, three served as control beams and the remaining beams were strengthened with GFRP laminate. The details of beams are presented in Table.2
Fig.1 Details of ‘A’ Series Beams Fig.2 Details of ‘B’ Series Beams Fig.3 Details of ‘C’ Series Beams
TABLE 2 Specimen Details
2.3 GFRP Laminate Bonding Technique
Glass Fibre Reinforced Polymer (GFRP) laminates were used for strengthening the beams. The soffit of the beam was well cleaned with a wire brush and roughened with a surface-grinding machine. Two part epoxy adhesive consisting of epoxy resin and silica filler was used to bond the GFRP laminates. The adhesive was spread over the beam soffit with the help of a spread. The GFRP laminate was applied gently by pressing the sheet from one end of the beam to the other along the length of beam.
2.4 Experimental Test Set-up
All the beams were tested under four point bending in a loading frame of 750 kN capacity. The effective span of
Be a m se ries Be a m De sig n a tio n % S te el Re in fo rc em en t GFRP Laminate Co m p o site Ra ti o
Type Thickness
A RA 0.419 - - -
RAC3 0.419 CSM 3 2.864
RAC5 0.419 CSM 5 4.774
RAU3 0.419 UDC 3 2.864
RAU5 0.419 UDC 5 4.174
B RB 0.628 - - -
RBC3 0.628 CSM 3 1.909
RBC5 0.628 CSM 5 3.183
RBU3 0.628 UDC 3 1.909
RBU5 0.628 UDC 5 3.183
C RC 0.905 - - -
RCC3 0.905 CSM 3 1.909
RCC5 0.905 CSM 5 3.183
RCU3 0.905 UDC 3 1.909
dial gauges of 0.01 mm accuracy. The crack widths of beams were measured using a crack detection microscope with a least count of 0.02 mm. Figure.4 shows the loading arrangement and instrumentation adopted for the test.
Fig.4 Experimental Test Set-up
III.
FINITE ELEMENT MODELING
3.1 Element types
3.1.1 Reinforced Concrete
Solid65 element was used to model the concrete. This element has eight nodes with three degrees of freedom at each node – translations in the nodal x, y, and z directions. This element is capable of plastic deformation, cracking in three orthogonal directions, and crushing. A schematic of the element is shown in Figure 5 [6]. Smeared cracking approach has been used in modeling the concrete in the present study [8].
3.1.2 Reinforcement
The geometry and node locations for Link 8 element used to model the steel reinforcement are shown in Figure 6. Two nodes are required for this element. Each node has three degrees of freedom, translations in the nodal x, y, and z directions. The element is also capable of plastic deformation.
3.1.3 FRP Composites
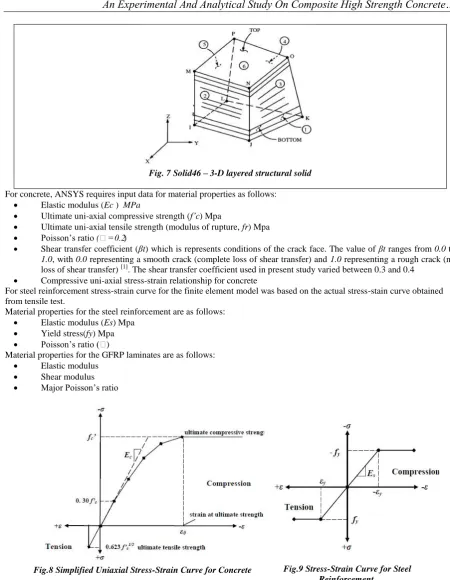
A layered solid element, Solid46, was used to model the FRP composites. The element has three degrees of freedom at each node and translations in the nodal x, y, and z directions. The geometry, node locations, and the coordinate system are shown in Figure 7.
Fig. 7 Solid46 – 3-D layered structural solid
For concrete, ANSYS requires input data for material properties as follows:
Elastic modulus (Ec ) MPa
Ultimate uni-axial compressive strength (f’c) Mpa
Ultimate uni-axial tensile strength (modulus of rupture, fr) Mpa
Poisson’s ratio (=0.2)
Shear transfer coefficient (βt) which is represents conditions of the crack face. The value of βt ranges from 0.0 to
1.0, with 0.0 representing a smooth crack (complete loss of shear transfer) and 1.0 representing a rough crack (no loss of shear transfer) [1]. The shear transfer coefficient used in present study varied between 0.3 and 0.4
Compressive uni-axial stress-strain relationship for concrete
For steel reinforcement stress-strain curve for the finite element model was based on the actual stress-stain curve obtained from tensile test.
Material properties for the steel reinforcement are as follows:
Elastic modulus (Es) Mpa
Yield stress(fy) Mpa
Poisson’s ratio ()
Material properties for the GFRP laminates are as follows:
Elastic modulus
Shear modulus
Major Poisson’s ratio
Fig.8 Simplified Uniaxial Stress-Strain Curve for Concrete Fig.9 Stress-Strain Curve for Steel Reinforcement
3.2 Cracking of Concrete
Fig.9 3-D Failure surface for concrete
3.3 Finite element discretization
The finite element analysis requires meshing of the model. For which, the model is divided into a number of small elements, and after loading, stress and strain are calculated at integration points of these small elements. An important step in finite element modeling is the selection of the mesh density. A convergence of results is obtained when an adequate number of elements is used in a model. This is practically achieved when an increase in the mesh density has a negligible effect on the results.
3.4 Non-linear solution
In nonlinear analysis, the total load applied to a finite element model is divided into a series of load increments called load steps. At the completion of each incremental solution, the stiffness matrix of the model is adjusted to reflect nonlinear changes in structural stiffness before proceeding to the next load increment. The ANSYS program (ANSYS 2010) uses Newton-Raphson equilibrium iterations for updating the model stiffness. Newton-Raphson equilibrium iterations provide convergence at the end of each load increment within tolerance limits. In this study, for the reinforced concrete solid elements, convergence criteria were based on force and displacement, and the convergence tolerance limits were initially selected by the ANSYS program. It was found that convergence of solutions for the models was difficult to achieve due to the nonlinear behavior of reinforced concrete. Therefore, the convergence tolerance limits were increased to a maximum of 5 times the default tolerance limits in order to obtain convergence of the solutions.
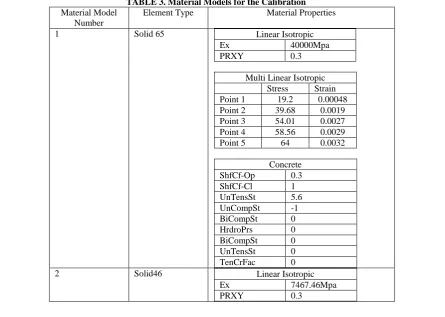
TABLE 3. Material Models for the Calibration Material Model
Number
Element Type Material Properties
1 Solid 65 Linear Isotropic
Ex 40000Mpa
PRXY 0.3
Multi Linear Isotropic Stress Strain Point 1 19.2 0.00048 Point 2 39.68 0.0019 Point 3 54.01 0.0027 Point 4 58.56 0.0029 Point 5 64 0.0032
Concrete ShfCf-Op 0.3 ShfCf-Cl 1 UnTensSt 5.6 UnCompSt -1 BiCompSt 0 HrdroPrs 0 BiCompSt 0 UnTensSt 0 TenCrFac 0
2 Solid46 Linear Isotropic
Ex 7467.46Mpa
3 Link8
Linear Isotropic
Ex 2.0E-05
PRXY 0.3
Bilinear Isotropic Yield Stress 456Mpa Tang. Mod 0
Figs. 10-17 show the finite element modeling of reinforced high strength concrete beams strengthened with FRP laminates.
Fig.10. Modeled Steel Reinforcement Fig.11. Modeled Concrete and Steel
Fig.12. Modeled Concrete, Steel and FRP Fig.13.Full Scale Mesh Modeled Concrete, Steel and FRP
Fig.16. Flexural Crack Signs Fig.17. Concrete Crack Signs
IV.
RESULTS AND DISCUSSION
4.1 Experimental Test Results
Table.4 summarizes the test results at first crack, yield and ultimate stage of non-strengthened and strengthened beams.
TABLE4Principal Results of Tested Beams Beam Designation Loading Stages of Beams
First Crack Stage Yield Stage Ultimate Stage
Pcr (kN) Δcr (mm) Py (kN) Δy (mm) Pu (kN) Δu (mm)
RA 14.39 1.26 29.42 7.91 41.68 21.05
RAC3 16.52 1.41 36.77 9.02 51.48 33.46
RAC5 21.28 3.67 46.58 10.1 66.19 46.81
RAU3 32.94 7.98 51.48 11.42 71.09 53.26
RAU5 36.81 9.23 53.7 10.74 78.45 57.21
RB 28.32 3.68 39.22 8.11 53.93 31.28
RBC3 30.95 4.71 51.48 11.35 61.29 36.23
RBC5 32.17 4.97 53.24 12.41 63.74 56.91
RBU3 33.69 9.35 58.8 12.85 88.25 61.04
RBU5 39.41 11.14 63 12.69 100.51 65.59
RC 30.37 4.45 44.13 10.19 58.84 37.89
RCC3 31.88 3.85 44.73 12.34 66.19 51.42
RCC5 34.14 1.94 53.95 13.95 98.10 55.28
RCU3 34.33 4.41 76.02 15.28 102.81 62.38
The first crack loads were obtained by visual examination. At this stage, the strengthened beams exhibit a maximum increase of 174% compared to the control beams. The yield loads were obtained corresponding to the stage of loading beyond which the load-deflection response was not linear. At the yield load level, the GFRP strengthened beams showed an increase upto 166% compared to the control beams. The ultimate loads were obtained corresponding to the stage of loading beyond which the beam would not sustain additional deformation at the same load intensity. At the ultimate load level, the strengthened beams showed a maximum increase of 170% when compared with the control beams. From the experimental results, it can be observed that, at all load levels, a significant increase in strength was achieved by externally bonded GFRP laminates. This increase may be attributed to the increase in tensile cracking strength of Concrete due to confinement by the laminates. For the A series beams of steel ratio 0.419%, the ultimate load increased by 23.51% and 58.81% for 3mm and 5mm thick CSMGFRP laminated beams. For beams strengthened with 3mm and 5mm thick UDCGFRP laminates, the ultimate load increased by 70.56% and 88.22%. The CSMGFRP strengthened HSC beams exhibited an increase in deflection which varied from 58.95% to 122.38% at ultimate load level. The UDCGFRP strengthened HSC beams exhibited an increase in deflection which varied from 153% to 171% at ultimate load level. For the B series beams of steel ratio 0.628%, the ultimate load increased by 13.65% and 18.19% for 3mm and 5mm thick CSMGFRP laminated beams. For beams strengthened with 3mm and 5mm thick UDCGFRP laminates, the ultimate load increased by 63.64% and 86.37%. The CSMGFRP strengthened HSC beams exhibited an increase in deflection which varied from 15.82% to 170.36% at ultimate load level. The UDCGFRP strengthened HSC beams exhibited an increase in deflection which varied from 189.98% to 211.59% at ultimate load level. For the C series beams of steel ratio 0.905%, the ultimate load increased by 12.49% and 66.72% for 3mm and 5mm thick CSMGFRP laminated beams. For beams strengthened with 3mm and 5mm thick UDCGFRP laminates, the ultimate load increased by 74.72% and 91.40%. The CSMGFRP strengthened HSC beams exhibited an increase in deflection which varied from 144.27% to 162.61% at ultimate load level. The UDCGFRP strengthened HSC beams exhibited an increase in deflection which varied from 196.34% to 208.78% at ultimate load level.
4.2 Ductility of beams
TABLE5Ductility Indices of Tested Beams
Beam Designation
Ductility
Deflection Energy
RA 2.66 4.16
RAC3 3.71 6.82
RAC5 4.63 7.81
RAU3 4.66 7.98
RAU5 5.33 9.27
RB 3.86 6.97
RBC3 3.19 7.58
RBC5 4.59 7.65
RBU3 4.75 7.78
RBU5 5.17 8.80
RC 3.72 6.82
RCC3 4.17 7.86
RCC5 3.96 8.06
RCU3 4.08 7.89
RCU5 4.09 9.32
4.3 Comparison of Experimental Results with FEM Results
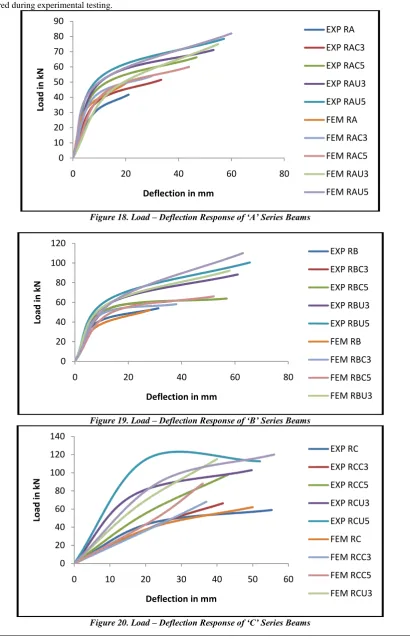
The load - deflection response for tested beams is presented in Figs.18-20. The general behaviour of the finite element models show good agreement with observations and data from the experimental tests. The failure mechanism of a reinforced concrete beam is modeled quite well using FEA and the failure load predicted is very close to the failure load measured during experimental testing.
Figure 18. Load – Deflection Response of ‘A’ Series Beams
Figure 19. Load – Deflection Response of ‘B’ Series Beams
Figure 20. Load – Deflection Response of ‘C’ Series Beams
0 10 20 30 40 50 60 70 80 90
0 20 40 60 80
Load
in
k
N
Deflection in mm
EXP RA EXP RAC3 EXP RAC5 EXP RAU3 EXP RAU5 FEM RA FEM RAC3 FEM RAC5 FEM RAU3 FEM RAU5 0 20 40 60 80 100 120
0 20 40 60 80
Load
in
k
N
Deflection in mm
EXP RB EXP RBC3 EXP RBC5 EXP RBU3 EXP RBU5 FEM RB FEM RBC3 FEM RBC5 FEM RBU3 0 20 40 60 80 100 120 140
0 10 20 30 40 50 60
Load
in
k
N
Deflection in mm
V.
CONCLUSIONS
Based on the experimental results the following conclusions are drawn: Strengthening of HSC beams using GFRP laminates resulted in higher load carrying capacity. The percentage increase in ultimate load varied from 23.51% to 88.22% for GFRP strengthened HSC beams.
The percentage increase in deflection at ultimate stage varied from 15.82 % to 211.59% for HSC beams strengthened with GFRP laminates.
The GFRP strengthened HSC beams show enhanced ductility. The increase in deflection ductility varied from 17.36% to 100.38%.
GFRP strengthened beams failed in flexural mode only.
The general behaviour of the finite element models show good agreement with observations and data from the experimental tests. The failure mechanism of a reinforced concrete beam is modeled quite well using FEA and the failure load predicted is very close to the failure load measured during experimental testing.
REFERENCES
1. ANSYS Manual, Version (10.0).
2. Anthony J.; Wolanski, B.S. Flexural Behavior of Reinforced and Prestressed Concrete Beams Using Finite Element Analysis”, Master’s Thesis, Marquette University, Milwaukee, Wisconsin, 2004.
3. Arduini, M.; Tommaso, D.; A., Nanni, A. Brittle Failure in FRP Plate and Sheet Bonded Beams, ACI Structural Journal, 1997, 94 (4), pp.363-370.
4. Dong-Suk Yang.; Sun-Kyu Park.; Kenneth W.; Flexural behavior of reinforced concrete beams strengthened with prestressed carbon composites, composite part B: engineering , volume 88, Issues 4, pages 497-508,doi:10.1016/j.compstruct.2008.05.016.
5. Hsuan-Teh Hu.; Fu-Ming Lin.; Yih-Yuan Jan, “Nonlinear finite element analysis of reinforced concrete beams strengthened by fiber-reinforced plastics”, Composite Structures 63, 2004, pp 271–281, doi:10.1016/S0263-8223(03)000174-0.
6. Ibrahim, A.M.; Sh.Mahmood, M. Finite element modeling of reinforced concrete beams strengthened with FRP laminates, European Journal of Sci. Research, Euro Journals Publishing, 2009, Inc., 30(4), pp 526541.
7. Kachlakev, D.; Miller, T.; P Yim, S.; Chansawat, K.; Potisuk, T., Finite Element Modeling of Reinforced Concrete Structures Strengthened with FRP Laminates, Oregon Department of Transportation, Research Group, 2001. 8. Pham, H. B., R. Al-Mahaidi and V. Saouma Modeling of CFRP- concrete bond using smeared and discrete cracks,
composite structures, 2006, volume 75, Issues 1-4, pages 145-150, Thirteen International Conference on Composite Structures – ICCS/13doi:10.1016/j.compstruct.2006.04.039.
9. Rabinovitch, O., and Y. Frostig. Experiments and analytical comparison of RC beams strengthened with CFRP composites”, composite part B: engineering, volume 34, Issues 8, 1996, pages 663-677, doi:10.1016/S1359-8368(03)00090-8.