International Journal of Current
Medical and Pharmaceutical
Research
Available Online at http://www.journalcmpr.com
RESEARCH ARTICLE
WHITE BLOOD CELL SEGMENTATION AND MALARIA
Sanjay Nag., NabanitaBasu and Samir Kumar Bandyopadhyay
*Department of Computer Science and Engineering, University of Calcutta
ARTICLE INFO ABSTRACT
Malaria has been recognised as a disease for thousands of years. Descriptions of the disease date from as far back as 1700 BC in China, and 1570 BC in Egypt. The association between malaria and marshes (where mosquitoes breed) has also been long recognised. In fact, the name 'malaria' (from 'bad air' in the marshes) is based on this association. Malaria is an infection of red blood cells caused by a single-celled parasite. Malaria is almost always spread by the bite of an infected female Anopheles mosquito, but also potentially by a transfusion with contaminated blood, or an injection with a needle that was previously used by a person with the infection. Malaria occurs most commonly in tropical areas of the world, such as Africa, Asia, and Central and South America.
Malaria parasitemia is a measurement of the amount of Malaria parasites in the patient's blood and an indicator for the degree of infection. Differential white blood cell (WBC) counts are basic and essential indicators in any type of illness resulting from infection. In malaria, WBC counts are generally characterized as low to normal during treatment. WBC-counts data, before and during treatment with artemisinin derivatives, was gathered for patients with either Plasmodium falciparum or Plasmodium vivax infection. This paper proposed a method for segmentation of WBC components for malaria detection.
Copyright © 2016 Samir Kumar Bandyopadhyay. This is an open access article distributed under the Creative Commons Attribution License, which permits unrestricted use, distribution, and reproduction in any medium, provided the original work is properly cited.
INTRODUCTION
Malaria has been in existence since ancient times and was first described in 4BC, but not until 1889 was the protozoon causing malaria described, and in 1879 female anopheles mosquito was demonstrated to be the vector for the disease. Malaria is an infectious disease caused by the protozoa plasmodium species, it is usually transmitted from one person to another through the bite of an infected female anopheles mosquito, while taking blood meal, thus the female anopheles mosquito acts as the vector . The levels of endemicity of malaria vary from country to country.
White blood cells (WBCs) are one of the numbers of different cells that play a part in the body's defenses and give immunity against disease. Their numbers may be reduced (leucopenia) by starvation, pernicious anemia, and certain infections, such as typhoid and malaria. An increase in their numbers (leucocytosis) is a reaction to normal events such as digestion, exertion, and pregnancy, and to abnormal ones such as loss of blood, cancer, and most infections. WBC counts during malaria are generally characterized as being low to normal, a phenomenon that is widely thought to reflect localization of leukocytes away from the peripheral circulation and to the spleen and other marginal pools, rather than actual depletion or stasis. Leukocytosis is typically reported in a fraction of cases
and may be associated with concurrent infections and/or poor prognosis. Remarkably, few published studies have compared actual and standard WBC counts in malaria parasite-infected people in endemic areas. Although several methods for estimation of densities of blood-stage parasites by microscopy are in use, the most common is to count the number of asexual parasites seen relative to a given count of WBCs (usually 200 or 500 cells) and then to multiply the parasite: WBC ratio by 8000, the assumed number of WBCs per microliter of blood. This assumed standard value; most often does not give the true value instead, it under or overestimates it.
WBC counts in acute P. falciparum and P. vivax malaria are significantly lower than previously assumed for estimating malaria-parasite density. However, these abnormalities returned to normal within several weeks after artemisinin-derivative-based treatment.
There are four species of the parasite that cause malaria: Plasmodium vivax, Plasmodium ovale, Plasmodium falciparum, and Plasmodium malariae. The life cycle of the malaria parasite begins when a female mosquito bites a person with malaria.
Human blood is composed of liquid cellular component namely erythrocytes, Leucocytes and the thrombocytic each of
Key words:
Plasmodium, malaria, diagnosis, method
Article History:
Received 06th December, 2015
Received in revised form 14th
December, 2015
Accepted 23rd January, 2016
these cells perform a particular function in the human physiology. In health, those cells are adequately produced to a particular range for the sex and age of the individual. In disease there have been records of alteration in the production of the cells and the rate of function they perform. Differential count determines the relative percentage of each type of white cell count as the white cells are made up o five different cells namely neutrophil, lymphocytes, Eosinophil, Monocytes and Basophils. The white cells are the first line of defense in different disease and the percentage of which they appear in different count would give an insight of the kind of infection one may be suffering from. For instance, there have been records of neutrophilia in bacterial infection and neutropenia in other non bacterial related disease: Lymphocytosis, some viral infections and parasitic infection.
The mosquito ingests blood containing malarial parasites, which reproduce in the mosquito's gastro-intestinal tract, and then move to the salivary glands. When the mosquito bites another person, the parasites are injected along with the mosquito's saliva. Inside the human, the parasites move to the liver, where they multiply. They mature over an average of 2 to 4 weeks, then leave the liver and enter the blood stream. The parasites infect red blood cells, multiply inside the red blood cells and eventually cause the infected cells to rupture.
Plasmodium vivax, ovale and falciparum usually cause the red cells to rupture every 48 hours, and P. malariae cause ruptures every 72 hours. The parasites released from the ruptured red blood cells go and infect more red blood cells, setting up the cycle once more. Occasionally, sexual forms of the parasites (called gametocytes) develop in the blood. These are the forms that reproduce in the mosquito if they are ingested.
P. ovale and P. vivax parasites preferentially infect young red blood cells, while P. malariae prefers to infect older red blood cells. For this reason the number of parasites in the blood is limited if one contracts any of these three forms of malaria. P. falciparum can infect red blood cells of any age, which means infection with this form of malaria results in a much higher number of parasites in the bloodstream.
Some of the liver stages of Plasmodium vivax and Plasmodium ovale can remain dormant in the liver. Periodically, mature parasites will be released into the bloodstream, causing recurrent attacks of malaria. Plasmodium falciparum and Plasmodium malariae do not remain dormant in the liver. However, if the infection is untreated or inadequately treated, the mature form of Plasmodium falciparum may persist in the bloodstream for months, and the mature form of Plasmodium malariae may remain in the bloodstream for years. This causes repeated attacks of malarial symptoms. In Africa the predominant strain is Plasmodium falciparum, which has a very high mortality rate.
The first symptoms are usually very similar to 'flu - aches and pains, fever, headache and so on. After a few days, the typical paroxysms may occur - chills, followed firstly by a high fever for a few hours, and then by profuse sweating. Between these paroxysms, the patient may feel well, depending on the type of malaria that has been contracted. Some forms of malaria are more severe than others, and the time between the paroxysms differs, depending on the type of malaria. Malaria should be
suspected in anybody with these sorts of symptoms who has been to a malaria area.
The incubation period (the time between being bitten by the mosquito and developing symptoms) is variable - usually between 2 and 3 weeks. However, in some cases it may take months for the disease to manifest itself. The initial symptoms are often similar to those of influenza:
an intermittent mild fever
headache
muscle aches and chills
a general feeling of illness (malaise).
After a few days (three to five) the typical malarial paroxysms start. These are usually characterised by chills, followed by fever (up to 40 degrees Celsius), and then sweating. The paroxysms normally last about 8 to 10 hours. In between paroxysms patients often feel remarkably well. In vivax and ovale malaria the paroxysms typically recur every 48 hours, while in malariae malaria, the paroxysms recur every 72 hours. The paroxysms occur at about the same time that the red blood cells burst and release more parasites, and this explains the 48 or 72 hour cycle (see previous section 'The parasite'). Eventually, the body will eliminate the parasites from the blood, and the paroxysms will get less and less severe and disappear. Symptoms usually begin 10 to 35 days after a mosquito injects the parasite into a person. Again, there are initial 'prodromal' symptoms, followed by the malarial paroxysms. However, unlike the other forms of malaria, the paroxysms are not usually as regular, and patients often have a fever between paroxysms.
Although P. falciparum also causes rupture of the red cells every 48 hours, the timing is not as well co-ordinated as with the other forms of malaria, hence the less well delineated paroxysms. In addition, there are usually more parasites in the blood with falciparum malaria than with the other forms, which is one of the reasons that falciparum malaria is more severe than the other forms. Malaria caused by Plasmodium falciparum is the most severe form of malaria. The most important, and potentially life threatening complication is cerebral malaria. Symptoms of cerebral malaria include:
high fever
severe headache
drowsiness
delirium and confusion.
Cerebral malaria can be fatal. It most commonly occurs in infants, pregnant women, and travellers to high-risk areas.
Malaria Should Be Suspected In The Following
Circumstances
when a person has periodic attacks of chills and fever with no apparent cause
if within the previous year the person had visited an area where malaria is prevalent. Any person who has a fever and who has been to a malaria area recently should be screened for malaria.
if the spleen is enlarged, or there is jaundice or anaemia without an obvious cause.
examined under a microscope. More than one sample may be needed to make the diagnosis because the level of parasites in the blood varies over time. The laboratory will (whenever possible) identify the species of Plasmodium, because the treatment, complications, and prognosis vary depending on the species involved.
Recently, new diagnostic tests have become available. The most commonly used of these is a test that detects one of the malarial proteins in the blood. The advantage of this test is that it can be done in clinics with relatively little training. However, it is probably not as sensitive as the examination of smears, and it cannot identify the different forms of malaria. Although measuring WBC counts in malaria is important for estimation of blood-stage parasite densities by microscopy, it is also relevant to the identification of the possible mechanisms underlying these hematological abnormalities. White blood cell (WBC) counts during malaria are generally characterized as being low to normal, a phenomenon that is widely thought to reflect localization of leukocytes away from the peripheral circulation and to the spleen and other marginal pools, rather than actual depletion or stasis. Leukocytosis is typically reported in a fraction of cases and may be associated with concurrent infections and/or poor prognosis. Remarkably few published studies have compared WBC counts in malaria parasite–infected and –uninfected residents of regions in which malaria is endemic, however.
Human malaria can be caused by any of several species of
Plasmodium parasites that occur together in various
combinations in regions of endemicity. P. falciparum is responsible for almost all mortality attributed directly to malaria and is the focus of almost all research and intervention efforts. Compared with P. falciparum, however, P. vivax is the source of as much or more morbidity worldwide, despite its extremely low prevalence in sub-Saharan Africa. The tacit assumption that WBC counts are identical during infections with different Plasmodium species has been examined only minimally and tangentially.
Review Works
Automated detection of the abnormalities in medical images is an important and sometimes necessary procedure in medical diagnostics, planning, and treatment [1]. The recognition accuracy largely depends on subjective factors like experience and fatigue due to human tiredness. With the increasing demand for more number of such examinations along with the need for quality results, there arose a necessity for the automation of the whole process.
This not only reduced the burden on haematologists but also yielded accurate results in significantly short period of time. An automated diagnosis system will alleviate the workload and the influence of subjective factors. Automated detection involves removal of red blood cells and platelets from the background. A standard image binarization technique, namely, Otsu [2] Image binarization is a very important step in image processing and pattern recognition applications, previously, most proposed methods followed the traditional manual makeover, i.e., detecting a cell, extracting its features, classifying the cell, and then updating the count [3-6]. Even though several attempts have been made to solve the blood cell counting, they are applied to peripheral blood only.
WBC is much more difficult due to the high density of cells. A projected structure for segmenting white blood cells is used by means of incorporation of concepts in digital image processing [7]. The nucleus segmentation part measurement is based upon morphological analysis and the cytoplasm segmentation is based on pixel strength threshold. In the case of edge detection we apply several different type of edge detection technique for blood cell boundaries have been extraction one of them is canny edge detection [8] by using this technique, edges taking place in the images would not be missed and there would be no responses to non-edges.
PROPOSED METHOD
Morphologic operations are especially suited to the processing of binary images and greyscale images. In the basis of morphological operation we can determine contour and segment of the nucleus.
Algorithm
Input: A color sample (blood) image.
Output: Contour and segmented WBC elements image.
Step 1: Converts input colour image in to grayscale image
which is done by forming a weighted sum of each three (RGB) component, eliminating the saturation and hue information while retaining the luminance and the image returns a grayscale colour map.
Step 2: Calculate the size of the matrix which returns the
number of rows and columns in separate output variables x and y.
Step3: Converts grayscale image data matrix into a double
precision array, which store in d. Step 4: Multiply a matrix which returns x-by-y matrix containing pseudorandom value, the size x, y is nonnegative integers (negative integers can be treated as 0) with square root of a constant and return to T, calculate r = d + T.
Step 5: For i = 1 to x do
Step 6: For i = 1 to y do
Step 7: If (r(i,j) > 255) then
Step 8: r (i,j) = 255
Step 9: End If
Step 10: If ( r(i,j) < 0 ) then
Step 11: r ( i,j ) = 0
Step 12: End If
Step 13: End For
Step 14: End For
Step 15: Calculate max and min value of r into m1 and m2,
average a = (m1+m2)/2 .
Step 16: Initialize q1=s1=q2=s2=p=counter=0, cut = 0.5.
Step 17: Returns an absolute value corresponding to the (a-p)
and store it to the variable z.
Step 18: If (z >= cut) then
Step 19: counter=counter + 1
Step 20: For i=1 to x do
Step 21: For j=1to y do
Step 22: If (r(i,j) >= a)then
Step 23: q1=q1 + r(i,j)
Step 24: s1=s1+ 1
Step 25: End If
Step 26: If (r(i,j) < a)
Step 27: q2=q2+r(i,j)
Step 28: s2=s2 + 1
Step 30: End For
Step 31: End For
Step 32: Set the variable b1 = (q1 / s1), b2 = (q2 / s2), p = ((b1 + b2) / 2).
Step 33: Repeat step 17 and set a=p.
Step 34: End If
Step 35: Initialize all element of a matrix zero store it into R.
Step 36: For i =1 to x do
Step 37: For j=1 to y do
Step 38: If(r(i,j) >= a)
Step 39: R (i,j) = 1
Step 40: End If
Step 41: End For
Step 42: End For
Step 43: Reverse the matrix element by c = (1 - R).
Step 44: After converting binary image show more intensity
and more area by creates a flat, disk-shaped structuring element, where radius nonnegative integer parameter by strel command.
Step 45: Erodes the grayscale binary, or packed binary image,
returning the eroded image from step44 function by imerode command.
Step 46: Removes from a binary image(step45) all connected
components (objects) that have fewer than P pixels, producing another binary image This are done by the determination of connected components, computation the area of each components, removal small objects then get the ultimate output image.
This study is focusing on WBC segmentation and detection using microscopic images by the digital microscope. So our main goal is to identify by contour wise WBCs elements and segment and detect each component of WBC and nucleuses andcytoplasm which has developed by means of digital image processing. The intention of the current learning is to build up an automatic tool which can identify, detect, segment and classify the white blood cells namely, lymphocytes, monocytes, basophil, eosinophil and neutrophil in digital microscopic images. Segmenting and classifying WBC was shown to be a difficult task due to various reasons including cell touching, close cell/background intensities. In many of the researches presented in literature automatic cell segmentation was avoided to decouple the error due to segmentation with that of classification have done manual segmentation for all the acquired images to individually get WBC.
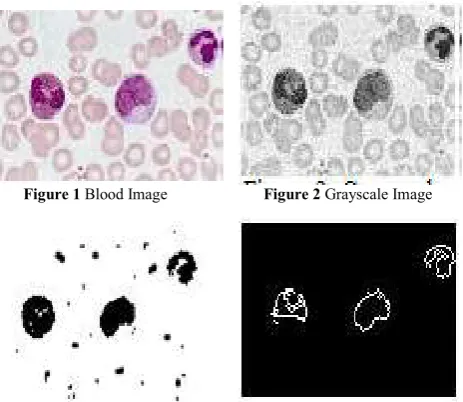
The part of the (WBC) images that has the white blood cells element has more intensity than that of other portion of image, other things is that highest intensity area is the nucleus and we can make our assumptions about the type of the white blood cells, these are the basic things which we considered. Different type white blood cell has different type of nucleus with different type of lobe, detecting contour and segmenting there nucleus we can determine each element of the WBC. A sample smear image is shown in figure 1 and a grayscale conversion of original image is shown in figure 2 which is due to the noise reduction from image. Figure 3 shows the threshold segmentation from grayscale image and also it is a technique to covert binary image which helps us applying morphological operation.
Applying morphological operation we get contour of blood elements imageis actually done by less strel value, disk type of strel is apply here and output is shown in figure 4. If we compare with the canny edge detection technique our algorithms give better result because canny shows all edges of blood cell element but our goal is to detect only WBC elements though some red and platelet are detected in our algorithms but overall consideration our algorithms for edge detection of WBC elements give better result. Small area remove strategy is due to the extraction of only white blood cells.
Contour of WBC elements without any other blood element is shown in figure 7.we can detect white blood cells from this contour because different WBC element has different type of lob or nucleus. For segmentation we extract nucleus from its each element. Some Other Result for Different Input Blood Images. The median values of haematological parameters of falciparum malaria, vivax malaria and non-malaria infected group were compared using Kruskal-Wallis Test due to non-parametric distribution of data. Median values of RBCs, platelets, WBCs, and all absolute leukocyte components counts were significantly lower in patients with falciparum malaria compared to those with vivax malaria and non-malaria infected groups.
CONCLUSIONS
The proposed method is more reliable, computationally less expensive and the proposed algorithms are better to detect the cells. Limitations of this study included lack of previous medical histories such as other diseases that may have analysis bias such as Hb diseases, anaemia, bacteria or virus infection, which could potentially affect the interpretation of the results.It is important that the actual WBC counts are used especially when conducting drug therapeutic efficacy studies in other to get the true picture of the efficacy of malaria drugs.
References
1. Ritter N and Cooper J (2007) “Segmentation and border identification of cells in images of peripheral blood smear slides”, In Proceedings of the Thirtieth Australasian Conference on Computer Science 62:161– 169
2. Otsu, N., "A Threshold Selection Method from Gray-Level Histograms," IEEE Transactions on Systems, Man, and Cybernetics, Vol. 9, No. 1, 1979, pp. 62-66. 3. M. Beksac, M. S. Beksac, V. B. Tipi, H. A.Duru, M. U.
Figure 1 Blood Image Figure 2 Grayscale Image
Karakas, and A. N. Cakar, “An Artificial Intelligent Diagnostic System on Differential Recognition of Hematopoietic Cells From Microscopic Images,” Cytometry, vol. 30, pp. 145-150, 1997.
4. H. Harms, H. Aus, M. Haucke, and U. Gunzer, “Segmentation of Stained Blood Cell Images Measured at High Scanning Density with High Magnification and High Numerical Aperture Optics,” Cytometry, vol. 7, pp. 522-531, 1986.
5. J. Park, and J. Keller, “Fuzzy Patch Label Relaxation in Bone Marrow Cell Segmentation,” IEEE Intl Conf on Syst, Man, Cybern, pp. 1133-1138, Orlando, FL, 1997. 6. S. S. S. Poon, R. K. Ward, and B. Palcic, “Automated
Image Detection and Segmentation in Blood Smears,” Cytometry, vol. 13, pp. 766- 774, 1992