Impact Of Outsourcing In Some State University Libraries Of
Lucknow: A Study
Mitali Saini
Dr. M.P. Singh
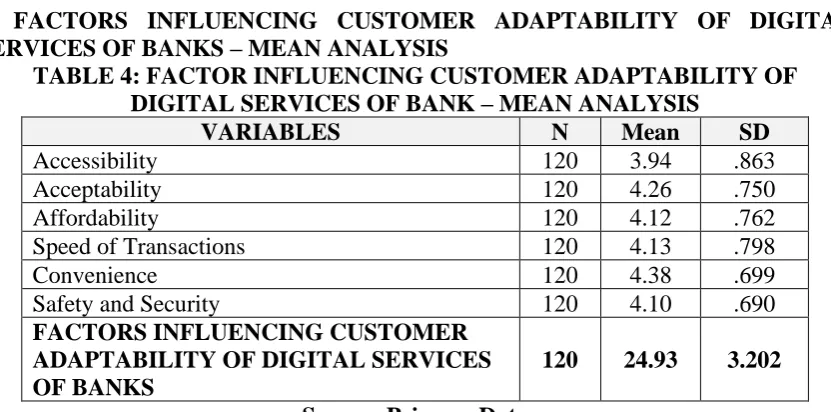
Abstract
This paper aims to provide a brief account of the impact of library outsourcing. It is an attempt to conceptualize the outsourcing approaches to library and information centers, discussing the role of outsourcing. The present study discussed the many reasons for outsourcing, areas of outsourcing implementation, impact of outsourcing in university library. The current study is arranged in some state university libraries of Lucknow to observe the impact of outsourcing on library activities and services.
Keyword: Outsourcing, Modernization, Impact
Introduction
Outsourcing was also traditionally used in libraries long ago. It's not a new library concept. Outsourcing also lends itself nicely to more routine and traditional technical services operations, changes, library work reengineering. Using outsourcing is not bad; advancing library work is very good, but the critics criticize the work's outsourcing or privatization. Outsourcing is how something can be changed and something new created. It can be a positive way to boost productivity as well as an opportunity for personal growth as well as organizational improvement. Outsourcing offers multiple opportunities with special external suppliers to reduce costs and capitalize on investments. From this point of view, librarians should use the external resources to implement strategy methods to achieve goals. Outsourcing is viewed as a way for libraries to provide internally unavailable capabilities. Outsourcing is defined as using private rather than in - house library staff services to perform an activity without the routine work being blocked. These works are data feeding, networking, computing, automation, maintenance, electrification and digitization and so on. Today librarians use outsourcing to compile their work to develop or re-engineer library work without disturbing routine day-to-day work. It is clear from recent experience that outsourcing is a solution to challenges. It is also clear that outsourcing of libraries will not also diminish its importance in the future.
Outsourcing involves transferring certain work-related tasks involving recurring internal activities that are not core to the library's mission to a third party, or outside vendor, or contractor, or independent workers, or provider. Issues of outsourcing require consent to use terms and definitions.
Indian libraries began using ICT for automation, RFID, digitization, database creation, internet - based services, e - resource utilization and creation, etc. So, now they're taking outsourcing help to improve service quality and quantity.
M.Phil Scholar, Department of Library & Information Science, Babasaheb Bhimrao Ambedkar University Lucknow- 226025
Concept
The term Outsourcing is a combination of three terms “outside”, “resource”, “using”, which means going outside the organization to use the resources of others. Outsourcing is a name of contracting which means privatization or outsides because in this persons or organization provides service on contractual basis and it is interchangeable. Outsourcing is a strategy in which an organization contract with services provider and vendor to complete the tasks. In simple words, outsourcing is to assign a task to an outsider (means a seller / organization / person). In simple term, this takes just a contract transaction under which an organization takes services from a vendor while maintaining ownership and responsibility for underlying processes. Organizations clearly mention in the contract what they want and how they want the work done by the seller.
According to Horngren, Charles T. et al. (2009) “Outsourcing is the process of purchasing goods and services from outside vendors rather than producing the same goods or services within the organization, which is called in sourcing.”
Wagner (1992) stated “outsourcing is the transfer of an internal service or function to an
outside vendor.”
Significance Of The Study
The present study is conducted to determine the impact of outsourcing in college libraries on activities and services. Outsourcing today is very useful for changing the traditional to modern role of our own. Modern services ' technical changes and work may not be capable of appointing or acquiring all skilled staff for each job and acquiring all services internally. External services are therefore important for solving the problem and completing the work. After careful review of the existing literature, it was found that libraries tend to outsource their various activities and services to cope with shrinking budgets, lack of adequate or trained manpower, cope with current technology and improve user services, etc. Several authors have suggested from time to time that further research on outsourcing practices in libraries is needed.
Due to some reasons, libraries used outsourcing as follows:
• Required due to lack of skilled staff.
• Helps to enhance the library services.
• Helps to introduce new value added services.
• Acquire new ideas and technology easily.
• Better to cope up shrinking budget.
• Increase the quantity of product and services.
• Enhance the standardization.
• Concentrate on core activities and services.
• Became a trend for library modernization.
All of the above reasons for outsourcing are important and beneficial. The library and knowledge management institutions are also concerned with promoting the services through the use of outsourcing.
Objectives Of The Study
• To know the role of outsourcing in the state university libraries of Lucknow.
• To find out the reasons for using outsourcing in libraries.
• Area of implementation of outsourcing in libraries.
Scope Of The Study
The study is conducted to know the impact of outsourcing in some university libraries of Lucknow. The present study is includes two State University Libraries of Lucknow namely, Shakuntala Misra National Rehabilitation University and Khawaja Moinuddin Chisti Urdu, Arabi- Farsi University. A part from this none university is selected for the study.
Research Methodology
The survey method was used to find out the goal - related answers for the study. . The questionnaire and interview tool was used to collect data from the library staff. An observation is used by the researcher in order to collect empirical data. The data are arranged in a tabular form and analyzed it in a descriptive way. Total 8 questionnaires were distributed and 8 received.
Data Analysis And Interpretation
This research work aims at analyzing the impact of outsourcing library activities and services in State University Libraries of Lucknow. The analysis presented in the following sections is based on the response/feedback provided by the staff of the library. The data is integrated and analyzed in different parts to achieve more meaningful and realistic results.
Status of distributed questionnaire of library staff
S. No.
Selected libraries
of State
University
Questionnai re
distributed Responses
Total responses in Percentage (%)
1 S.M.N.R.U. 4 4 50%
2 K.M.C.U.A.F.U. 4 4 50%
Total 8 8 100%
Table-1
It can be observed from Table -1 that out of 8respondent, 4(50%) received form Shakuntala Misra National Rehabilitation University (S.M.N.R.U.), 4(50%) from Khawaja Moinuddin Chisti Urdu, Arabi-Farsi University (K.M.C.U.A.F.U.).
Qualifications of Staff
Table – 2
Table- 2 presented shortage of qualified library staffs only 1(100%) library staff of S.M.N.R.U. and another 1(100%) of K.M.C.U.A.F.U. having MLIS degree, but there is no library staff having BLIS, M.PHIL and PHD degree in LIS.
Nature of job
Nature of job S.M.N.R.U. K.M.C.U.A.F.U Total
Permanent - - -
Temporary 4(100%) 1(25%) 5(62.5%)
Ad-hoc - 3(75%) 3(37.5%)
Total 4 4 8(100%)
Table-3
S. No. Qualification S.M.N.R.U K.M.C.U.A.F.U.
1 BLIS - -
2 MLIS 1(100%) 1(100%)
3 M.PHIL in LIS - -
Table- 3 shows that there is none of permanent staff in selected libraries which shows government has least interest to appointing the staff, there are only 5 (62.5%) temporary and 3(37.5%) respondents are ad-hoc based.
Area outsourcing is implemented
Area Implemented YES NO
Acquisition Section 8(100%) - Technical Section 8(100%) - Circulation Section 8(100%) - Periodicals Section 8(100%) - Reference Section 8(100%) - IT Section 8(100%) - Stack Section 8(100%) -
Table-4
Table- 4 reveals that 8(100%) libraries have implemented outsourcing in their library like Acquisition Section, Technical Section, Circulation Section, Periodical Section, Reference Section, IT Section, and Stack Section.
Library staff opinion of preference for adopting outsourcing
Reasons N %
Utilization of ICT 7 (87.5%)
Technical works done efficiently 4 (50%) Professional activities and services 4 (50%) Non-Professional activities and services 7 (87.5%) helps staff on core activities and services 7 (87.5%) Shortage of permanent staff 6 (75%)
Table- 5
Table- 5 shows various reasons given by library staff for adopting outsourcing. 7 (87.5%) respondents mentioned the top reason ‘Utilization of ICT’, Non-Professional activities and services and ‘Helps staff on core activities and services’, ‘Shortage of permanent staff’ second reason by 6(75%) followed by 4 (50%) for ‘Technical work done efficiently’ and ‘Professional activities and services are last reasons.
Opinion regarding outsourcing became a trend in library Outsourcing became trend Responses Percentage
Yes 8 100%
No - -
Table-6
Table-6 shows that 100% respondents agreed that outsourcing became a trend in the library.
Activities and Services
Useful Professional
Non-Professional
Manual Automated
No. % No. % No. %
Yes 3 100% 8 100% 1 50%
No - - - - 1 50%
Total 3 8 100% 2 100%
Table7
Table -7 shows that 100% library staff agreed that outsourcing is helpful for Professional- manual and automated activities and services. However 50% agreed that outsourcing is also useful for non-professional activities and 50% disagree.
Staff opinion regarding outsourcing plays an important role in adopting new technology
Plays an important role in adopting new technology responses Percentage
Yes 7 87.5%
No 1 12.5%
Table- 8
Table- 8 shows that 7(87.5%) respondents agreed and 1(12.5%) respondents disagree that outsourcing plays an important role in adopting new technology.
Opinion about outsourcing
Strongly Agree = SA, Agree = A, Neutral = N, Disagree = D, Strongly Disagree = SD
STATEMENT SA A N D SD
Helps to enhance the
library services. 3(37.5%) 2(25%) 3(37.5%) Required due to lack of
skilled staff. 2(25%) 3(37.5%) 2(25%) 1(12.5%) Became a trend for library
modernization. 3(37.5%) 2(25%) 2(25%) 1(12.5%) Helps to introduce new
value add services. 1(12.5%) 5(62.5%) 1(12.5%) 1(12.5%) Helps to provide better
services. 2(25%) 1(12.5%) 3(37.5%) 1(12.5%) 1(12.5%) Helps to acquire new ideas
and technology easily. 4(50%) 3(37.5%) 1(12.5%) Better to cope up
shrinking budget 2(25%) 4(50%) 2(25%) Increase the quantity of
library product and
services 1(12.5%) 4(50%) 3(37.5%) Improves the reputation of
library 2(25%) 3(37.5%) 2(25%) 1(12.5%) Reduce expenses 4(50%) 2(25%) 2(25%)
Table- 9 shows that the majority of respondents 3(37.5%) are strongly agreed that outsourcing helps to enhance the library services, 3(37.5%) feel that outsourcing is required due to lack of skilled staff, 3(37.5%) strongly agreed that outsourcing became a trend for library modernization, 5(62.5%) are neutral to response that outsourcing helps library to introduce new value added services, followed by 3(37.5%) that it helps to provide better services. 4(50%) respondents strongly agreed that outsourcing helps to acquire new ideas and technology easily. 4(50%) respondents are neutral to response that it is better to cope up shrinking budget. Outsourcing increases the quantity of library product and services, 4(50%) respondents agreed with this statement, followed by 3(37.5%) that it improves the reputation of library. 4(50%) respondents strongly agreed that outsourcing reduce expenses.
Opinion regarding outsourcing in comparison to In-house
Less Expensive 8(100%) Or More Expensive - Time Saving 8(100%) Or Time Consuming - More Useful 8(100%) Or Less Useful - Easy to adopt new
technology
7(87.5%) Or Difficult to adopt new
technology 1(12.5%) Enhances the
standardization
7(87.5%) Or Fear to decline library
reputation 1(12.5%) Increases the quantity of
product & services
6(75%) Or Reduces the quantity
of product & services 2(25%) Increases the quality
product & services
8(100%) Or Decrease the quality of
product & services - Improves the staff skills &
attitude
5(62.5%) Or Reduces staff morale
3(37.5%) Preferred to cope up with
staff shortage
4(50%) Or Less preferred due to
lose the control 4(50%)
Table - 10
Table – 10 According to 8(100%) respondents outsourcing is less expensive, followed by 8(100%) for time saving, 8(100%) for more useful, 7(87.5%) for easy to adopt new technology, but 1(12.5%) feel it is difficult to adopt new technology, followed by 7(87.5%) for enhance the standardization and 1(12.5%) for fear to decline library reputation, 6(75%) respondents agreed that outsourcing increase the quantity of product and services, but 2(25%) feel that it reduces the quantity of product and services. 8(100%) respondents agreed that outsourcing increase the quality of product and services. According to 5(62.5%) respondents outsourcing improves the staff skills and attitude but 3(37.5%) it reduces staff morale. 4(50%) respondents preferred outsourcing to cope up with staff shortage and another 4(50%) less preferred due to lose the control.
Findings
• All selected libraries have used outsourcing for providing services of libraries.
• Most of the library staff 5(62.5%) are temporary and 3(37.5%) are ad-hoc based.
• Only 1(100%) MLIS staff has qualification in Library and Information Science. This study is found that there is lack of LIS qualified staff.
• Total 8(100%) respondents mentioned that outsourcing is implemented in all section of the library i.e. acquisition section, technical section, circulation section, periodicals section, reference section, IT section, stack section.
• Total 7 (87.5%) respondents stated that the top reasons to prefer for adopting outsourcing due to utilization of ICT, non-professional activities and services and helps staff on core activities and services. 6(75%) respondents have reported to prefer outsourcing because of shortage of permanent staff and 4(50%) respondents have preferred outsourcing for technical work done efficiently.
• In opinion of 100% respondents outsourcing became a trend in library.
• In professional activities 3(37.5%) respondents stated that outsourcing is useful for manual services and 8(100%) respondents reported that it is useful for automated services.
• Only 1(12.5%) respondents stated that outsourcing is useful for non- professional activities and 1(12%) respondents feel it is not useful for non-professional activities.
• In opinion of 7(87.5%) respondents outsourcing plays an important role in adopting new technology but 1(12.5%) respondents not agreed with this statement.
• According to 8(100%) respondents outsourcing is less expensive, time saving and more useful for library.
Conclusion
References
ALA Outsourcing Task Force,1999. Outsourcing and privatization in American libraries
pp24-26
Ali, S. and Khan, S.U.(2014) Software Outsourcing Partnership(SOP): A Systematic Literature Review Protocol with Preliminary Results.International Journal of Hybrid InformationTechnology,7,(4) pp.377-392
Carmen,W.(2009).The impact of outsourcing new technologies on integrative capabilities and performance.Strategic Management Journal,30(6).
Connie,L.(2012).A case study of BYU’s arabic collection.Middle East Librarians Association,pp.1-13.
Elsayed,A.M.(2015).Outsourcing digitization projects in saudi Arabia:An overview of current practices.Library Collection, Acquisition &Technical Services.38(1-2)
Kumbhar,K.N. & Binve,H.(2016).Use of outsourcing in college libraries. International
Journal of Research in Library Science,2(2).
Moutusi,B.& Sanku,B.K.(2013).Impact of outsourcing on library Activities:A Bird’s Eye View. International Journal of Research in Library Science,7(3).
Muhammad, M.U., Yusuf, D. & Joshua, A.J.(2018).Outsourcing library services for effective library management. Global Journal of Applied, Management and Social Sciences.15 pp 227 – 231.
Mwai, N., Kiplang’at, J. & Gichoya, D.(2016).Outsourcing information communication technology services in selected public university libraries in Kenya. Inkanyiso,Jnl Hum & Soc Sci 8(1).
Shailesh,B.V.(2013).An empirical study of uses of outsourcing in library activities and services. Global Research Analysis,2(7).
Jammu and Kashmir Economy: Illustrative Case Study of
Agricultural Exports in the State
Yasar Mehmood
Mohd Abdullah
Abstract
Jammu and Kashmir economy is an informal economy which feeds most of its population, agriculture is the backbone of the economy, like Horticulture (apple production, in the state 1.73 million tons in 2016-17. Walnut as the major exporter whose share is 7% at international market. The current GSDP of J&K grew at 14.9% to reach $22.64 billion in 2016-17, besides agriculture, we are also having rich power projects with capacity of 3297.28 megawatt comprises 1733.43 megawatt comes under the utilization of central government economy is predominately depends upon agriculture and allied activities. The Kashmir valley is known for its sericulture and cold-water fishers. Wood from Kashmir is used to make high quality cricket bats popularly known as Kashmiri willow. Kashmir saffron is very famous and brings the state a handsome amount of foreign exchange.
Agriculture exports from J&K includes Apples barley, cherries, corn, millet, rice, orange, peaches, pears, saffron, sorghum, vegetables and wheat while manufacturing exports including handicrafts, rugs and shawls. Horticulture play a Vitol role in the economic development of the state with annual turnover of over RS 3 billion and the biggest source of income for the state economy. this paper will try to analyse agriculture production in JK state with respect to agriculture export and also to examine the trend line analyses of agriculture exports from 2000 0 to 2016. The findings of the paper show that agriculture in the state is providing job opportunities and generates other sources of business in the economy.
Keywords: Agriculture, Horticulture, Jammu And Kashmir Economy, Exports,
Introduction
Kashmir is popularly known as the paradise on earth and has been famous in handicrafts sector since ages. The handicrafts and handlooms of the state is world known, and exports its product in the national as well as in the international market. Central Kashmir (heart of Kashmir) including Srinagar, Badgam and Ganderbal is the hub for this sector. But unfortunately, Jammu and Kashmir has not been able to attract investment in private sector, and has remained an industrially backward state due to its unique economic and political obstacles arising out of remoteness and poor connectivity, hilly and inhospitable terrain, poor infrastructure, sparse population density, shallow market and most important political and law and order situation threatened by militancy. Besides all these hurdles and obstacles Kashmir is very famous in handicrafts, horticulture, agriculture and allied activities,
Handicraft has remained a key economic activity in the state of Kashmir valley. Kashmir has also a great contribution towards export from the handicraft sector. It is mainly labour
intensive and hence causes no harm to economy, besides providing employment to literate as well as illiterate persons in both rural and urban area it acts as a subsidiary source for the farmers who remained unemployed during the off season. Government also plays a great role for the upliftment of this sector by providing various schemes. Carpet and shawl occupy the most important and prominent place on the production front in Kashmir. Both males and females are dependent on this sector in the valley. Carpet, shawls, silver ware, paper Mashie, Guba making, wood craving, Namda and so on are the major crafts used in the valley of Kashmir and thus contributes heavily towards the exports of state. The handicrafts, agriculture and tourism sector act as a source of income, employment and value generation.
Literature Review
1. Shah M Rafiq in 2016. Since for a longer time Kashmir remains the hub of handicrafts but, unfortunately due to its economic, political obstacle, industrial backwardness, inhospitable, hilly terrain and remoteness it cannot attract private investment handicraft sector remained key role to Economic growth and the major exporter of Handicrafts articles. In the international market as well and the main factor of economic growth, generate employment, raise per capita income and contributes to Gross State Domestic Product (GSDP) and National Income (NI).
2. Bakari Sayef, Mabrouki Mohamed, in 2017. The analysis of the paper shows that there
is a strong relationship between the evidence of bidirectional causality from export to economic growth and strong causality to import and economic growth and these exports and imports contributes a large towards economic growth.
3. Nengroo A. Hussain1, Bhatt G. Mohammad2, Khaki A. Rashid3.The agriculture,
horticulture, handicrafts and tourism are the most important source of revenue generation, income, employment and great contribution towards economic growth and development and contributes.
4. Kannan, E., & Sundaram, S, (2011), Cropping pattern in India has undergone a significant change as there is a continues shifts from food grains / cereals crops to commercial crop the output and yield under the cereal’s crops decline during the reference period. Modern techniques like, irrigation and fertilizers have increased the productivity of food grains at a considerable level.
5. Malik, Z. A., & Choure, T. (2014), Horticulture industry occupy a significant place in agriculture but, due to mismanagement and defective the implementation of National Horticulture Mission does not show effective results and yields per hectare decline the overall productivity of apples declines as compared to others states.
6. Limbore, N. V., & Khillare, S. K. (2015), India being a rich producer and exporter of agricultural products, yet this sector is prone with various defects and risks which effects which effects both the consumers and producers as well. In order to enhance investment and to achive a sustain agricultural production the long-term policy / initiatives should needs to enhance in order to reduce the risk and flexibility among rural producers should be enhanced.
Objectives of the paper
The objectives of the paper are as under
1. To examine the agriculture and handicrafts production in J&K state.
Methodology
This paper is based on secondary data, which has been collected from Statistical digest of J&K, Economic survey of J&K 2014-15, 2016-17. We have used descriptive statistics to analyses the production process of various food grains and horticulture products. The figures have been shown by using histogram and trends line far each of the food grains and horticulture items.
Table 1.1Agriculture production of food grains (qtls)
S. No Year Rice Maize Wheat Others cereals
Pulses Total food grains
1 2 3 4 5 6 7 8
1 2000-01 4153 5258 1487 170 128 11196 2 2001-02 4223 5381 3430 198 125 13357 3 2002-03 4214 4651 4055 203 142 13265 4 2003-04 5048 5326 4595 225 132 15325 5 2004-05 4928 4922 4782 243 152 15027 6 2005-06 5574 4535 4575 201 135 15020 7 2006-07 5546 4869 4983 238 141 15777 8 2007-08 5620 4745 4559 230 153 15707 9 2008-09 5637 6331 4835 227 139 17169 10 2009-10 5011 4870 2899 233 172 13185 11 2010-11 5447 5277 4663 231 169 15217 12 2011-12 5447 4745 5003 231 141 15872 13 2012-13 5465 5123 4646 250 144 15619 14 2013-14 5567 5305 6018 222 138 17250 15 2014-15 3450 3600 3143 195 93 10481 16 2015-16 6466 5237 5449 163 93 17408 17 2016-17 5725 5411 5485 211 101 16933
0 1000 2000 3000 4000 5000 6000 7000
Agriculture production of food grains
From 2000-01 to 2016-17 the total food Grains average increase is as follows Rice (5148.294), Maize (5034.471), Wheat (4388.647), Others cereals (215.9412) and pulses is (135.1765) , the total average food grains increase to (14929.88). The production of Rice is minimum in the year 2014-15 (3450), minimum Maize production in the year 2014-15 (3600), minimum Wheat production is in the year 2000-01 (1487), others cereals is minimum in the year 2015-16 (163), pulses in the year 2014-15 (93) and total food grains is minimum in the year 2014-15 (10481) while maximum production of food grains followed by Rice is maximum in the year 2015-16(6466), Maize in the year 2008-09(6331), Wheat in the year 2013-14 (6018), Others cereals in the year 2012-13 (250), Pulses in the year 2009-10 (172) and Total food Grains production increased in the year 2015-16 (17408).
Table 1.2 Descriptive statistics of Various Food Grains from 2001 to 2017
Rice Maize Wheat Others cereals
Pulses Total food grains Mean 5148.294 5034.471 4388.647 215.9412 135.1765 14929.88 Minimum 3450 3600 1487 163 93 10481 Maximum 6466 6331 6018 250 172 17408 Source: - Statistical digest of J&K
The table below 1.1 shows that during the month of April the export of Dry fruits is less and in the month of May it increase considerably. Similarly, in the month of August there was least export and in the month of October there is high exports of Dry fruits. On the other in term of Fresh Fruits up to June there was less export of fresh fruits and in the moth of September export of fresh fruit increase very high in the year 2003-04.
Table 1.1 shows exports of Fresh and Dry Fruits from Jammu and Kashmir (Metric Tonnes)
Source: Statistical Digest of J&K (2016-17)
323.6 1760.9 660.8 326.4 39.7 466.8 2924.9
1399.21423.31395.31302.6
869
Dry Fruits(2003-04)
66.4225.12293.118674.1
34731.6 61017.1 174195.7 203400.7 138148.3 76441.7 48806.1 4401.2 0 50000 100000 150000 200000 250000 A p ri l
May Jun
e Ju ly A u gu st Se p te mb er O ct o b e r N o ve mb er De ce m b er Jan u ary Fe b ru ary Mar ch
Table 1.2 shows export of Fresh and Dry fruits in Jammu & Kashmir (metric tonnes)
Source: Statistical Digest of J&K (2016-17)
The table above 1.2 shows that in the month of July the export of Dry fruits was very low and it increase very rapidly in the month of August and September. On the other hand, in terms of fresh fruits in the month of April there was very less export and in the month of August and September it increases very fastly in the year 2004-05
Table 1.3 shows export of Fresh and Dry fruits in Jammu & Kashmir (metric tonnes)
Source: Statistical Digest of J&K (2016-17)
The table above1.3 shows that in the year 2005-06 in the months of May to September there was almost zero export of Dry fruits and in the month of October it increases very rapidly and then decline in the later months considerably. On the other hand, during the same year from April to September there was very less export of fresh fruits and it increase rapidly in the month of October and November.
0 500 1000 1500 2000 2500 3000 3500 A p ri l
May Jun
e Ju ly A u gu st Se p te mb er O ct o b e r N o ve mb er De ce m b er Jan u ar y Fe b ru ary Mar ch 0 50000 100000 150000 200000 250000 A p ri l
May Jun
e Ju ly A u gu st Se p te mb er O ct o b e r N o ve mb er De ce m b er Jan u ary Fe b ru ary Mar ch
Fresh Fruits (2004-05)
0 500 1000 1500 2000 2500 3000 A p ri l
May Jun
e Ju ly A u gu st Se p te mb er O ct o b e r N o ve mb er D ece m b er Jan u ary Fe b ru ary Mar ch
Dry Fruits (2005-06)
0 50000 100000 150000 200000 250000 A p ri l
May Jun
e Ju ly A u gu st Se p te mb er O ct o b e r N o ve mb er De ce m b er Jan u ary Fe b ru ary Mar ch
Table 1.4 shows export of Fresh and Dry fruits in Jammu & Kashmir (metric tonnes)
Source: Statistical Digest of J&K (2016-17)
The table above 1.4 shows that in the year 2006-07 in the month of April, May and June there was low exports of Dry fruits and in the month of July there was very less export and in the month of October it increases very rapidly than in the later months it remains considerably satisfactory. On the other hand, in terms of Fresh fruits from April to July the export of fruits remains very low and in the months of September and October it raises very much.
Table 1.5 shows export of Fresh and Dry fruits in Jammu & Kashmir (metric tonnes)
Source: Statistical Digest of J&K (2016-17)
The table above 1.5 shows that in the year2007-08, in the month of August the export of Dry Fruits remain low and in the month October it increase very rapidly on the other hand the export of fresh fruits from April to July remain very low and in the month of September to November it increase considerably very fastly.
0 500 1000 1500 2000 2500 3000
1 2 3 4 5 6 7 8 9 10 11 12
Dry Fruits (2006-07)
0 50000 100000 150000 200000 250000
1 2 3 4 5 6 7 8 9 10 11 12
Fresh Fruits (2006-07
0 500 1000 1500 2000 2500 3000 3500 4000
1 2 3 4 5 6 7 8 9 10 11 12
Dry Fruits (2007-08)
0 50000 100000 150000 200000 250000
1 2 3 4 5 6 7 8 9 10 11 12
Table 1.6 shows export of Fresh and Dry fruits in Jammu & Kashmir(metric tonnes)
Source: Statistical Digest of J&K (2016-17)
As shown in the above table 1.6 during the year 2008-09 the export of Dry fruits in the months of July August was very low and it increase very fastly in the month of October. On the other hand in fresh fruits from April to July the export was very low and in the month of October , November it increase very rapidly and in the month of March it decease.
Table 1.7 shows export of Fresh and Dry fruits in Jammu & Kashmir(metric tonnes)
Source: Statistical Digest of J&K (2016-17)
As shown in the above table 1.7 during the year2010-11 in the month of September the export of dry fruits was low and it increase very rapidly in the month of October and remained considerably good in the later months. On the other hand, in terms of fresh fruits from April to July the export was less and it increase in the October and November than after it continues declines and in the month of March it becomes close to zero.
0 500 1000 1500 2000 2500 3000
1 2 3 4 5 6 7 8 9 10 11 12
Dry Fruits (2008-09)
0 50000 100000 150000 200000 250000 300000 350000
1 2 3 4 5 6 7 8 9 10 11 12
Fresh Fruits (2008-09)
0 500 1000 1500 2000 2500 3000 3500 4000 4500 5000
1 2 3 4 5 6 7 8 9 10 11 12
Dry Fruits (2010-11)
0 50000 100000 150000 200000 250000 300000 350000
1 2 3 4 5 6 7 8 9 10 11 12
Table 1.7 shows export of Fresh and Dry fruits in Jammu & Kashmir (metric tonnes)
Source: Statistical Digest of J&K (2016-17)
The table above 1.7 shows that during the year 2011-12 in the month of July the export of dry fruits increases rapidly an in month of August it declines and after the remaining months it remains moderately satisfactory. On the other hand, in fresh fruits from April to June the export was very low and it increase in the month of October and declines very rapidly in the month of March.
Table 1.8 shows export of Fresh and Dry fruits in Jammu & Kashmir (metric tonnes)
Source: Statistical Digest of J&K (2016-17)
The table above 1.8 shows that during the year 2012-13 in the month of October the export of Dry fruits was very much satisfactory and in the month February it declines. On the other hand in fresh fruits from April to July the export was low and in the month of October November it increase rapidly.
0 2000 4000 6000 8000 10000 12000 14000 16000
1 2 3 4 5 6 7 8 9 10 11 12
Dry Fruits (2011-12)
0 50000 100000 150000 200000 250000 300000 350000
1 2 3 4 5 6 7 8 9 10 11 12
Fresh Fruits(2011-12
0 500 1000 1500 2000 2500 3000 3500 4000 4500
1 2 3 4 5 6 7 8 9 10 11 12
Dry Fruits (2012-13)
0 50000 100000 150000 200000 250000 300000 350000 400000
1 2 3 4 5 6 7 8 9 10 11 12
Table 1.9 shows export of Fresh and Dry fruits in Jammu & Kashmir (metric tonnes)
Source: Statistical Digest of J&K (2016-17)
The table above 1.9 shows that during 2013-14 in the month of May and August the export of Dry fruits was low and it increase in the months of April, November and March . on the other hand in fresh fruits from April to August the export of fresh fruits was very low and it increase in the month of October and November.
Table 1.10 shows export of Fresh and Dry fruits in Jammu & Kashmir(metric tonnes)
Source: Statistical Digest of J&K (2016-17)
The table above 1.10 shows that during the year 2014-15 in the month of May and June the export was less and it increase in the month October. On the other hand, the export of fresh fruits from April to July was very less and it increase in the month of October and November.
0 500 1000 1500 2000 2500
1 2 3 4 5 6 7 8 9 10 11 12
Dry Fruits (2013-14)
0 50000 100000 150000 200000 250000 300000 350000 400000 450000
1 2 3 4 5 6 7 8 9 10 11 12
Fresh Fruits (2013-14)
0 500 1000 1500 2000 2500 3000
1 2 3 4 5 6 7 8 9 10 11 12
Dry Fruits (2014-15)
0 50000 100000 150000 200000 250000 300000 350000 400000
1 2 3 4 5 6 7 8 9 10 11 12
Table 1.11 shows export of Fresh and Dry fruits in Jammu & Kashmir(metric tonnes)
Source: Statistical Digest of J&K (2016-17)
The table above 1.11 shows that during the year2015-16 in the month of October the export of dry fruits was very good and it declines in the month of December. On the other hand in fresh fruits from April to August the export was very much low , it increase in the month of October, November.
Table 1.12 shows export of Fresh and Dry fruits in Jammu & Kashmir(metric tonnes)
Source: Statistical Digest of J&K (2016-17)
The table above 1.12 shows that during the year 2016-17 in the month of July, August the export of dry fruit was low and it increase in the month of April, September and October. On the other hand, in fresh fruits from April to August the export was low and it increase in the month of October.
Conclusion
The Argo-sectors like, agricultural, Horticultural and handicrafts sectors are well and diversified in the economy despite of being very issues like economic , social, political instability , climatic , hilly terrain lack of transport and infrastructure facilities. The physiographic division and lack of entrepreneurship the economy of the state shows tremendous progress during the last 10 to 15 years.
0 500 1000 1500 2000 2500 3000 3500 4000
1 2 3 4 5 6 7 8 9 10 11 12
Dry Fruits (2015-16)
0 50000 100000 150000 200000 250000 300000 350000 400000 450000 500000
1 2 3 4 5 6 7 8 9 10 11 12
Fresh Fruits(2015-16)
0 500 1000 1500 2000 2500 3000 3500 4000
1 2 3 4 5 6 7 8 9 10 11 12
Dry Fruits(2016-17)
0 100000 200000 300000 400000 500000 600000
1 2 3 4 5 6 7 8 9 10 11 12
References
1. Shah, M. R. (2016). An Assessment of Handicraft Sector of J&K with Reference to Central Kashmir. Arabian Journal of Business & Management Review, 6(5), 1-6
2. Bakari, S., & Mabrouki, M. (2017). Impact of exports and imports on economic growth: New evidence from Panama. Journal of Smart Economic Growth, 2(1), 67-79.
3. Nengroo, A. H., Bhat, G. M., & Khaki, A. R. (2016). Economic impact of Tourism in Jammu and Kashmir. Indian Journal of Economics and Development, 4, 3.
4. Statistical Digest of J&K 2016-17.
5. Economic survey of J&K 2017.
6. Bhat B A (2006) Impact of Turmoil on Tourist Industry of Jammu and Kashmir. International Journal of Marketing, Financial services and Management Research 1: 124-126.
7. (2014) Directorate of Economics and Statistics 2014-2015.Directorate of Economics & Statistics, J&K. Government of J&K.
8. (2014) Textiles. Annual report. Government of India.
9. Sharma S (2010) Role of handicrafts industry in production, employment and export promotion: A case study of J&K state. Kashmir journal of social sciences 4: 43-61.
10.Ghouse SM (2012) Indian Handicrafts Industry: Problems and strategies. International Journal of Management Research and Review 2: 1183-1199.
11.Bhat FA, Yasmin E (2013) An Evaluation of Handicraft Sector of J&K-A Case study of District Budgam. European Academic Journal 1: 367-381.
“Assessment of Present Healthcare Scenario in India”
Dr. Hatim Fakhruddin Kayumi
Abstract
India has witnessed phenomenal growth and massive rise in healthcare industry with regards to the income earned as well as number of employment opportunities generated. This intensification is the result of large collection of well-qualified and expert medical practitioners located across the country. Undoubtedly, the overall growth and progress made by domestic healthcare and medical sector is quite noteworthy. It is very important that such facilities must be made available to rural areas and villages for ensuring economic development of nation. Wide-spread poverty leads to malnourishment, hunger, starvation and contagious diseases. All this puts serious problems on economic advancement of the country. Present research is a descriptive study mainly based on secondary data. Study focuses on exploring rising amount of expenditure incurred on numerous healthcare services and facilities in India during past one decade. Study points out healthcare expenditure incurred in India as a percentage of GDP. Further, study highlights initiatives, efforts and steps taken by Indian Government to promote healthcare in the country. Finally, study throws light on latest developments and advancement taking place in domestic healthcare segment in India.
Key Words: Healthcare, Expenditure, Government Initiatives, Developments, India
A) Overview of Healthcare in India
As an emerging economy, India has witnessed phenomenal growth and massive rise in healthcare industry with regards to the income earned as well as number of employment opportunities generated. This intensification is the result of large collection of well-qualified and expert medical practitioners located across the country. This helps the nation is gaining a competitive edge over other nations competing with one another. Further in comparison with Asian and other countries in operating in healthcare industry, India is highly cost effective and cheaper and thus, attracts large number of customers. In certain cases, the cost of operations and medical treatment in India amounts to about 1/10th then amount expended in American and European nations. Indian healthcare sector is experiencing heavy development at rapid pace due to its amplifying scope, services offered and mounting costs and outflows by both public and private firms and institutions. When one discuss about the healthcare system prevailing in India, there are two major classifications, i.e.
• One segment of healthcare that offers high quality health and medical services to middle-class citizens and to different tourists & foreign nationals entering in the country for medical requirements.
• Another segment of healthcare that covers large proportion of the domestic population which get access to either limited or no quality of medical services and facilities
There are about six and half lakhs villages in India where large population resides. According to Rural Health Statistics Bulletin (2010), if such rural villages and small towns do not get
access to various basic or primary healthcare services in the country, it is not possible to achieve overall growth and progress. This growth will be incomplete although how much advanced and modern services are delivered in urban cities and metropolitans. Undoubtedly, the overall growth and progress made by domestic healthcare and medical sector is quite noteworthy. It is very important that such facilities must be made available to rural areas and villages for ensuring economic development of nation. Wide-spread poverty leads to malnourishment, hunger, starvation and contagious diseases. All this puts serious problems on economic advancement of the country. Healthcare indicators changes from state to state and from region to region. This further signifies the varying levels of supplies and resources offered to state governments. One common problem that is regularly observed is that healthcare indicators available in rural areas are comparatively very bad than that in urban areas. Prime difficulty is the accessibility of healthcare in rural areas. Healthcare in India is mainly primary healthcare which is extremely insufficient as well as sadly scare in comparison to what to actually needed and required by the people by large. With reference to research done by Confederation of Indian Industry (CII), the official healthcare system is made available only to about half of the aggregate population. According to World Health Report 2006 issued by WHO, India is badly short of experts medical practitioners and professional doctors. The report highlighted that there is only one doctor for 1,700 people in India as of year 2006.
Healthcare sector in India is broadly classified into government (public) healthcare and private healthcare. The public sector encompasses of offering basic healthcare amenities through primary healthcare centres particularly located in small towns and rural areas followed by inadequate number of secondary and tertiary healthcare organizations in large cities and metros. On the contrary, private sector healthcare prefers to offer services other than primary healthcare in tier I and tier II cities and metropolis. According to the estimates given by Deloitte Touche Tohmatsu India, the domestic healthcare sector which is growing at a CAGR of 23% is expected to rise to about one hundred billion US Dollar by the year 2020. This is primarily because of growth in digital adoption. Income generated by domestic corporate healthcare centres is expected to rise by 15% during the financial year 2017-18. By the end of year 2017-18, it is anticipated that the domestic medical tourism industry which is advancing at a rate of more than 20% p.a. shall reach upto six billion US Dollar. Number of tourists entering India for purpose of medical treatment was nearly two lakhs in year 2016.
B) Objectives of Study
• To study trend of healthcare expenditure expended in India on various services & facilities
• To study different initiatives and efforts taken by Indian Government to promote domestic healthcare industry
• To investigate the latest developments and advancement taking place in Indian healthcare industry
C) Research Design
i) Data Collection: Research is mainly based on Secondary Data.
ii) Sources of Data: Internet, Government reports & units, reference books, etc.
out healthcare expenditure incurred in India as a percentage of GDP. Further, study highlights initiatives, efforts and steps taken by Indian Government to promote healthcare in the country. Finally, study throws light on latest developments and advancement taking place in domestic healthcare segment in India.
D) Intensification in Healthcare Expenditure in India
Table 1: Table showing rise in healthcare expenditure in India (Rs. in Billion US Dollar)
Year Expenditure
2008 45.0
2009 51.7
2010 59.5
2011 68.4
2012 72.8
2014 81.3
2015 104.0
2016 110.0
2017 (Estimate) 160.0 2020 (Estimate) 280.0
Source: Report on Health, India Brand Equity Foundation, July 2017, pp. 08
Figure 2: Graph showing rise in healthcare expenditure in India
Above table and graph exhibits rise and growth in the healthcare expenditure in India over a period of one decade. It can be seen that healthcare industry is intensifying at a remarkable speed because of its wide coverage, expertise services and heavy spending from public and private firms and organizations. Healthcare expenses has increased to more than double from 45 billion US Dollar in year 2008 to 110 billion US Dollar in year 2016 and is further expected to mount to 280 billion US Dollar in year 2020. The industry is estimated to grow a CAGR of 16.50% from year 2008 to 2020. This growth is the result of extensive support from the Government through different concessions, grants and schemes as well as number of joint ventures, takeovers and acquisitions to domestics firms with off-shore and foreign companies giving them an upper hand to increase their quality and competitiveness in
0.0 50.0 100.0 150.0 200.0 250.0 300.0
2008 2010 2012 2015 2017 (Est)
Amount in Billion US Dollar
Year
providing medical services. The above facts clearly indicate that there is massive scope for expansion and augmentation in Indian healthcare sector in terms of revenue and expenditure incurred. According to World Bank, BMI Report, the per-capita healthcare expenditure was expected to grow at CAGR of 5% from 2008 to 2015. Per-capita healthcare expenditure was expected to increase from 54 US Dollar in 2010 to about 68.60 US Dollar in 2015. The common reasons for this rise included rising revenues, better and improved medical services and increased understanding and alertness of people about health and hygiene. On other hand, mounting number of medi-claim and health insurance providers in Indian markets, there has been amplification in medical & healthcare expenditures particularly during past one decade.
E) Healthcare Expenditure as a percentage of GDP
Figure 2: Graph showing healthcare expenditure as percentage of GDP (year 2015)
Source: Report on Health, India Brand Equity Foundation, July 2017, pp. 32
Above graph brings to light expenditure on healthcare service as a percentage of GDP for the globe and for India. The graph clearly displays that as compare to world healthcare market, expenditure on healthcare in India is quite less. In India, healthcare spendings accounts to nearly 4.20% of GDP; whereas on other hand, global spendings on healthcare as a percentage of GDP comparatively amounts quite high at 10.60%. However, per capita income in India is expected to increase at a CAGR of more than 8% from year 2015 to year 2019. This rise will definitely boost domestic healthcare industry in near future. Further, changing demographic profile (rise in age) of Indian population shall amplify expenditure on healthcare services and facilities in India.
In addition, contend increase of lifestyle diseases are expected to enhance outlays of healthcare in future. It is anticipated that occurrences of heart problems (failure and attacks), diabetes, BP problems and obesity are rising at tremendous speed. Thus, healthcare outflows had rose quite high because of these problems. According to Apollo Investor Presentation (March 2016), number of hospitalized cases because of cardiac problems, oncology and diabetes are estimated to be increased to 8.3 million, 4.2 million and 3.4 million respectively by the year 2018. Over a period of one decade (from 2008 to 2018), these hospitalized cases are expected to increase by 18%, 16% and 19% respectively in India.
F) Government Support to encourage Indian Healthcare Segment
Prime objective of Indian Government is to build up the economy as global leader in healthcare segment. By imposing number of latest plans and policies, number of exemptions
10.60%
4.20%
0.00% 2.00% 4.00% 6.00% 8.00% 10.00% 12.00%
World India
and concessions are granted in order to reduce overall costs of healthcare facilities and make them more competitive. Central Government has given positive acceptance to National Health Policy 2017. This policy shall aims towards building and implementing a framework and structure for attaining global health coverage and providing better healthcare amenities and qualitative facilities to common people at reasonable and cheap prices. The goal of this policy is to make available the policy structure for attaining common health coverage and delivering quality healthcare and medical facilities to common people at economical expenses. According to Mr. Shripad Naik (Minister of State, AYUSH), the AYUSH Ministry is functioning in collaboration and association with different organizations, institutions and also with Ayurveda experts / researchers / practitioners all over the world. The aim is to transform the economy into an international centre with regards to knowledge, research, practice and developmental projects on traditional medicines.
Further, 100% Foreign Direct Investments (FDI) is permitted in case of automatic route for green-field projects; whereas upto 100% FDI is permissible through Government route for brown-field projects. According to Department of Industrial Policy and Promotion, the foreign investments in healthcare industry grew multifold times from April 2000 to March 2017. The inflows in respect to drugs and pharmaceutical sectors stood at 14.71 billion US Dollar. On other hand, inflows in hospitals / diagnostic centres and medical appliances stood at 4.20 billion US Dollar and 1.47 billion US Dollar. During present Union Budget year 2017-18, total health budget was enhanced to approximately Rs. forty nine thousand crores amounting to 2.27% of aggregate budget. Further many key changes have been executed as well as been proposed by GoI in past few years. This includes:
• Government is encouraging the Public-Private Partnership (PPP) model in healthcare industry in order to enhance facilities and mobilizing financial resources. Five new projects under PPP model has been completed and started functioning from Oct. 2015.
• For promoting and supporting local producers and advancing towards offering reasonable services to patients, synchronize rules, policies, strategies.
• Ministry of Health undertook Biomedical Equipment Management and Maintenance Program (BMMP) in December 2016. Prime goal of this program to avoid wastage of both used as well as used medical equipments. This initiative shall make certain proper maintenance of medical tools and equipments which are used in different healthcare centres and hospitals.
• Alterations and changes in Drugs and Cosmetics Act (DCA) for encouraging manufacturing and distribution of generic medicines for common people.
• Establish one single window approval system for modern and advance innovation in the field of medical research. This shall help in giving consent and authorization to such schemes and ventures for global patents within thirty days.
• Increase potential & proficiency of existing laboratories located in different regions along-with setting-up new drug testing laboratories.
• Transform 1,50,000 sub health centres located in rural areas and villages into Health and Wellness Centres.
• Emphasis on e-Health initiatives such as Mother and Child Tracking System (MCTS) and Mother and Child Tracking Facilitation Centre (MCTFC).
• Established two new All India Institute of Medical Sciences (AIIMS) in each of the states of Gujarat and of Jharkhand.
• Under the union budget of 2017-18, following provisions were made:
o Establishing health infrastructure fund that would be accessible and available for infrastructure and innovation particularly in tier II, tier III, rural villages and small towns.
o Increasing present tax exempted limit on preventive health check-up of 74.37 US Dollar to 297.48 US Dollar. This amount shall be exempted u/s 80D of Income Tax Act for achieving proper coverage under the universal healthcare.
o To increase present deduction limits on medical insurance premium from 223.11 US Dollar to 743.71 US Dollar. This limit shall be applicable to both self as well as family members. On other hand, deduction limit for dependent parents requires to be hiked from 297.48 US Dollar to 743.71 US Dollar.
o Proposed budget included provision for increasing depreciation rate on medical apparatus, equipments and devices from 15% to 30%.
o Import duties and taxes charged on healthcare and medicines including drugs, surgical tools & equipments, shall be removed off fully in case the same are manufactured in India.
G) Latest Developments and Trends in National Healthcare
• Large hospitals and medical centres are using and giving more emphasis on telemedicine services as it is the most upcoming segment in the country. By the end of financial year 2015-16, domestic telemedicine industry amounted to nearly fifteen million US Dollar and is estimated to grow upto thirty two million US Dollar by the year 2019-20. Telemedicine industry is anticipated to flourish at the CAGR of 20% from 2016 to 2020.
• Domestic mobile health segment is estimated to grow upto 0.6 billion US Dollar by the year 2017. With the advance telecommunication up-gradation, development of infrastructure and commencement of 4G are anticipated to drive mobile health schemes in India.
• Different hospitals and medical centres targets to compete with other firms by proposing several specialty and expert services under one single building. This concept is highly beneficial for needy patients and customers in terms of suitability and accessibility. Accordingly numerous hospitals are entering into joint ventures with government to make available healthcare services in small villages, towns and semi-urban areas.
• Certain hospitals and medical centres focus to deliver homogenous and uniform healthcare facilities to all its patients and clients. On other hand, this trend helps such hospitals and institutions to become expert leader in a particular service or facility.
• Vaatsalya Healthcare is the pioneer hospital that aims to start hospital chains in Tier II and III cities for extension purpose. In order to assist and promote private organizations to set-up new hospitals and medical centres in small cities, towns and villages, government has announced various concession and considerations in taxes and duties to enhance income and revenues of such newly established hospitals.
• Health insurance has attracted tremendous attention in past few years. This industry has grown at compounded growth of more than 15% p.a. during the year 2007-08 to 2015-16.
efficiency of employees, optimum utilization of resources, proper training and development, etc. This shall help private hospitals and healthcare centres to reduce down their costs of operations and increase its revenue.
• Today, lifestyle diseases and illnesses has taken place of the conventional old health related problems and sicknesses. Because of increased disorders, complexities and ailments experienced in present day living, more than half of the expenditure is on lifestyle diseases and illnesses.
• There exist a large gap between rural areas including small villages & towns and urban areas including cities & metro with regards to medical amenities, analytical laboratories and advancements. Using new telecommunication and internet services helps in bridging this gap by providing medical and hospital facilities at reasonable and affordable prices to isolated and far distant places.
• One modern trend of luxury services has been newly introduced in domestic healthcare industry. In addition to basic medical facilities, the industry offers new, innovative and luxurious medical amenities. This include pick & drop facilities, using aerial mode of transportations, special arrangement for guests and visitors, etc.
H) References
• Bajpai N., Dholakia R. and Sachs J., ‘Scaling up Primary Health Services in Rural India’, Centre on Globalisation and Sustainable Development, Working Paper No. 29,
2005.
• Bloom David and Canning David, ‘Population Health and Economic Growth’,
International Bank for Reconstruction and Development (World Bank) on behalf of the Commission on Growth and Development, Working Paper No. 24, 2008.
• Iyengar S. and Dholakia R., ‘Access of the Rural Poor to Primary Healthcare in India’,
Indian Institute of Management, Ahmadabad, 2011.
• Report on Health, India Brand Equity Foundation, July 2017.
• Sammut Y. S. and Burns L., ‘Meeting the Challenges of Healthcare Needs in India:
Paths to Innovation’, ISB Insight, Volume IX, No. 2, pp. 05-09.
• Satpathy S. K. and Bansal R. D., ‘Health Economics – Concepts and Conceptual Problems’, Health and Population Perspectives & Issues, Volume V, No. 1, 1982, pp.
23-33.
Effectiveness of Package of Human Resource Development
Activities on Leadership Skill Development of Primary
School Heads
Dr.YARRISWAMY.M.C
PUSHPALATHA
Abstract
The purpose of the present study is to know the effect of human resource development activities on leaderships skills of primary school heads. The objectives of the study are to know the effect of human resource development activities on leadership skill development of primary school heads working in Harpannalli Taluka. A total number of 60 primary school heads were selected by purposive sampling method. The method adopted for the present study is experimental of Pre-test and post-test. Human resource development activities scale and leadership skill development scale developed by the investigator, for analysis of data differential statistical technique was applied and data collection procedure was followed and hypotheses were tested based on the objectives of the present study. Findings of the present study reveal that. There is no significant difference between control group and experimental group when it is conducted pre-test and there is a significant difference between control group and experimental group when it is conducted post-test for male, female, rural and urban heads.
Introduction
Human resource development in the organizational context is a process by which the employees of an organization are helped in a continuous, planned way to: (a) acquire or sharpen capabilities required to perform various functions associated with their present or expected future roles; (b) develop their general capabilities as individuals and discover and exploit their own inner potentials for their own and/or organizational development processes; and (c) develop an organizational culture in which supervisor-subordinate relationships, team work and collaboration among sub units are strong and contribute to the professional well-being, motivation and pride of employees. The positive HRD climate renders the existing systems more effective and makes the organizations more receptive to the introduction of relevant additional system. Organizations differ in the extent to which they have these tendencies. Some organizations may have some of these tendencies, some others may have only a few of these and a few may have most of these.
Human resource development may also function to help an organization conform to government regulations or guidelines by training employees on relevant laws or regulations for which they are responsible. It may also take the form of professional development by educating in specific areas or fields. The Professional in Human Resources certification, Project Management, Professional certification, and Six Sigma Black Belt are examples of courses and certifications designed to train and develop professionals in these
Associate professor, School of Education(M.ED), Rani Channamma university, Bhotramanahatti,Belagavi-56
The success of the object of the school implementation depends on leader. With self motivation and involvement; ‘Success of the leader is, the success of the school’. To achieve this type of success, a capable leader is required. In education field; relating to subjects and co-curricular activities trainings have been done and going on. In order to develop the leadership quality and human resource development skill based training for the primary head Masters has not been introduced more.
By following the need of the knowledge, intelligence and skills by the head Masters, help them to strengthen the leadership quality in them. The management of the school, the head Master, who are capable of handling leadership qualities, no doubt they help in the progress of the school and students by supportive reaction. The researcher came to know the importance and needs of the above and prefer to take up a study on “Study on the Effect of Human Resource Development activities on Leadership of Primary School Head Masters”.
Reviews
Reddick and Hopkins (1997) conducted “A study of competencies and Requirements of Master’s Degree Programs in Human Resource Training and Development, Thomas (1998) conducted a study on “The Rationales, Design, and Implementation of an In-service Training Program and Direct Support System for Continuing Training of Masters in the Human Development Program” Bigham (2000) conducted a study on “Preferred Leadership Frames of texas Principals in Implementing the Professional Development and Appraisal System”. Badal (2000) conducted a study on “A Study Assessing the Effectiveness of a Performance Appraisal System for Elementary for School Administrators”. These previous studies have supported to the present study.
Objectives of the study
• To know the difference between control group and experimental group when it is conducted pre-test and there is a significant difference between control group and experimental group when it is conducted post-test for male heads.
• To know the difference between control group and experimental group when it is conducted pre-test and there is a significant difference between control group and experimental group when it is conducted post-test for female heads.
• To know the difference between control group and experimental group when it is conducted pre-test and there is a significant difference between control group and experimental group when it is conducted post-test for rural primary school heads.
• To know the difference between control group and experimental group when it is conducted pre-test and there is a significant difference between control group and experimental group when it is conducted post-test for urban primary school heads.
Hypotheses of the study
a) There is no significant difference between control group and experimental group when it is conducted pre-test and there is a significant difference between control group and experimental group when it is conducted post-test for male heads.
b) There is no significant difference between control group and experimental group when it is conducted pre-test and there is a significant difference between control group and experimental group when it is conducted post-test for female heads.
d) There is no significant difference between control group and experimental group when it is conducted pre-test and there is a significant difference between control group and experimental group when it is conducted post-test for urban primary school heads.
Methodology
Method used
For the present study the experimental method was adopted which covers pre-test, post-test, control group and experimental group.
Sample
A total number of 60 heads working in primary schools from Harpanahalli Taluka were selected.
Tools Used
For the present study the following tools were developed by the investigator and were used to collect the necessary data.
Statistical technique
For the present study for analysis of data Differential analysis technique was adopted.
Table:1 Comparison of Control and Experimental groups with respect to Pre-test-and Post-test of Male Heads
Variables Groups n Mean SD t-value P-value Signi. Pre-test Control group 30 14.60 3.67 1.3317 >0.05 NS Experiment group 30 15.35 2.72 Post-test Control group 30 18.92 4.03 -3.1398 <0.05 S Experiment group 30 22.22 3.15 Difference Control group 30 3.48 2.45 -6.3078 <0.05 S Experiment group 30 7.87 2.36 There is no significant difference between control group and experimental group when it is conducted pre-test and there is a significant difference between control group and experimental group when it is conducted post-test for male heads. However, the mean scores in experimental group is greater than the control group in both the tests conducted for male heads.
Table: 2 Comparison of Control and Experimental groups with respect to pre- test and post test ratio and proportion of Female Heads