R E S E A R C H
Open Access
Learning temporal weights of clinical
events using variable importance
Jing Zhao
*and Aron Henriksson
FromIEEE International Conference on Bioinformatics and Biomedicine 2015 Washington, DC, USA. 9–12 November 2015
Abstract
Background: Longitudinal data sources, such as electronic health records (EHRs), are very valuable for monitoring adverse drug events (ADEs). However, ADEs are heavily under-reported in EHRs. Using machine learning algorithms to automatically detect patients that should have had ADEs reported in their health records is an efficient and effective solution. One of the challenges to that end is how to take into account the temporality of clinical events, which are time stamped in EHRs, and providing these as features for machine learning algorithms to exploit. Previous research on this topic suggests that representing EHR data as a bag of temporally weighted clinical events is
promising; however, the weights were in that case pre-assigned according to their time stamps, which is limited and potentially less accurate. This study therefore focuses on how to learn weights that effectively take into account the temporality and importance of clinical events for ADE detection.
Methods: Variable importance obtained from the random forest learning algorithm is used for extracting temporal weights. Two strategies are proposed for applying the learned weights: weighted aggregation and weighted sampling. The first strategy aggregates the weighted clinical events from different time windows to form new features; the second strategy retains the original features but samples them by using their weights as probabilities when building each tree in the forest. The predictive performance of random forest models using the learned weights with the two strategies is compared to using pre-assigned weights. In addition, to assess the sensitivity of the
weight-learning procedure, weights from different granularity levels are evaluated and compared.
Results: In the weighted sampling strategy, using learned weights significantly improves the predictive performance, in comparison to using pre-assigned weights; however, there is no significant difference between them in the weighted aggregation strategy. Moreover, the granularity of the weight learning procedure has a significant impact on the former, but not on the latter.
Conclusions: Learning temporal weights is significantly beneficial in terms of predictive performance with the weighted sampling strategy. Moreover, weighted aggregation generally diminishes the impact of temporal weighting of the clinical events, irrespective of whether the weights are pre-assigned or learned.
Keywords: Learning weights, Temporality, Adverse drug events, Electronic health records, Machine learning, Random forest, Pharmacovigilance
*Correspondence: [email protected]
Department of Computer and Systems Sciences, Stockholm University, Borgarfjordsgatan 12, SE-16407 Kista, Sweden
© 2016 The Author(s).Open AccessThis article is distributed under the terms of the Creative Commons Attribution 4.0
Background
Adverse drug events (ADEs) have become a major public health problem by causing approximately 2.4 to 12.0 per-cent of hospital admissions worldwide [1–3]. To improve drug safety, a wide range of data sources have been used [4], among which electronic health records (EHRs) are an especially valuable source of information [5, 6]. It is not only because EHR data provides a holistic perspec-tive of patients’ health history, including diagnoses, drug admissions, laboratory tests and so on; they also contain longitudinal data over a long time period across a large population. Nevertheless, ADEs are still under-reported in EHRs [7]. Manually screening millions of health records to identify ADEs is practically impossible for the mas-sive amounts of data archived in an EHR database. To mitigate this problem, supervised machine learning can be adopted to automatically detect the presence of an ADE in health records in which it was not but should have been reported [8–14]. To that end, predictive mod-els are trained to detect health records that contain ADEs with clinical events – i.e., diagnoses, drugs, clinical mea-surements, etc. – as features. These clinical events are reported in a chronological order in EHRs and the same event often appears in the same health record several times at different time points.
One of the advantages of using longitudinal data, such as EHRs, is that clinical events are recorded chrono-logically. As a result, temporality can be included as a parameter when building predictive models from this data, which is especially important for tasks like iden-tifying ADEs. There have been attempts to handle the temporality of clinical events when fitting machine learn-ing models to EHR data. Examples include Slearn-ingh et al. [15] using EHRs to predict kidney function loss and Zhao et al. [16] identifying ADEs in EHR data. The for-mer proposed theStacked-Temporalstrategy that divides patients’ medical history into a number of time windows and then merges the clinical events within each time win-dow; this was likewise, but independently, proposed in the latter study, in which the strategy was denotedBag of Binned Events. The disadvantage of this strategy is that the dimensionality of the feature increases almost proportion-ally with the number of time windows. Singh et al. [15] proposed an additional strategy to handle temporality, calledMultitask-Temporal, that creates a predictive model using clinical events from each time window and aggre-gates the outcomes from each task. Meanwhile, Zhao et al. [16] proposed a strategy, called Bag of Weighted Events, that assigns weights to clinical events from dif-ferent time windows and then aggregates the weighted events. Both studies use aggregation of clinical events at different time points and compare their strategy to a baseline which does not take temporality into account, and both have shown improved predictive performance
when incorporating temporal information in the medical history of patients. However, in theMultitask-Temporal
strategy, the predictive task is divided into a set of parallel tasks focusing on each time window, and, consequently, models the relationship between the target event, in their case kidney function loss, and clinical events from dif-ferent time windows independently. Tackling tasks like ADE detection requires the ability to take into account all events from the medical history of patients since an ADE could be the result of a combination of clinical events at different time points. This is especially true for chronic or dose-dependent ADEs. Therefore, theBag of Weighted Eventsstrategy is advantageous in that it assigns tempo-ral weights to clinical events from different time windows accordingly, and hence it not only takes into account the whole medical history but also incorporates the temporal-ity of clinical events in the predictive models.
As a continuation of theBag of Weighted Eventsstrategy, another study [17] explored and evaluates various weight-ing strategies based on the temporality of clinical events in EHRs. Those strategies, however, obtain weights accord-ing to each clinical event’s time stamp in relation to the target event; hence each clinical event receives a weight that is calculated globally in the same way as the oth-ers, regardless of differences in terms of informativeness. For example, body temperature that is measured one day before the target event, diagnosis of hypotension, receives a higher weight compared to blood pressure from three days ago, even if the latter is considered more important in the model for predicting drug induced hypotension. Therefore, it is natural not only to weight a clinical event based on its temporality, but also, to take into account its importance in predicting the target event. This study aims to enable learning weights locally for each clinical event at each time point and evaluate their impact on the performance of predictive models for ADE detection in EHRs.
Methods
curve (AUC) and area under the precision and recall curve (AUPRC) are used. Finally, the granularity of the weight learning procedure is explored in order to gain more evidence on the sensitivity of the weights learning scheme.
Temporal weighting strategies
Temporal weighting of clinical events aims to assign a weight to each event that takes into account the tem-porality of this event. The assigned weight will be used to build predictive models that exploit the correspond-ing clinical event as a feature. In the previous study [17], a temporal weighting strategy follows such a form: for a clinical event that occurred n days prior to the occur-rence of an ADE, weight w is assigned according to a curve function f(n). Nine different temporal weight-ing strategies were proposed in that study, all of which follow the common underlying assumption: events that occur closer to the target ADE are more important, in terms of their informativeness in the predictive models, and should hence receive more weight than those that occurred a longer time before the target ADE. There-fore, events that occurred in the same day as the target ADE receive a weight of 1, the highest weight; the weight then decreases monotonically with the number of days between the corresponding event and the target ADE until 90 days. Ninety days was chosen arbitrarily with common sense, i.e., the drugs or other clinical events that occurred more than 3 months before the occurrence of an ADE were considered unlikely to make significant contribution. All assigned weights are between 0 and 1. It was observed in that study that the impact of applying different tempo-ral weighting strategies is significant; among the proposed strategies, the best predictive performance is obtained from assigning weights according to a reciprocal function ofn, as follows:
w=f(n)= 1
n (1)
Learning weights automatically
Learning weights automatically is, in this study, per-formed with the assumption that more informative clini-cal events should receive higher weights, in contrast to the pre-assigned weights where more recent clinical events receive higher weights. Estimation of the informativeness of clinical events with different time stamps can, naturally, be achieved by treating each clinical event from a par-ticular time window as a separate feature, i.e., theBag of Binned Eventsstrategy in [16].
Here, we divide 90 days of the patient medical history before the target ADE event into 12 time windows, which are 1, 2, 3, 4, 5, 6, 7, 14, 21, 30, 60, 90 days before the tar-get ADE event, excluding events from the previous time
window. Therefore, the same clinical events from different time windows are treated as different features. Weights learning is then achieved by building predictive models using features from all 12 time windows and extracting weights in accordance with the informativeness of the fea-tures. In this study, this is done by calculating variable importance with the random forest algorithm [18], the variable importance is estimated using Gini score, which tests the impurity of each feature as a splitting node in the tree. The details of the random forest algorithm and variable importance is described later in Experimental Setup.
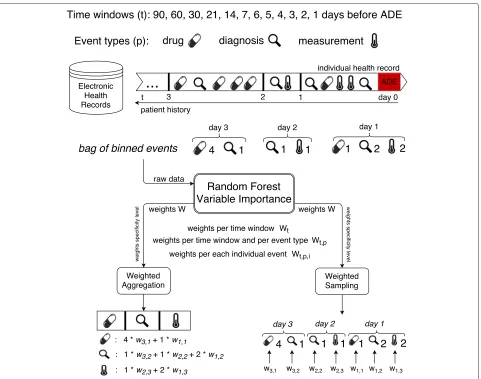
Once the weights of the clinical events have been obtained, the question moves on to how one can make use of them when building the predictive model. Here, we explore and evaluate the following two strategies for applying the learned temporal weights, which, together with the learning weights scheme, are illustrated in Fig. 1.
• Weighted Aggregation– corresponding weights are applied to the value of each event from different time windows and then the weighted values of the same event are aggregated.
• Weighted Sampling– weights are used as probabilities with which features are sampled to be considered as possible splitting nodes in the random forest algorithm.
Fig. 1Learning temporal weights of clinical events from electronic health records
the learned weight for each feature as the probability of it being selected. Doing so allows us to avoid aggregat-ing features from different time windows and to model their importance accordingly. It also allows us to take into account possible interactions between the same event from different time windows (see Algorithm 1).
Algorithm 1Weighted Sampling Strategy Given dataDwithNfeatures
Build random forest on D to obtain variable importance of each variableWn
NormalizeWnto obtainPn fori = 1 tontreedo
Randomly sampleDwith replacement to createDi
Select Ni =
√
N features with probability Pn as
possible splitting feature Build decision tree onDiandNi end for
Granularity of weight learning
The temporal weights learned from the above scheme are specific for each individual event from each time window. To obtain insights into this scheme, in terms of sensitiv-ity, i.e., how the predictive model’s performance would be influenced if the learned weights were from a different level of specificity, we also explored the granularity of the weight learning. More specifically, we would like to under-stand whether the impact of temporality varies only with the temporal information or if it is also influenced by the event types and even particular events of the same type. Here, three levels of specificity of weight learning were investigated:
• Per time window: a unique weight is learnt for all events in the same time window.
• Per individual event: a unique weight is learnt for each individual event from each event type in each time window.
Data source
In this study, 19 datasets were extracted from a real EHR system – the Stockholm EPR Corpus [20]. This research has been approved by the Regional Ethical Review Board in Stockholm (permission number 2012/834-31/5). This database contains health records from about 1.2 mil-lion patients over 7 years (2009–2015), which were col-lected from Karolinska University Hospital in Stockholm, Sweden. This database consists of heterogeneous types of information, including 11,623 unique diagnoses (encoded by ICD-10, the 10th revision of the International Sta-tistical Classification of Diseases and Related Health Problems), 1,564 unique drugs (encoded by ATC, Anatomical Therapeutic Chemical Classification System), 1,877 unique clinical measurements from laboratory tests and millions of clinical notes in free-text. Here, we focus on the use of structured information, i.e., diagnoses, drugs and clinical measurements.
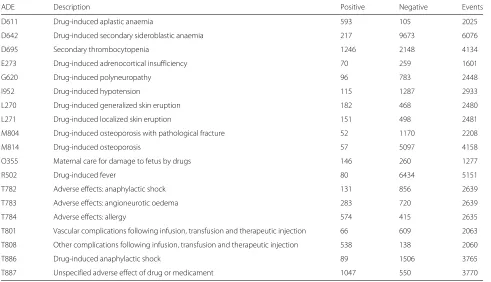
A previous study [21] has categorized ICD-10 diagnosis codes in terms of how they are used for indicating ADEs during hospital admissions, among which category A.1 (a drug-related causation was noted in the diagnosis code) and category A.2 (a drug- or other substance-related cau-sation was noted in the diagnosis code) indicate a clear sign of ADE occurrence; hence the most frequent, at least assigned to 50 patients, A.1 and A.2 ADE-related diag-nosis codes in the Stockholm EPR Corpus were selected. In total, 19 datasets were extracted with the existence of an ADE-related diagnosis code as the class label in each dataset. The task here is to detect patients who should, but do not, have a specific ADE reported in their health records, which results in a binary classification task.
In each dataset, positive examples are patients whom have been assigned an ADE-specific diagnosis code and negative examples are patients whom have been assigned a similar code (defined as two codes sharing the same first three levels of the ICD-10 concept hierarchy) to the cor-responding ADE-related one. For instance, if the positive examples are patients diagnosed withI95.2(Drug-induced hypotension), the negative examples are patients diag-nosed with any code starting with I95 (Hypotension), but not I95.2. Features are formed from clinical events including diagnoses, drugs and clinical measurements, that occurred 90 days before the occurrence of the target ADE. According to the findings from an earlier study on representing clinical events in EHRs [8], for each exam-ple, the value for each clinical event (feature) was thetotal number of timesthat it occurred during the whole or a part of the patient history up to 90 days. The class label, the number of positive and negative examples and the number
of clinical events involved in each dataset are described in Table 1.
Experimental setup
A series of experiments were conducted to evaluate the impact of learning weights of clinical events for predicting ADEs. First, we evaluated the predictive models using the learned temporal weights from the two proposed strate-gies, in comparison to using the pre-assigned weights, calculated as in Eq. 1.
In a follow-up experiment, in order to investigate how the learned weights influence the predictive performance in terms of tree quality and diversity, the average tree per-formance was compared to the ensemble perper-formance, which provides some insight into the ensemble classifiers. In an ensemble model, such as random forest used in this study, there are two components that affect the predictive performance: the performance of each individual model (tree in the case of random forest) and to what extent the models vary in their predictions (often referred to as diver-sity [22]). In a regression framework, it is suggested that diversity can be estimated as the difference between the (squared) error of the ensemble and the average (squared) error of the ensemble members [23]. The above states that the ensemble error can be no higher than the aver-age model error, and the more diversity, the lower the ensemble error. Currently, there is no standard for how to estimate diversity in a classification framework; here we adopt the idea from the regression framework, estimating the diversity as the difference between average tree per-formance and the ensemble perper-formance in terms of error rate.
Finally, we explored the granularity of the weight learning by assigning weights on three specificity levels: (1) each individual clinical event in each time window receives a unique weight, denoted asall; (2) clinical events that belong to one event type in each time window receive a common weight, denoted astype; (3) all clinical events in each time window receive a common weight, denoted astime.
Table 1Datasets description including class label, number of positive examples, number of negative examples and number of related unique clinical events
ADE Description Positive Negative Events
D611 Drug-induced aplastic anaemia 593 105 2025
D642 Drug-induced secondary sideroblastic anaemia 217 9673 6076
D695 Secondary thrombocytopenia 1246 2148 4134
E273 Drug-induced adrenocortical insufficiency 70 259 1601
G620 Drug-induced polyneuropathy 96 783 2448
I952 Drug-induced hypotension 115 1287 2933
L270 Drug-induced generalized skin eruption 182 468 2480
L271 Drug-induced localized skin eruption 151 498 2481
M804 Drug-induced osteoporosis with pathological fracture 52 1170 2208
M814 Drug-induced osteoporosis 57 5097 4158
O355 Maternal care for damage to fetus by drugs 146 260 1277
R502 Drug-induced fever 80 6434 5151
T782 Adverse effects: anaphylactic shock 131 856 2639
T783 Adverse effects: angioneurotic oedema 283 720 2639
T784 Adverse effects: allergy 574 415 2635
T801 Vascular complications following infusion, transfusion and therapeutic injection 66 609 2063
T808 Other complications following infusion, transfusion and therapeutic injection 538 138 2060
T886 Drug-induced anaphylactic shock 89 1506 3765
T887 Unspecified adverse effect of drug or medicament 1047 550 3770
the probability that a majority of trees makes an error decreases, given that the trees perform better than ran-dom and that the errors are made independently. The algorithm has often been shown in practice to result in state-of-the-art predictive performance, though this con-dition can only be guaranteed in theory. In this study, each random forest consisted of 500 trees. Another advan-tage of the random forest algorithm is that it produces variable importance, which can be estimated in differ-ent ways, see, e.g., [18]. In this study, Gini importance [24] was used as the variable importance metric, where a high Gini importance indicates that a variable plays a greater role in splitting the data into the defined classes. A Gini importance of zero means that a variable is con-sidered useless or is never selected to build any tree in the forest.
The generated predictive models were evaluated via stratified 5-fold cross validation with 2 iterations. Perfor-mance evaluation metrics were accuracy, area under the ROC curve (AUC) and area under the precision-recall curve (AUPRC). Accuracy measures the percentage of correct predictions including both positive and negative ones. A ROC curve represents the relation between sen-sitivity (recall) and specificity, where the former measures how many of the positive examples have been identified
as being positive and the latter measures how many of the negative examples have been identified as being neg-ative. AUC depicts the performance of a model without regard to class distribution or error costs by estimating the probability that a model ranks a randomly chosen posi-tive example ahead of a negaposi-tive one. Both sensitivity and specificity are irrespective of the actual positive/negative balance on the test set; therefore, AUC is not biased in the case of a skewed class distribution. Finally, AUPRC repre-sents the relation between precision and recall, depicting the probability that precision is higher than recall for each recall threshold. Since, precision measures how many of the examples been identified as being positive are true positive, and hence this score depends on how rare is the positive class. Therefore, AUPRC is preferred when the positive class is rare but of greater interest than the negative class.
Results
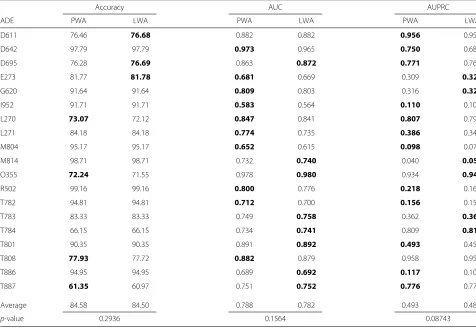
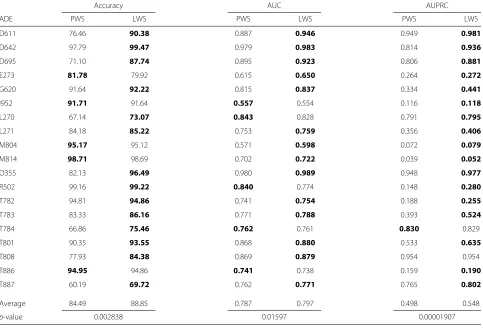
In this study, the scheme of learning temporal weights of clinical events, including two ways of applying the learned weights, i.e.,Weighted AggregationandWeighted Sampling, was evaluated. The former aggregates the same clinical event from different time windows in accordance to the learned weights, while the latter exploits the learned weights as sampling probabilities of the clinical events when constructing each tree in the random forest. In both strategies, the use of learned weights is compared to the use of pre-assigned weights for each clinical event based on its time stamp in relation to the target ADE, i.e., the number of days between the two events, respectively. Table 2 lists the results of comparing the predictive perfor-mance of the Weighted Aggregation strategy by applying pre-assigned and learned weights on 19 datasets extracted from an EHR database. It is shown that there is no signif-icant difference on the impact of pre-assigning weights or learning weights. Nevertheless, from Table 3, where the corresponding results of the Weighted Sampling strategy are presented, we can see that by learning the tempo-ral weights of clinical events, the predictive performance is significantly improved on all selected performance
metrics. Especially for accuracy and AUPRC, performance is enhanced by about 5 % overall and for some datasets, such as D611, D695 and O355, the improvement is over 10 % on accuracy.
In order to understand why the learned weights in the weighted sampling leads to significant improved perfor-mance compared to the pre-assigned weights, we com-pared the average tree performance and the ensemble (forest) performance for each of them. Figure 2 shows the error rates of average tree and ensemble of all the pro-posed weighting strategies in this study. It is obvious that using learned weights in the weighted sampling (LWS) leads to the strongest trees and consequently the best ensemble, given its lowest error rate. Moreover, if we com-pare the difference between the average tree performance and the ensemble performance for each of the weight-ing strategies, both strategies usweight-ing learned weights yield bigger differences than using pre-assigned weights. It is interesting to note that, in the weighted aggregation strat-egy, the ensemble performance when using preassigned weights (PWS) is comparable to using learned weights (LWA), even if the average tree quality is higher in the former.
Table 2Predictive performance of models using pre-assigned (P) or learned (L) weights in the weighted aggregation (WA) strategy
Accuracy AUC AUPRC
ADE PWA LWA PWA LWA PWA LWA
D611 76.46 76.68 0.882 0.882 0.956 0.954
D642 97.79 97.79 0.973 0.965 0.750 0.688
D695 76.28 76.69 0.863 0.872 0.771 0.768
E273 81.77 81.78 0.681 0.669 0.309 0.323
G620 91.64 91.64 0.809 0.803 0.316 0.326
I952 91.71 91.71 0.583 0.564 0.110 0.107
L270 73.07 72.12 0.847 0.841 0.807 0.793
L271 84.18 84.18 0.774 0.735 0.386 0.342
M804 95.17 95.17 0.652 0.615 0.098 0.075
M814 98.71 98.71 0.732 0.740 0.040 0.050
O355 72.24 71.55 0.978 0.980 0.934 0.942
R502 99.16 99.16 0.800 0.776 0.218 0.168
T782 94.81 94.81 0.712 0.700 0.156 0.152
T783 83.33 83.33 0.749 0.758 0.362 0.363
T784 66.15 66.15 0.734 0.741 0.809 0.811
T801 90.35 90.35 0.891 0.892 0.493 0.458
T808 77.93 77.72 0.882 0.879 0.958 0.958
T886 94.95 94.95 0.689 0.692 0.117 0.109
T887 61.35 60.97 0.751 0.752 0.776 0.773
Average 84.58 84.50 0.788 0.782 0.493 0.482
p-value 0.2936 0.1564 0.08743
Table 3Predictive performance of models using pre-assigned (P) or learned (L) weights in the weighted sampling (WS) strategy
Accuracy AUC AUPRC
ADE PWS LWS PWS LWS PWS LWS
D611 76.46 90.38 0.887 0.946 0.949 0.981
D642 97.79 99.47 0.979 0.983 0.814 0.936
D695 71.10 87.74 0.895 0.923 0.806 0.881
E273 81.78 79.92 0.615 0.650 0.264 0.272
G620 91.64 92.22 0.815 0.837 0.334 0.441
I952 91.71 91.64 0.557 0.554 0.116 0.118
L270 67.14 73.07 0.843 0.828 0.791 0.795
L271 84.18 85.22 0.753 0.759 0.356 0.406
M804 95.17 95.12 0.571 0.598 0.072 0.079
M814 98.71 98.69 0.702 0.722 0.039 0.052
O355 82.13 96.49 0.980 0.989 0.948 0.977
R502 99.16 99.22 0.840 0.774 0.148 0.280
T782 94.81 94.86 0.741 0.754 0.188 0.255
T783 83.33 86.16 0.771 0.788 0.393 0.524
T784 66.86 75.46 0.762 0.761 0.830 0.829
T801 90.35 93.55 0.868 0.880 0.533 0.635
T808 77.93 84.38 0.869 0.879 0.954 0.954
T886 94.95 94.86 0.741 0.738 0.159 0.190
T887 60.19 69.72 0.762 0.771 0.765 0.802
Average 84.49 88.85 0.787 0.797 0.498 0.548
p-value 0.002838 0.01597 0.00001907
Bold indicates winning
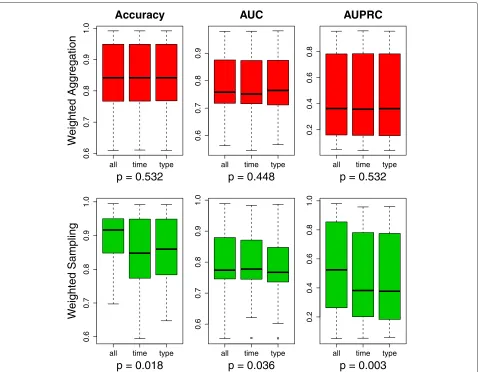
In the last experiment, we investigated the impact of the granularity of temporal weights learning, where three specificity levels were evaluated: (1) weights learned on a time-window level; (2) weights learned on an event-type level within each time window; and (3) weights learned on an individual level from each event type within each time window. Comparing the predictive performance of models exploiting weights from these three specificity lev-els in Fig. 3, we can see that the choice of specificity level has a significant impact on the predictive perfor-mance in the Weighted Sampling strategy, but no such significance is observed in the Weighted Aggregation strategy.
The post-hoc analysis through the Bergmann-Hommel procedure, as shown in Table 4, indicates that, overall, learning weights on each individual clinical event level (all) yields better performance compared to the other two more general levels; learning weights on each individual clinical event level (all) leads to significantly improved accuracy and AUPRC compared to learning weights per event type from each time window (type); the difference between learning weights per event type and per time window is almost negligible.
Discussion
This study evaluated the impact of learning temporal weights of clinical events, which was applied through two strategies, weighted aggregation and weighted sam-pling, in electronic health records for adverse drug event detection. The evaluation was done by exploiting these
LWA LWS PWA PWS
Average Tree Ensemble
Weighting Strategies
Error Rates
0.00
0.05
0.10
0.15
0.20
all time type
0.6
0.7
0.8
0.9
1.0
Accuracy
p = 0.532
W
eighted Aggregation
all time type
0.6
0.7
0.8
0.9
AUC
p = 0.448
all time type
0.2
0.4
0.6
0.8
AUPRC
p = 0.532
all time type
0.6
0.7
0.8
0.9
1.0
p = 0.018
W
eighted Sampling
all time type
0.6
0.7
0.8
0.9
1.0
p = 0.036
all time type
0.2
0.4
0.6
0.8
1.0
p = 0.003
Fig. 3Compare weights learned on different specificity levels in terms of predictive performance.Greenindicates a significant difference andred
indicates no significance.P-values are obtained via a Friedman test
strategies to generate features on 19 datasets extracted from an EHR database. The results show that in the weighted sampling strategy, using learned weights signifi-cantly improves the predictive performance compared to using pre-assigned weights; however, there is no signifi-cant difference between them in the weighted aggregation strategy. One explanation for the latter could be the high sparsity of the data. All of the 19 datasets in this study are of high dimensionality and sparsity due to the fact
that most clinical events only occurred to a small group of patients, i.e., the vast majority of the examples for a given feature have a value of zero. For features with only one or very few non-zero values, the impact of applying differ-ent weighting strategies is almost negligible, even though some of these features might be valuable indicators. To be more specific, if a feature has only one or a few non-zero values, when using it as an indicator to classify the examples, it does not matter whether these small numbers
Table 4Post-hoc analysis results of significance testing on pair-wised comparisons among different weights specificity levels in the
weighted sampling strategy
Accuracy AUC AUPRC
ADE all type time all type time all type time
all – 0.052 0.045 – 0.028 0.746 – 0.002 0.144
type – – 0.626 – – 0.028 – – 0.052
of non-zero values are weighted or not since they will most likely be distinguished against all the zero values; as a result, the applied weights will have almost no impact on the predictive performance. In the weighted aggrega-tion strategy, the learned weights were embedded in the feature values, which does not affect the sparsity; there-fore, for very sparse features, no matter how their weights change, their contribution to the predictive performance will not be influenced. However, in the weighted sam-pling strategy, the learned weights were used as samsam-pling probabilities, which makes use of the higher weighted, i.e., more informative, features more often, so that the weights have a higher and more direct impact on the predictive performance.
Besides the difference between the learned weights and the pre-assigned weights within each strategy, the weighted sampling strategy only leads to better predic-tive performance than the weighted aggregation strategy when using learned weights, i.e., the choice of strategy on applying the weights matters less with the pre-assigned weights (given the close results between PWA and PWS). This indicates that the improved predictive performance is a result of the combination of learning weights and application of the weighted sampling strategy. To under-stand more deeply how the performance is improved, we looked into the random forest models in terms of average tree quality and diversity. The results in Fig. 2 indicates that using learned weights in the weighted sam-pling strategy yields the best predictive performance due both to better individual tree quality and larger diver-sity. Moreover, learning weights also contributes to bigger diversity in the weighted aggregation strategy. Compar-ing learnCompar-ing weights in both the weighted aggregation (LWA) and weighted sampling (LWS) strategy, it seems that the latter does not result in a lower diversity as one would have expected, given that, there, the important fea-tures appear in many trees. It is probably due to the high dimensionality of all the datasets and, more importantly, an indication that a really small portion of features are relevant/important; hence, even though this small num-ber of important features appear in many trees, the diver-sity is still maintained by the other features that are selected to build each tree. Therefore, weighted sampling using learned weights is particularly beneficial when using vast amounts of clinical events from EHRs for predictive modelling, where probably only a small amount of infor-mation is highly relevant to the predicting target, while the remaining information is less useful.
Another advantage of learning weights, besides taking into account the importance of each clinical event, is that weights can be learned on a more specific level: rather than just looking at the time window, the specificity can be adjusted. Concerning the granularity of weights, pre-assigning weights is equivalent to learning weights per
time window (denoted astimein Fig. 3 and Table 4), both of which assign the same weight to all clinical events from the same time window. Here, within a time window, dif-ferent weights can be learned further for each event type (denoted astype) – i.e., diagnosis, drug and clinical mea-surement – or even each individual clinical event within each event type (denoted as all). Again, the impact of using weights from different specificity levels yields a sig-nificant impact only in the weighted sampling strategy, but not in the weighted aggregation strategy. It is probably a result of the high dimensionality and sparsity of the data as argued above. By looking at the post-hoc analysis results for the pairwise comparisons, we can see that, on one hand, learning weights for each event type gives the worst performance, which suggests that there is no evidence for treating different event types differently; on the other hand, learning weights for each individual clinical event, the most specific level, yields the best performance, which indicates that individual events should not be treated in the same way. For instance, diagnoses in general shouldn’t be more or less important than drugs; however, a particu-lar diagnosis code can be more important than a particuparticu-lar drug. It is interesting to note that it is not that more spe-cific weights learning gives better performance, as one would expect. Weights on thetypelevel are more specific than the ones on thetimelevel, but the latter sometimes outperforms the former.
One limitation of this study is that only one learn-ing weights algorithm, namely random forest’s variable importance, is explored. In future work, other methods are worth investigating; for example, methods that do not use feedback from a classifier to assign weights but use a pre-existing model instead, such as information gain. Further along this line, learning weights here focuses on temporality and informativeness of the clinical events; nevertheless, there are also other criteria that can be used to learn the weights. For example, clinical events are rep-resented as the number of times that they occur in a time window, which disallows learning weights based on event values and/or how sharply an event value changes over time. This is especially crucial when using clinical measurements as features.
Conclusion
account their importance, in terms of informativeness, when building the predictive models. To mitigate this problem, this study focuses on how to learn the weights automatically when constructing the predictive models in a way that reflects both temporality and importance of the clinical events. To take into account the temporality, each patient’s medical history is segmented into a set of time windows and features are extracted from each of them; for the importance, a random forest model is built using these extracted features to produce variable importance, which is then used as the weight for each feature. To apply these weights, two strategies are proposed: weighted aggrega-tion and weighted sampling. The former aggregates the weighted clinical events from different time windows to form new features, while the latter keeps the original fea-tures but samples them with their weights as probabilities when building each tree in the forest. We conclude here that learning weights is significantly beneficial in terms of predictive performance in the weighted sampling strat-egy. Moreover, weighted aggregation generally diminishes the impact of temporal weighting of the clinical events, irrespective of whether the weights are pre-assigned or learned.
Acknowledgements
This work was partly supported by the project High-Performance Data Mining for Drug Effect Detection at Stockholm University, funded by Swedish Foundation for Strategic Research under grant IIS11-0053.
Declarations
Publication costs for this article were funded by the project High-Performance Data Mining for Drug Effect Detection at Stockholm University. This article has been published as part ofBMC Medical Informatics and Decision MakingVol 16 Suppl 2 2016: Selected articles from the IEEE International Conference on Bioinformatics and Biomedicine 2015: medical informatics and decision making. The full contents of the supplement are available online at http:// bmcmedinformdecismak.biomedcentral.com/articles/supplements/volume-16-supplement-2.
Authors’ contributions
JZ initiated the idea of this study. JZ and AH participated in discussions on the study design. JZ and AH conducted the experiments. JZ created a draft of the manuscript. AH commented on the draft. Both authors read and approved the final manuscript.
Competing interests
The authors declare that they have no competing interests.
Published: 21 July 2016
References
1. Schneeweiss S, Hasford J, Göttler M, Hoffmann A, Riethling AK, Avorn J. Admissions caused by adverse drug events to internal medicine and emergency departments in hospitals: a longitudinal population-based study. Eur J Clin Pharmacol. 2002;58(4):285–91.
2. Pirmohamed M, James S, Meakin S, Green C, Scott AK, Walley TJ, Farrar K, Park BK, Breckenridge AM. Adverse drug reactions as cause of admission to hospital: prospective analysis of 18 820 patients. BMJ. 2004;329(7456):15–19.
3. Mjörndal T, Boman MD, Hägg S, Bäckström M, Wiholm BE, Wahlin A, Dahlqvist R. Adverse drug reactions as a cause for admissions to a department of internal medicine. Pharmacoepidemiol Drug Saf. 2002;11(1):65–72.
4. Härmark L, Van Grootheest A. Pharmacovigilance: methods, recent developments and future perspectives. Eur J Clin Pharmacol. 2008;64(8): 743–52.
5. Schuemie MJ, Coloma PM, Straatman H, Herings RM, Trifirò G, Matthews JN, Prieto-Merino D, Molokhia M, Pedersen L, Gini R, et al. Using electronic health care records for drug safety signal detection: a comparative evaluation of statistical methods. Med Care. 2012;50(10): 890–7.
6. Harpaz R, Haerian K, Chase HS, Friedman C. Mining electronic health records for adverse drug effects using regression based methods. In: 1st ACM International Health Informatics Symposium. ACM; 2010. p. 100–7. 7. Hazell L, Shakir SA. Under-reporting of adverse drug reactions. Drug Saf.
2006;29(5):385–96.
8. Zhao J, Henriksson A, Asker L, Boström H. Detecting adverse drug events with multiple representations of clinical measurements. In: IEEE International Conference on Bioinformatics and Biomedicine. IEEE; 2014. p. 536–43.
9. Zhao J, Henriksson A, Boström H. Detecting adverse drug events using concept hierarchies of clinical codes. In: IEEE International Conference on Healthcare Informatics. IEEE; 2014. p. 285–93.
10. Henriksson A, Zhao J, Boström H, Dalianis H. Modeling heterogeneous clinical sequence data in semantic space for adverse drug event detection. In: IEEE International Conference on Data Science and Advanced Analytics. IEEE; 2015.
11. Zhao J, Henriksson A, Boström H. Cascading adverse drug event detection in electronic health records. In: IEEE International Conference on Data Science and Advanced Analytics. IEEE; 2015.
12. Henriksson A, Kvist M, Dalianis H, Duneld M. Identifying adverse drug event information in clinical notes with distributional semantic representations of context. J Biomed Inform. 2015;57:333–49. 13. Henriksson A. Representing clinical notes for adverse drug event
detection. In: 6th International Workshop on Health Text Mining and Information Analysis (LOUHI). Association for Computational Linguistics; 2015. p. 152–8.
14. Henriksson A, Zhao J, Boström H, Dalianis H. Modeling electronic health records in ensembles of semantic spaces for adverse drug event detection. In: IEEE International Conference on Bioinformatics and Biomedicine. IEEE; 2015.
15. Singh A, Nadkarni G, Gottesman O, Ellis SB, Bottinger EP, Guttag JV. Incorporating temporal ehr data in predictive models for risk stratification of renal function deterioration. J Biomed Inform. 2015;53:220–8. 16. Zhao J, Henriksson A, Kvist M, Asker L, Boström H. Handling temporality
of clinical events for drug safety surveillance. In: American Medical Informatics Association (AMIA) Annual Symposium. American Medical Informatics Association; 2015.
17. Zhao J. Temporal weighting of clinical events in electronic health records for pharmacovigilance. In: IEEE International Conference on
Bioinformatics and Biomedicine (BIBM). IEEE; 2015. p. 375–81. 18. Breiman L. Random forests. Mach Learn. 2001;45(1):5–32. 19. Amaratunga D, Cabrera J, Lee YS. Enriched random forests.
Bioinformatics. 2008;24(18):2010–014.
20. Dalianis H, Hassel M, Henriksson A, Skeppstedt M. Stockholm epr corpus: a clinical database used to improve health care. In: Swedish Language Technology Conference; 2012.
21. Stausberg J, Hasford J. Drug-related admissions and hospital-acquired adverse drug events in germany: a longitudinal analysis from 2003 to 2007 of icd-10-coded routine data. BMC Health Serv Res. 2011;11(1):134. 22. Kuncheva LI, Whitaker CJ. Measures of diversity in classifier ensembles
and their relationship with the ensemble accuracy. Mach Learn. 2003;51(2):181–207.
23. Krogh A, Vedelsby J. Neural network ensembles, cross validation, and cctive learning. In: Advances in Neural Information Processing Systems. Cambridge MA: MIT Press; 1995. p. 231–8.
24. Strobl C, Boulesteix AL, Zeileis A, Hothorn T. Bias in random forest variable importance measures: Illustrations, sources and a solution. BMC Bioinforma. 2007;8(1):25.
25. Demšar J. Statistical comparisons of classifiers over multiple data sets. J Mach Learn Res. 2006;7:1–30.