R E S E A R C H
Open Access
Glucose tolerance status is a better predictor of
diabetes and cardiovascular outcomes than
metabolic syndrome: a prospective cohort study
Camila Furtado de Souza
1,2, Mériane Boeira Dalzochio
2, Francisco Jorge Arsego de Oliveira
1, Jorge Luiz Gross
2and Cristiane Bauermann Leitão
2*Abstract
Backround:To evaluate the importance of oral glucose tolerance test (OGTT) in predicting diabetes and cardiovascular disease in patients with and without Metabolic Syndrome from a population treated in a primary care unit.
Research design and methods:A prospective cohort study was conducted with subjects regularly attending the primary care unit of Hospital de Clínicas de Porto Alegre. Participants underwent a 75 g OGTT. Metabolic syndrome definition was based on the criteria of IDF/AHA/NHLBI-2010.
Results:Participants mean age was 61 ± 12 years (males: 38%; whites: 67%). Of the 148 subjects included, 127 (86%) were followed for 36 ± 14 months, 21 (14%) were lost. Subjects were classified into four groups based on baseline OGTT: 29% normal (n = 43), 28% impaired fasting glucose (IFG; n = 42), 26% impaired glucose tolerance (IGT; n = 38), and 17% diabetes (n = 25). Metabolic syndrome prevalence was lower in normal group (28%), intermediate in IFG (62%) and IGT (65%) groups, and higher among subjects with diabetes (92%; P<0.001). Incidence of diabetes increased along with the stages of glucose metabolism disturbance (normal: 0%, IFG: 16%, IGT: 28%; P = 0.004). No patient with normal OGTT developed diabetes, regardless metabolic syndrome presence. Diabetes at baseline was the major determinant of cardiovascular disease occurrence (normal: 0%, IFG: 4%, IGT: 0%, diabetes: 24%; P = 0.001). In Cox-regression analysis, only the 2 h OGTT results were associated with diabetes (OR = 1.03; 95%CI 1.01–1.06; P <0.001) and cardiovascular disease development (OR = 1.013; 95%CI 1.002–1.025; P = 0.024).
Conclusions:In this sample of subjects undergoing diabetes screening, the OGTT predicted diabetes and cardiovascular disease more effectively than the metabolic syndrome status.
Keywords:impaired fasting glucose, impaired glucose tolerance, type 2 diabetes, metabolic syndrome, cardiovascular disease
Background
Hyperglycemia is a well-known risk factor for micro-and macrovascular disease [1] micro-and is associated with increased morbidity and mortality [2,3]. Alterations on glucose homeostasis have been described preceding
dia-betes mellitus (DM) diagnosis, and are known as “
pre-diabetes”. Prediabetes comprises two subcategories,
impaired fasting glucose (IFG) and impaired glucose tol-erance (IGT), classified based on glucose levels at fasting and after a glucose challenge (oral glucose tolerance test; OGTT) [4]. Both conditions are associated with increased risk for DM [5,6]. Prediabetes is a risk factor for cardiovascular events [7] and, recently, IGT has been associated with microvascular disease, retinopathy and microalbuminuria, conditions traditionally attributed to DM [8-13].
Metabolic Syndrome (MetS), a cluster of cardiovascu-lar risk factors characterized by insulin resistance, ab-dominal obesity, dyslipidemia and hypertension, is * Correspondence:crisbleitao@yahoo.com.br
2Endocrine Division of Hospital de Clínicas de Porto Alegre, Universidade
Federal do Rio Grande do Sul, Rua Ramiro Barcelos 2350, Prédio 12, 4° andar, 90035-003 Porto Alegre, RS, Brazil
Full list of author information is available at the end of the article
associated with coronary heart disease, leading to increased cardiovascular and total mortality [14,15]. Patients with type 2 DM have a higher prevalence of MetS (85% vs. 24% in general population) [16,17] and the aggregation of MetS components amplifies the risk for micro- and macrovascular complications [17].
Because both prediabetes and MetS are risk factors for DM and cardiovascular disease (CVD), it is likely that the two conditions coexist in the same individuals. However, only a few studies have evaluated this association [18,19]. In addition, it is not known if the categorization of the patients based on OGTT results would predict DM and CVD development better than the presence of MetS.
Therefore, the aim of this study was to evaluate the im-portance of OGTT results in predicting DM and CVD development in patients with and without MetS from a population at risk for type 2 DM treated in a primary care unit.
Research design and methods Patients
A prospective cohort study was performed with 148 patients with abnormal fasting plasma glucose (FPG)
values (100 – 125 mg/dl), during a DM screening test.
The criteria to participate in the screening was based on American Diabetes Association (ADA) recommenda-tions: age≥45 years old, body mass index (BMI)≥25 kg/ m2, hypertension, dyslipidemia, polycystic ovarian syn-drome, family history of type 2 DM in a 1stdegree rela-tive, previous personal history of gestational DM or fetal macrosomia, IFG or IGT in previous testing, and history of cardiovascular disease [20]. All subjects underwent an OGTT at baseline with 75 g of glucose; fasting and 2 h plasma glucose levels were measured. Subjects were evaluated by the researchers twice in the Primary Care Unit Santa Cecília/Hospital de Clínicas de Porto Alegre: first in the period between January and December 2005;
and then between January and February 2010 patient’s
charts were reevaluated to identify those who progressed to DM and/or developed CVD. The study protocol was approved by the Research Ethics Committee of Hospital de Clínicas de Porto Alegre.
Baseline assessments
Clinical (age, gender, ethnicity, family history of type 2 DM, history of hypertension and blood pressure levels,
smoking and physical activity), anthropometrical
(weight, height, and waist circumference), and laborator-ial data (screening fasting glucose, OGTT: fasting and 2 h post-challenge glucose levels, creatinine and lipid profile) were recorded from patients charts. The office blood pressure was measured with an aneroid sphygmo-manometer with the patient in a sitting position, after a 5-min rest. The waist circumference was measured at
the midpoint between the iliac crest and the lower costal edge, and the BMI (weight/height2) was also calculated [21]. The 10-year cardiovascular risk was estimated by Framingham risk score [22].
Definitions
The glucose status was classified at baseline, and 4 cat-egories were created according to fasting and 2 h OGTT
results: normal (FPG <100 mg/dl and 2 h glucose
<140 mg/dL), IFG (FPG between 100 and 125 mg/dl,
and 2 h glucose <140 mg/dL), IGT (FPG ≤125 mg/dL
and 2 h glucose between 140 and 199 mg/dL) and DM
(FPG ≥126 mg/dL or 2 h glucose ≥200 mg/dL) [20].
Patients in the normal group had an abnormal fasting plasma glucose during the screening (values between 100 and 125 mg/dL), but it was not confirmed by the OGTT results.
Definition of MetS was based on the unified criteria of International Diabetes Federation/American Heart Asso-ciation/National Heart, Lung, and Blood Institute [23]. Patients with 3 or more of the following factors were
considered with MetS: fasting glucose ≥100 mg/dL (or
drug treatment for diabetes), triglycerides levels
≥150 mg/dL (or drug treatment for elevated
triglycer-ides), HDL cholesterol level <40 mg/dL in men and
<50 mg/dL in women (or drug treatment for low HDL),
systolic blood pressure (SBP) ≥130 mmHg and/or
dia-stolic blood pressure (DBP) ≥85 mmHg (or
antihyper-tensive drug treatment), and waist circumference
>94 cm in men and>80 cm in women.
The development of DM was defined as: FPG
≥126 mg/dL or 2-h plasma glucose ≥200 mg/dL during
an OGTT or a random plasma glucose ≥200 mg/dL in
the presence of classic symptoms of hyperglycemia or hyperglycemic crisis [20]. In the absence of unequivocal hyperglycemia, criteria 1 and 2 were confirmed by repeat testing. The cardiovascular outcome was considered the combination of cardiovascular death, nonfatal myocar-dial infarction, nonfatal stroke, congestive heart failure, angina with documented myocardial ischemia, and non-traumatic lower limb amputation.
Laboratory methods
Fasting and 2 h glucose levels were measured by hexoki-nase method. Serum creatinine was measured by Jaffe method, and lipid profile by enzymatic colorimetric method. LDL-cholesterol was calculated using Friede-wald's equation, for samples with triglycerides levels of <400 mg/dL [24].
Statistical analysis
(percentage). Student t test was used to compare con-tinuous variables. Variables with non-normal distribu-tion were log transformed. Chi-square test, with residual analysis, was used to compare categorical variables. One-way analysis of variance (ANOVA) with Tukey's post-hoc test was used for continuous variables. Kaplan-Meier curves (Log-Rank test) were used to assess the
risk of development of DM and CVD and Cox’s
regres-sion analysis was employed to adjust the results to vari-ables related to DM and CVD pathogenesis. A P value <0.05 (two-tailed) was considered significant. This sam-ple had >90% of power to detect differences in risk for DM and was not powered for CVD development.
Results
Baseline characteristics
A total of 148 patients [men: n = 57 (38%); white: n = 99 (67%)] were included. According to OGTT results, 29% (n = 43) of the patients had normal blood sugar, 28% (n = 42) had IFG, 26% (n = 38) had IGT (8 isolated IGT; 30 IGT combined with IFG) and 17% (n = 26) had DM.
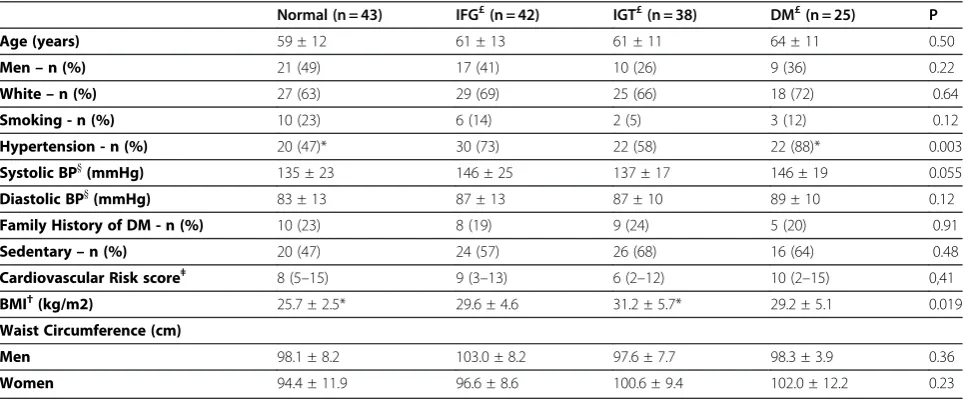
Clinical and laboratory characteristics of patients, according to OGTT categories, are presented in Tables 1 and 2, respectively. No differences regarding age, gender, ethnicity, family history of type 2 DM, smoking and sedentarism, as well as lipid profile and creatinine levels, were found among groups. Hypertension prevalence was higher in subjects with DM (88.0% vs. 47%, P = 0.003), and BMI values were higher in IGT group (31.2 ± 5.7 vs. 25.7 ± 2.5 kg/m2, P = 0.019), in comparison with the nor-mal group. Fasting plasma glucose values increased along
with the categories of impaired glucose metabolism (nor-mal: 92 ± 5; IFG: 109 ± 6; IGT: 108 ± 11, and DM: 123 ± 15 mg/dl; P<0.001), but this variable could not differen-tiate the two subcategories of prediabetes.
All groups had comparable and low cardiovascular risk scores [normal: 8 (5–15) vs. IFG: 9 (3–13) vs. IGT: 6 (2–12) vs. DM: 10 (2–15)%/10 years; P = 0.41]. In op-position, the prevalence of MetS was lower in the nor-mal glucose group, similar in the two classes of prediabetes, and higher in DM group [normal: n = 12
Table 1 Clinical characteristics of patients according to oral glucose tolerance test groups
Normal (n = 43) IFG£(n = 42) IGT£(n = 38) DM£(n = 25) P
Age (years) 59 ± 12 61 ± 13 61 ± 11 64 ± 11 0.50
Men–n (%) 21 (49) 17 (41) 10 (26) 9 (36) 0.22
White–n (%) 27 (63) 29 (69) 25 (66) 18 (72) 0.64
Smoking - n (%) 10 (23) 6 (14) 2 (5) 3 (12) 0.12
Hypertension - n (%) 20 (47)* 30 (73) 22 (58) 22 (88)* 0.003
Systolic BP}(mmHg) 135 ± 23 146 ± 25 137 ± 17 146 ± 19 0.055
Diastolic BP}(mmHg) 83 ± 13 87 ± 13 87 ± 10 89 ± 10 0.12
Family History of DM - n (%) 10 (23) 8 (19) 9 (24) 5 (20) 0.91
Sedentary–n (%) 20 (47) 24 (57) 26 (68) 16 (64) 0.48
Cardiovascular Risk scoreǂ 8 (5–15) 9 (3–13) 6 (2–12) 10 (2–15) 0,41
BMI†(kg/m2) 25.7 ± 2.5* 29.6 ± 4.6 31.2 ± 5.7* 29.2 ± 5.1 0.019
Waist Circumference (cm)
Men 98.1 ± 8.2 103.0 ± 8.2 97.6 ± 7.7 98.3 ± 3.9 0.36
Women 94.4 ± 11.9 96.6 ± 8.6 100.6 ± 9.4 102.0 ± 12.2 0.23
Data expressed in mean ± standard deviation, number of cases (%) and median (interquartile interval).
£
Oral glucose tolerance test groups: IFG impaired fasting glucose, IGT impaired glucose tolerance, DM diabetes mellitus. }BP blood pressure,†BMI body mass index,ǂFramingham Score: cardiovascular risk in ten years.
*Difference between groups.
Table 2 Laboratory characteristics of patients according to oral glucose tolerance test groups
Normal (n = 43)
IFG£
(n = 42) IGT£
(n = 38) DM£
(n = 25) p
Fasting Plasma Glucose (mg/dL)
92 ± 5* 109 ± 6 108 ± 11 123 ± 15* 0.001
2 hour Plasma Glucose (mg/dL)
96 ± 24* 117 ± 16* 161 ± 17* 239 ± 37* <0.001
Total Cholesterol (mg/dL)
209 ± 43 218 ± 47 203 ± 33 209 ± 49 0.51
HDL- Cholesterol (mg/dL)
49 ± 11 52 ± 13 47 ± 11 46 ± 10 0.18
Triglycerides (mg/dL)
164 ± 172 151 ± 68 174 ± 99 195 ± 104 0.52
LDL- Cholesterol (mg/dL)
130 ± 35 135 ± 43 123 ± 29 124 ± 44 0.48
Creatinine (mg/dL)
0.96 ± 0.17 0.96 ± 0.24 0.94 ± 0.17 0.96 ± 0.31 0.97
Data expressed in mean ± standard deviation.
£
Oral glucose tolerance test groups: IFG impaired fasting glucose, IGT impaired glucose tolerance, DM diabetes mellitus.
(28%); IFG: n = 26 (62%); IGT: n = 24 (65%) and DM: n = 24 (92%), P<0.001].
Follow-up results
Patients were followed for an average of 37 ± 14 months, and 21 subjects were lost from follow-up (14%). One-hundred patients without DM and 110 without CVD at baseline completed the study, providing data for DM and CVD incidence, respectively. Lifestyle modifications were recommended for all patients with DM, 91% (n = 29) of those with IFG, and 94% (n = 30) of those with IGT. Metformin was used for DM prevention in 3% (n = 1) of patients with IFG and 12% (n = 4) of those with IGT.
No patient with normal OGTT developed DM during the observational period, while 5 (16%) subjects with IFG and 9 (28%) with IGT did (Figure 1A; P log-rank = 0.005; with statistical differences among all groups in the chi-squared residual analysis). As expected, indivi-duals with the MetS had a higher incidence of DM, in comparison with those without (with MetS: 19% vs. without MetS: 8.5%; P log-rank = 0.032). However, the glucose status was a better predictor of DM develop-ment (Figure 1B), since no patient with normal OGTT developed DM, regardless the presence of MetS. Inter-estingly, in patients without MetS, the incidence of DM was comparable in both groups of prediabetes (normal: 0%, IFG: 18% and IGT: 18%; P = 0.045), while in those with MetS the incidence was higher in the IGT group (normal: 0%, IFG: 14% and IGT: 33%; P = 0.018). In
Cox-regression analysis, FPG (OR = 1.08; 95%CI 1.02–1.14;
p <0.001) and 2 h plasma glucose (OR = 1.04; 95%CI
1.02–1.06; p <0.001) were associated with the develop-ment of DM, even after adjustdevelop-ment for age, ethnicity and waist circumference or BMI. When fasting and 2 h plasma glucose were included in the same model simul-taneously, only 2 h plasma glucose remained associated
with DM development (OR = 1.03; 95%CI 1.01–1.06;
p <0.001). Similarly when fasting and 2-hour plasma
glucose were adjusted for individual MetS components, only the 2 hour value was associated with DM develop-ment. As metformin is known to decrease DM inci-dence, patients on this medication during the follow-up were excluded from analysis and no modifications was observed in results (data not shown).
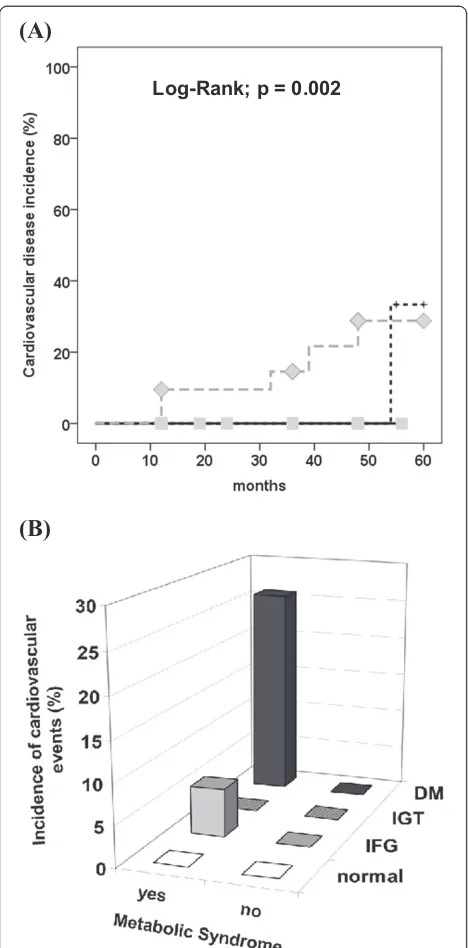
Four percent of the patients (n = 6) developed CVD during the follow up. The incidence of CVD was signifi-cantly higher among patients with DM at baseline
(nor-mal: 0%, IFG: 4%, IGT: 0% and DM: 24%; P <0.001)
(Figure 2A). As for DM incidence, MetS was a predictor of CVD development (with MetS: 9.5% vs. without MetS: 0%; P Log Rank = 0.027), and it seems that this associ-ation can be explained by the coexistence of DM at baseline OGTT (Figure 2B). In the multivariate analysis,
only the 2 h plasma glucose values were associated with
CVD (OR = 1.013; 95%CI 1.002–1.025; P = 0.024), while
the FPG lost its association, after adjustments for age, gender, presence of hypertension, total cholesterol and smoking, or for MetS components.
(A)
(B)
Log-Rank; p = 0.005
Discussion
In this sample of subjects from a primary care unit under-going DM screening, the glucose status categorization based on OGTT results was a better predictor for the
development of DM than the presence of MetS. The 2 hour value seemed more important than the fasting one in determining DM incidence and in predicting CVD.
Both IFG and IGT were risk factors for DM, as it has been reported in previous studies [5,6]. In our cohort, the DM incidence was higher in subjects with IGT in comparison with those with IFG, probably because the majority of subjects belonging to IGT had also IFG, since a screening FPG between 100 and 125 mg/dl was the inclusion criterion of the study. The coexistence of both glucose abnormalities has been formerly described as a stronger risk factor for DM development than each condition isolated [6]. Nevertheless, based on our results and others [25,26] the post-glucose challenge values seem to be more relevant than the fasting values in pre-dicting DM.
Regarding CVD development, DM was the major risk factor, as it has been already well established [27-29]. In our study, participants who developed CVD had both DM and MetS. Liu et al. also found that increased CVD risk in individuals with IFG or diabetes was largely driven by the coexistence of multiple metabolic disor-ders rather than hyperglycemia per se [30]. Nevertheless, Hadaegh et al. described that MetS did not add to DM to predict incident CVD in Iranian population [31].
Recently, a meta-analysis showed that IFG and IGT are also associated with a mild increment in the risk for CVD [7]. We could not confirm these findings, since our study was not powered to detect CVD incidence dif-ferences. Our results are in accordance with DECODE [25] study, in which the 2 h glucose was a better pre-dictor for CVD than fasting glucose.
Our results confirm the higher prevalence of MetS in prediabetes individuals in comparison to those with normal glucose values reported in Japanese and Ger-man samples [18,19]. However, in both studies predia-betes was considered as a unique group, and this is the first study reporting the MetS prevalence in separate strata of prediabetes (IFG and IGT). On the other hand, the prevalence of MetS in the DM group from the present cohort was high, and similar to previous studies conducted in patients with clinically recognized type 2 DM [17]. This finding was unexpected, since the sub-jects included in this study had mild and early DM, diagnosed based on OGTT results, and a lower cardio-vascular risk profile, in comparison with patients with well-established DM.
The presence of MetS was also associated with DM development, but the glucose status identified indivi-duals at higher risk more efficiently, since no patient, despite the MetS status, developed DM if their OGTT values were normal. These results are in accordance to previous studies who described that diagnosis of the MetS did not confer increased risk for incident diabetes,
(A)
(B)
Log-Rank; p = 0.002
independent of its individual components [32]. Thus, the use of OGTT correctly predicts DM development, and were more efficient than categorization based on MetS presence. Similarly to the results for DM inci-dence, MetS was a predictor of CVD, though DM diag-nosis accounted for almost all the risk observed.
Our results bring up back the discussion about the relevance of the MetS in predicting future cardiovascular events. There is still controversy whether the aggrega-tion of MetS components confers a higher risk for CVD than the simple summation of each risk factor [33]. In the current study, the MetS diagnosis was not better than just one of its components, the glucose tolerance status, in predicting DM and CVD development. Thus, the clinical utility of MetS diagnosis in this scenario can be questioned, and clinical emphasis should be on treat-ing effectively any CVD risk factor that is present [34]. Also, to prevent the metabolic syndrome or prediabetes and its consequences, these risk factors should be diag-nosed and treated early, and this study demonstrates that individuals from a population at risk for having an abnormal glucose metabolism can be predicted, by sim-ple clinical and laboratorial parameters which are avail-able in a primary care setting.
The sample size and the low CVD risk profile of the included patients limited the evaluation of factors asso-ciated with the incidence of CVD. Moreover, the low number of patients with isolated IGT precludes the comparison of this group with those with isolated IFG. The HbA1c values were not available in the beginning of the study, since the use of HbA1c levels for screening or predicting DM was not routine in our center during that time [35].
Conclusion
In conclusion, although the prevalence of MetS increases along with the severity of glucose homeostasis impair-ment, the OGTT results, with emphasis in the 2 h post-challenge values, are the major determinants of DM and CVD development. Our findings reinforce the import-ance of the OGTT in stratifying the risk for DM and CVD development, in patients with or without MetS.
Abbreviations
AHA: American Heart Association; ADA: American Diabetes Association; ANOVA: One- way analysis of variance; BMI: Body mass index; CI: Confidence interval; CVD: Cardiovascular Disease; DBP: Diastolic Blood Pressure; DCCT: Diabetes Control and Complications Trial; DECODE: Diabetes Epidemiology Collaborative analysis of Diagnostic criteria in Europe; DM: Diabetes Mellitus; FPG: Fasting Plasma Glucose; HbA1c: Glycated hemoglobin; IDF: International Diabetes Federation; IFG: Impaired Fasting Glucose; IGT: Impaired Glucose Tolerance; MetS: Metabolic Syndrome; NHLBI: National Heart, Lung, and Blood Institute; OGTT: Oral Glucose Tolerance Test; OR: Odds ratio; SBP: Systolic Blood Pressure.
Competing interests
The authors declare that they have no competing interests.
Acknowledgments
The Authors are grateful to the health care professionals and patients of the primary care unit Santa Cecília/HCPA, Porto Alegre, Brazil, for their support in the conduction of this research. This study was partially sponsored by Fundo de Incentivo à Pesquisa (FIPE) of Hospital de Clínicas de Porto Alegre.
Author details 1
Primary Care, Universidade Federal do Rio Grande do Sul, Porto Alegre, Brasil.2Endocrine Division of Hospital de Clínicas de Porto Alegre, Universidade Federal do Rio Grande do Sul, Rua Ramiro Barcelos 2350, Prédio 12, 4° andar, 90035-003 Porto Alegre, RS, Brazil.
Authors’contributions
CFS, MBD, CBL contributes in execution, analysis, manuscript drafting and critical discussion. FJAO, JLG contributes in study design, analysis, manuscript drafting and critical discussion. All authors read and approved the final manuscript.
Received: 11 March 2012 Accepted: 17 May 2012 Published: 8 June 2012
References
1. Straton IM, Adler AI, Neil HAW, Matthews DR, Manley SE, Cull CA, Hadden D, Turner R, Holman RR:Association of glycaemia with macrovascular and microvascular complications of type 2 diabetes (UKPDS 35): prospective observational study.BMJ2000,321:405–412.
2. Coutinho M, Gerstein HC, Wang Y, Yusuf S:The relationship between glucose and incident cardiovascular events. A metaregression analysis of published data from 20 studies of 95,783 individuals followed for 122.4 years.Diabetes Care1999,22:233–240.
3. Levitan EB, Song Y, Ford ES, Liu S:Is nondiabetic hyperglycemia a risk factor for cardiovascular disease? A meta-analysis of prospective studies. Arch Intern Med2004,164:2147–2155.
4. Diagnosis and Classification of Diabetes. Position Statement/American Diabetes Association.Diabetes Care2011,34:S62–S69.
5. Gerstein HC, Santaguida P, Raina P, Morrison KM, Balion C, Hunt D, Yazdi H, Booker L:Annual incidence and relative risk of diabetes in people with various categories of dysglycemia: A systematic overview and meta-analysis of prospective studies.Diabetes Res Clin Pract2007,78:305–312. 6. Vegt F, Dekker JM, Jager A, Hienkens E, Kostense PJ, Stehouwer CDA, Nijpels
G, Bouter LM, Heine RJ:Relation of impaired fasting and postload glucose with incident type 2 diabetes in dutch population: The HOORN Study. JAMA2001,285:2109–2113.
7. Ford ES, Zaho G, Li C:Pre-diabetes and the risk for cardiovascular disease. A systematic review of the evidence.JACC2010,55:1310–1317. 8. Singleton JR, Smith AG, Russel JW, Feldman EL:Microvascular
complications of impaired glucose tolerance.Diabetes2003,52:2867–2873. 9. Pan XR, Hu YH, Li GW, Liu PA, Bennett PH, Howard BV:Impaired glucose
tolerance and its relationship to ECG- indicating coronary heart disease and risk factors among Chinese. Da Qing IGT and diabetes study. Diabetes Care1993,16:150–156.
10. Nelson RG, Kunzelman CL, Pettitt DJ, Saad MF, Bennett PH, Knowler WC:Albuminuria in type 2 (non-insulin-dependent) diabetes mellitus and impaired glucose tolerance in Pima Indians.Diabetologia1989, 32:870–886.
11. Metcalf PA, Baker JR, Scragg RKR, Dryson E, Scott AJ, Wild CJ:
Microalbuminuria in a middle-aged workforce. Effect of hyperglycemia and ethnicity.Diabetes Care1993,16:1485–1493.
12. The prevalence of retinopathy in impaired glucose tolerance and recent-onset diabetes in the Diabetes Prevention Program. Diabetes Prevention Program Research Group.Diabet Med2007,24:137–144.
13. Rosenbaum P, Gimeno SG, Sanudo A, Franco LJ, Ferreira SR: Japanese-Brazilian Diabetes Study Group: independent impact of glycemia and blood pressure in albuminuria on high-risk subjects for metabolic syndrome.Clin Nephrol2004,61:369–376.
15. Ford ES, Giles WH, Dietz WH:Prevalence of the metabolic syndrome among U.S. adults: findings from the Third National Health and Nutrition Examination Survey.JAMA2002,287:356–359.
16. Noto D, Barabagallo CM, Cefalu AB, Falletta A, Sapienza M, Cavera, Amato S, Pegano M, Maggiore M, Crroccio A, Notarbartolo A, Averna MR:The metabolic syndrome predicts cardiovascular events in subjects with normal fasting glucose: results of a 15 years follow-up in a Mediterranean population.Atherosclerosis2008,197:147–153. 17. Costa LA, Canani LH, Lisboa HR, Tres GS, Gross JL:Aggregation of
features of the metabolic syndrome is associated with increased prevalence of chronic complications in type 2 diabetes.Diabet Med 2004,21:252–255.
18. Kanauchi M, Kawano T, Kanauchi K, Saito Y:New“Pre-diabetes”category and the metabolic syndrome in Japanese.Horm Metab Res2005, 37:622–626.
19. Schwarz PEH, Bornstein SR:Pre-diabetes and metabolic syndrome in Germans.Horm Metab Res2006,38:359.
20. Standards of Medical Care in Diabetes - 2011. Position Statement/ American Diabetes Association.Diabetes Care2011,34:S11–S61. 21. Grundy SM, Cleeman JI, Daniels SR, Donato KA:Diagnosis and treatment of
metabolic syndrome.Circulation2005,112(17):2735–2752. 22. D’Agostino RB, Vasan RS, Pencina MJ, Wolf PA, Cobain M, Massaro JM,
Kannel WB:General cardiovascular risk profile for use in primary care the Framingham Heart Study.Circulation2008,117:743–753.
23. Alberti KGMM, Eckel RH, Grundy SM, Zimmet PZ, Cleeman JI, Donato JA, Fruchart JC, James WPT, Loria CM, Smith SC:Harmonizing the metabolic syndrome: A joint interim statement of the International Diabetes Federation Task Force on Epidemiology and Prevention; National Heart, Lung, and Blood Institute; American Heart Association; World Heart Federation; International Atherosclerosis Society; and International Association for the Study of Obesity.Circulation2009,120:1640–1645. 24. Cordova CMM, Achneider CR, Juttel ID, Cordova MM:Avaliação da
dosagem direta do colesterol-LDL em amostras de sangue de 10.664 pacientes em comparação com o uso da fórmula de Friedewald.Arq Bras Cardiol2004,83:476–481.
25. Glucose tolerance and mortality: comparison of WHO and American Diabetes Association criteria- The DECODE study group.Lancet1999, 354:617–621.
26. Abdul-Ghani MA, Williams K, DeFronzo R, Stern M:Risk of progression to type 2 diabetes based on relationship between postload plama glucose and fasting plasma glucose.Diabetes Care2006,29:1613–1618. 27. Diabetes Control and Complications Trial/Epidemiology of Diabetes
Interventions and Complications (DCCT/EDIC) Study Research Group: Intensive diabetes treatment and cardiovascular disease in patients with type 1 diabetes.N Engl J Med2005,353:2643–2653.
28. Juutilainen A, Lehto S, Ronnemaa T, Pyorala K, Laakso M:Type 2 diabetes as a "coronary heart disease equivalent": an 18-year prospective population-based study in Finnish subjects.Diabetes Care2005, 28:2901–2907.
29. Fox CS, Coady S, Sorlie PD, Levy D, Meigs JB, D'Agostino RB Sr, Wilson PW, Savage PJ:Trends in cardiovascular complications of diabetes.JAMA2004, 292:2495–2499.
30. Liu J, Grundy SM, Wang W, Smith SC, Vega GL, Wu Z, Zeng Z, Wang W, Zhao D:Ten- year risk of cardiovascular incidence related do diabetes, prediabetes, and the metabolic syndrome.Am Heart J2007,153:552–558. 31. Hadaegh F, Fiee GS, Ghasemi A, Sarbakhsh P, Azizi F:Impact of metabolic
syndrome, diabetes and prediabetes on cardiovascular events: Theran lipid and glucose study.Diabetes Res Clin Pract2010,87:342–347. 32. Cameron AJ, Magliano DJ, Zimmet PZ, Welborn TA:The metabolic
syndrome as a tool for predicting future diabetes: The AusDiab study. J Intern Med2008,264:177–186.
33. Saely CH, Koch L, Schmid F, Marte T, Aczel S, Langer P, Hoefle G, Drexel H: Adult Treatment Panel III 2001 but not International Diabetes Federation 2005 criteria of the metabolic syndrome predict clinical cardiovascular events in subjects who underwent Coronary angiography.Diabetes Care 2006,29:901–907.
34. Reaven GM:The metabolic syndrome: Is this diagnosis necessary?Am J Clin Nutr2006,83:1237–1247.
35. Gross JL, Silveiro SP, Camargo JL, Reichelt AJ, Azevedo MJ:Diabetes melito: diagnóstico, classificação e avaliação do controle glicêmico.Arq Bras Endocrinol Metabol2002,46(1):16–26.
doi:10.1186/1758-5996-4-25
Cite this article as:Furtado de Souzaet al.:Glucose tolerance status is a better predictor of diabetes and cardiovascular outcomes than metabolic syndrome: a prospective cohort study.Diabetology & Metabolic Syndrome20124:25.
Submit your next manuscript to BioMed Central and take full advantage of:
• Convenient online submission
• Thorough peer review
• No space constraints or color figure charges
• Immediate publication on acceptance
• Inclusion in PubMed, CAS, Scopus and Google Scholar
• Research which is freely available for redistribution