R E S E A R C H
Open Access
Evaluation of the proliferation marker Ki-67
in gliomas: Interobserver variability and
digital quantification
Ljudmilla A. G. Nielsen
1,2*, Julie A. Bangsø
1, Kim H. Lindahl
1, Rikke H. Dahlrot
3, Jacob v. B. Hjelmborg
4,
Steinbjørn Hansen
3,5and Bjarne W. Kristensen
1,5*Abstract
Background:The Ki-67 Labelling Index (LI) is used as an ancillary tool in glioma diagnostics. Interobserver variability has been reported and no precise guidelines are available. Nor is it known whether novel digital approaches would be an advantage. Our aim was to evaluate the inter- and intraobserver variability of the Ki-67 LI between two pathologists and between pathologists and digital quantification both in whole tumour slides and in hot spots using narrow but diagnostically relevant intervals.
Methods:In samples of 235 low and high grade gliomas, two pathologists (A and B) estimated the Ki-67 LI (5–10% intervals) for whole tumour slides and for hot spots. In 20 of the cases intraobserver variability was evaluated. For digital quantification (C) slides were scanned with subsequent systematic random sampling of viable tumour areas. A software classifier trained to identify positive and negative nuclei calculated the Ki-67 LI. The interobserver
agreements were evaluated using kappa (κ) statistics.
Results:The observed proportions of agreement andκvalues for Ki-67 LI for whole tumour slides were: A/B: 46% (κ= 0.32); A/C: 37% (κ= 0.26); B/C: 37% (κ= 0.26). For hot spots equivalent values were: A/B: 14% (κ= 0.04); A/C: 18% (κ= 0. 09); B/C: 31% (κ= 0.21).
Conclusions:Interobserver variability was pronounced between pathologists and for pathologists versus digital quantification when attempting to estimate a precise value of the Ki-67 LI. Ki-67 LI should therefore be used with caution and should not be over interpreted in the grading of gliomas. Digital quantification of Ki-67 LI in gliomas was feasible, but intra- and interlaboratory robustness need to be determined.
Keywords:Glioblastoma, Astrocytoma, Digital analysis, Whole slides, Labelling index
Background
Gliomas are the most frequent primary brain tumours, of which glioblastomas are the most malignant [1]. Ac-cording to the WHO guidelines, gliomas are graded I-IV using the following histological criteria: cytological aty-pia, mitotic activity, cellularity, microvascular proliferation and/or necrosis [1]. Mitotic activity is included in the dis-tinction between grade II and grade III gliomas, whereas microvascular proliferation and/or necrosis suggest high
grade gliomas like anaplastic oligodendroglioma (grade III) or glioblastoma (grade IV) [1]. To limit inter- and intraobserver variability in the histological grading of gli-omas [2] ancillary diagnostic tools are needed, especially in small tumour samples [3].
The proliferation marker Ki-67 (or MIB-1) has been suggested as an ancillary marker [1, 3] in the grading of gliomas. The Ki-67 protein is located in the cell nucleus and can be detected in the active phases of the cell cycle, whereas it cannot be detected in the quiescent phase G0 [4]. The so-called Ki-67 labelling index (LI) being defined as the percentage of Ki-67 positive tumour nuclei of all tumour nuclei correlates with the histological tumour grade [5, 6]. The general Ki-67 LI values reported by the * Correspondence:[email protected];
1Department of Pathology, Odense University Hospital, J. B. Winsløws Vej 15,
Entrance 240, DK-5000 Odense C, Denmark
Full list of author information is available at the end of the article
WHO for gliomas are below 4% for diffuse astrocytomas, and between 5 and 10% for anaplastic astrocytomas, while the reported mean values for glioblastomas are between 15 and 20% [1]. There is, however, an overlap of Ki-67 LIs between histological grades [5,7], and the reported Ki-67 LI values vary between studies [5]. Part of this overlap may be explained by the approaches used for estimating the Ki-67 LI, as no precise guidelines exist and consider-able interobserver variability has been reported [8]. There-fore a more standardized approach for the evaluation of the Ki-67 LI is warranted [9].
Several methods, including digital approaches, have been proposed to evaluate the Ki-67 LI in gliomas and other neoplasms of the central nervous system [3,6, 10–14]. In gliomas, a common approach is to focus on the tumour area with the most intense proliferation – the so-called hot spot - and to estimate by various manual methods the Ki-67 LI [3, 7, 8, 10,15]. Limited attention has been paid to the value of whole tumour slide mean values. As gliomas may be heterogeneous the area with most intense proliferation may not be readily identifiable. Neither is it certain that the most intense hot spot is rep-resented in the biopsy or in the section chosen for immu-nohistochemical staining. With conventional evaluation it may be impossible to assess a whole tumour slide unless one uses a semi quantitative approach. With novel digital advances it might be possible to assess larger tumour areas, with possibly better interobserver agreement.
The aim of this study was to evaluate the inter-and intraobserver variability of the Ki-67 LI between two pathologists and between pathologists and a digital quantitative approach. The pathologists used a semi-quantitative approach. Both whole tumour slide mean values and hot spot values were evaluated for both approaches.
A poster with preliminary results has been pre-sented [16].
Methods
Patient population
The study was based on a cohort of adult patients with primary glioma with no previous treatment di-agnosed between 2005 and 2009. The cohort has been used in various biomarker studies [17–22]. Formalin-fixed paraffin-embedded tissue blocks from the primary surgery were used and sufficient tissue was available for immuno-histochemical staining in 235 cases. The gliomas included grade I (3 cases), grade II (25 cases), grade III (25 cases) and grade IV tumours (182 cases). The histological diag-noses of the cases were pilocytic astrocytoma (grade I), diffuse astrocytoma, oligodendroglioma, oligoastrocytoma (grade II), anaplastic astrocytoma, anaplastic oligodendro-glioma, anaplastic oligoastrocytoma (grade III), glioblast-oma and gliosarcglioblast-oma (grade IV).
Immunohistochemical procedure
For immunohistochemical staining a 3 μm section was cut from each tissue block. All stained sections were whole tumour sections. The immunostaining was per-formed on the automated immunohistochemical staining system BenchMark Ultra (Ventana medical system, Inc., USA), and all sections were stained in the same run or in runs following one another. All reagents used were from Ventana Medical System, Inc., USA. Antigen re-trieval was achieved using heat induced epitope rere-trieval for 48 min with a maximum temperature of 100 °C and Cell Conditioner 1 as the buffer. The primary antibody used was monoclonal rabbit anti-Ki-67 (30–9), ready to use dilution, with an incubation time of 12 min at 36 °C. The visualization system was OptiView DAB and counter-staining with Hematoxylin II and Blue Reagent followed immunostaining. Nuclear staining was considered posi-tive. Appropriate staining of the germinal centres and squamous epithelium of normal tonsil served as a positive control, with superficial epithelial cells repre-senting a negative tissue control. Moreover, omission of the anti-Ki-67 antibody served as a negative control.
Conventional microscopic evaluation
Two pathologists made a visual estimate of the Ki-67 LI using a light microscope, resembling daily practice. No fixed number of nuclei was counted. This approach was used in order to reflect daily diagnostics. The Ki-67 LI was defined as the percentage of positive tumour nuclei of all tumour nuclei. Necrosis, normal brain tissue, zones of infiltration, endothelial and inflammatory cells were omit-ted from the evaluation. A whole slide mean value and a hot spot value were estimated for each tumour in inde-pendent sessions.
To estimate the whole slide mean values, the tumour slides were viewed using the scanning objective (40× mag-nification) with subsequently evaluation at higher magnifi-cation of selected foci of viable tumour areas (100× magnification). The number of selected foci was not de-fined beforehand in order to reflect daily diagnostics. Each pathologist chose how many microscopic fields to exam-ine in each case. This number varied between cases de-pending on the area of the tumour tissue on the slide and the heterogeneity of the tumour tissue.
A hot spot was defined as the area with the most intense proliferation covering an area of at least one high power field (HPF = 0.24 mm2) at 400× magnification. Selection of hot spots was done by scanning the slide at low magnification, and the hot spot was selected in the area with the highest LI. In each case one hot spot was chosen for evaluation.
Twenty slides were re-evaluated to assess the intraob-server variability.
Digital quantification
For the digital quantification whole slides were scanned using a slide scanner with a 20× objective (Hamamatsu NanoZoomer 2.0-HT, Ballerup, Denmark). The Visio-pharm integrator system software (VisioVisio-pharm, Hørsholm, Denmark) was used for the digital image analysis. Tumour tissue was outlined manually and necrosis, vessels, inva-sion zones and normal brain tissue were excluded. Images to be quantified were obtained by systematic random sam-pling of 5% of the tissue [e.g. if the area of tissue on a slide was Amm2, then 0.05 x Amm2 would be selected ran-domly from the slide]. The area of tissue on the slide dif-fered between cases, leading therefore to different numbers of sample images between the cases. A minimum of 5 sample images per slide, each with at least 50% of viable tumour tissue was accepted as suffi-cient for further analysis. In cases with only sparse tumour tissue available, the slide was resampled using a sample fraction of 20% and a minimum of three sample images was accepted [e.g. if 0.05 x Amm2resulted in only 5 sample images with less than 50% of viable tumour tis-sue on each sample image, or if 0.05 x Amm2resulted in less than 5 sample images, the whole slide would be resampled. An area of 0.20 x Amm2 would then be se-lected randomly from the slide]. Using the Tissuemorph software, a classifier was trained to detect Ki-67 positive and negative nuclei. This was done by two of the authors including a neuropathologist on the basis of morphology, variation of staining colour of the nuclei and background staining. The Ki-67 LI was then calculated automatically. The mean value included all sample images of a tumour slide. A hot spot was defined as the sample image with the highest Ki-67 LI.
The procedure was repeated for 20 slides to assess the intraobserver variability.
Statistics
The continuous data of the digital quantification were grouped in intervals corresponding to the pre-defined categories used for the conventional evaluation. The values of the Ki-67 LI were assessed pairwise for: gist A vs. Pathologist B, Digital quantification vs. Patholo-gist A, Digital quantification vs. PatholoPatholo-gist B. The interobserver variability was evaluated using Cohen’s kappa (κ) for two raters. The kappa statistic is calculated by comparing the observed proportion of agreement with the agreement that would be expected by chance [23]. The statistical programme used was R version 3.0.2 [24] with Package ‘irr’ [25], including R Studio version 0.98.1091 [26].
Ethics
The project was approved by the Local Committee on Health Research Ethics and the Danish Data Protec-tion Agency. According to the Danish Tissue ApplicaProtec-tion Register, use of the tissue was not prohibited.
Results
The pairs of observations distributed on the pre-defined categories andκvalues are shown in Tables1,2,3and4. The diagonal represents agreement (a difference between two observations of zero categories). One shift to the side horizontally or vertically from the diagonal indicates a dif-ference of one category between two observations. Two shifts from the diagonal indicate a difference of two cat-egories etc.
Interobserver variability
Whole tumour slide mean values
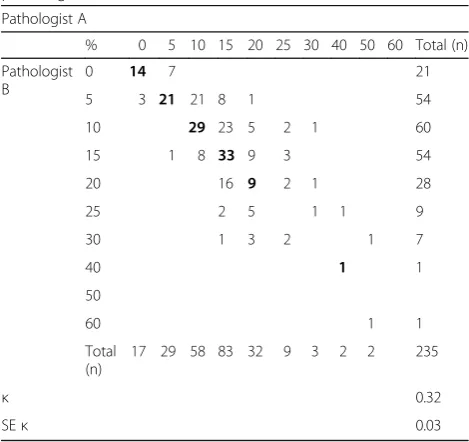
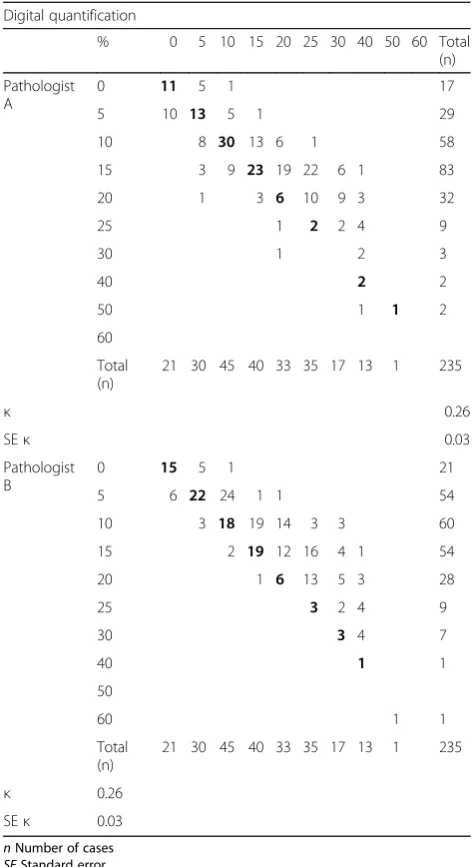
The median [range] Ki-67 LI for the two pathologists (A and B) and for the digital approach (C) were: A: 10% [0–60%]; B: 15% [0–50%]; C: 14% [0–51%] (Tables1and2). The pairwise proportions of agreement varied from 37 to 46% (Fig.1, green areas), while the correspondingκvalues were in the range 0.26–0.32 (Tables1and2). In 52–57% of cases there was an interobserver variation of the estimated Ki-67 LI of one or two categories (Fig. 1, yellow and or-ange areas), while there was a pairwise difference in esti-mated values of three categories or more in 2–6% of cases (Fig. 1, red areas). The largest difference in estimated values both between two pathologists and between a
Table 1Whole tumour slide mean values of Ki-67 LI for two pathologists
Pathologist A
% 0 5 10 15 20 25 30 40 50 60 Total (n)
Pathologist B
0 14 7 21
5 3 21 21 8 1 54
10 29 23 5 2 1 60
15 1 8 33 9 3 54
20 16 9 2 1 28
25 2 5 1 1 9
30 1 3 2 1 7
40 1 1
50
60 1 1
Total (n)
17 29 58 83 32 9 3 2 2 235
κ 0.32
SEκ 0.03
n: Number of cases SE: Standard error
pathologist and digital quantification were four categories (Tables1and2): e.g. in one case Pathologist A estimated the Ki-67 LI to be 30%, while Pathologist B estimated the Ki-67 LI to be 10% in the same case. In three cases the Ki-67 LI was 30% as a result of the digital quantification, while Pathologist B evaluated the Ki-67 LI to be 10% in the same three cases.
Hot spot values
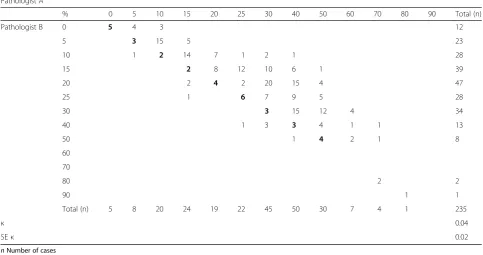
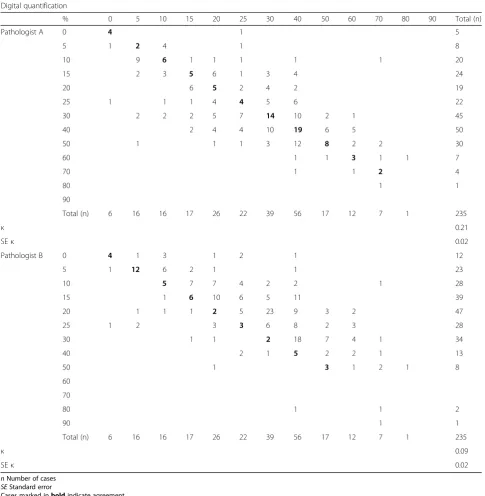
The median [range] Ki-67 LI for pathologists (A and B) and for the digital approach (C) were: A: 20% [0–90%]; B: 30% [0–80%]; C: 31% [0–81%] (Tables 3 and 4). The pairwise proportions of agreement varied from 14 to 31% (Fig. 1, green areas), while the corresponding κ values
were in the range 0.04–0.21 (Tables3and 4). In 55–65% of cases there was an interobserver variation of the esti-mated Ki-67 LI of one or two categories (Fig. 1, yellow and orange areas), while there was a pairwise difference in estimated values of three categories or more in 14–27% of cases (Fig. 1). The largest difference in estimated values between two pathologists was five categories, and the largest difference in estimated values between a pathologist and digital quantification was eight categories (Tables3and 4): e.g. in one case Pathologist A evaluated the Ki-67 LI to be 40%, while Pathologist B evaluated the Ki-67 LI to be 10% in the same case. In one case the Ki-67 LI was 70% for the digital quantification, while Pathologist A estimated the Ki-67 LI to be 10% in the same case.
Intraobserver variability
Whole tumour slide mean values
For the two pathologists there was agreement for A in 13/20 cases (Additional file 1: Table S1) and for B in 8/ 20 cases (Additional file 1: Table S2). There was a vari-ation of one category between the two estimates of the Ki-67 LI for A in 6/20 cases and for B in 11/20 cases. A difference of two categories was found in 1/20 cases for each of the pathologists. For the digital quantifications there was less than 5% difference in 18/20 cases (Add-itional file1: Table S5). In one case there was 8.6% differ-ence and in one case there was 12.2% differdiffer-ence between the two quantifications.
Hot spot values
For the pathologists there was agreement for A in 9/20 cases (Additional file1: Table S3) and for B in 7/20 cases (Additional file1: Table S4). A difference of one category was found for A in 9/20 cases and for B in 5/20 cases. Difference of two categories was found for B in 4/20 cases. Difference of three categories or more was found for A in 2/20 cases and for B in 4/20 cases. For the digital quantifications there was less than 5% difference in 12/20 cases (Additional file 1: Table S5). There was more than 5% and less than 10% difference in 4/20 cases. In the last four cases the difference was 11.3, 20.8, 21.2 and 34.6% respectively.
Discussion
We found that an attempt of precise estimation of the Ki-67 LI in gliomas using narrow but diagnostically rele-vant intervals resulted in pronounced interobserver vari-ability. The highest kappa value was 0.32 and the lowest kappa value had a level corresponding to what could be expected by chance. Some cases accordingly produced a large difference between estimated values. The digital approach showed a tendency for higher Ki-67 LI values when evaluating whole tumour slides. In terms of inter-observer variability we found no difference between two Table 2Whole tumour slide mean values of Ki-67 LI for two
raters
Digital quantification
% 0 5 10 15 20 25 30 40 50 60 Total
(n)
Pathologist A
0 11 5 1 17
5 10 13 5 1 29
10 8 30 13 6 1 58
15 3 9 23 19 22 6 1 83
20 1 3 6 10 9 3 32
25 1 2 2 4 9
30 1 2 3
40 2 2
50 1 1 2
60
Total (n)
21 30 45 40 33 35 17 13 1 235
κ 0.26
SEκ 0.03
Pathologist B
0 15 5 1 21
5 6 22 24 1 1 54
10 3 18 19 14 3 3 60
15 2 19 12 16 4 1 54
20 1 6 13 5 3 28
25 3 2 4 9
30 3 4 7
40 1 1
50
60 1 1
Total (n)
21 30 45 40 33 35 17 13 1 235
κ 0.26
SEκ 0.03
nNumber of cases SEStandard error
pathologists and the pathologists compared to the digital approach.
A high level of interobserver variability for the Ki-67/ MIB1 LI between pathologists has previously been dem-onstrated in gliomas [8]. Some authors report that the interobserver variability in gliomas may be reduced when using specific methods of counting [10]. In a study of oligodendrogliomas the authors report the overall agree-ment to be good, with a few cases resulting in marked in-terobserver variability [27]. For intracranial ependymomas different levels of interobserver variability has been re-ported, and the kappa values were found to depend on the cut off level chosen and on the level of experience of the observers [28]. In the present study we had chosen to use narrow intervals for the estimated Ki-67 LI being however comparable to the levels suggested to guide the grading of gliomas. When using the kappa statistics, many cat-egories will tend to result in lower kappa values [23]. In several studies the results were dichotomized using spe-cific cut-off values [8,10,28] explaining that kappa values in general were found to be higher than in our study. A limitation of our study is that the results are based on the observations of only two pathologists. Nevertheless it re-flects the daily situation in many units of neuropathology.
In our study, the interobserver variability of the Ki-67 LI was highest, when evaluating hot spots, indi-cating that in terms of interobserver variability, hot spot values, especially, should be used with caution. The litera-ture is scarce with regard to evaluation of the Ki-67 LI in
gliomas in whole tumour slides. One study of gliomas, however, found that a semi quantitative evaluation of the MIB-1 LI, where whole tumour slides were rated as low, intermediate and high, resulted in a general agreement among observers [8].
In our assessment of intraobserver variability the best results were achieved for the digital method, when evaluating the mean values of whole tumour slides. All except two cases showed a difference of less than 5% be-tween the two evaluations being the equivalent of an intraobserver variation of zero categories (agreement) for pathologists. Because of the small number of cases no statistical analysis was done. The sampling of the tis-sue on the slide was performed by systematic random sampling and thus different sample areas could be quan-tified when repeating the evaluation. This can explain why the difference of the Ki-67 LI exceeded 5% in two cases. A preliminary test considering reproducibility and time consumption resulted in the choice of a sample fraction of 5% in the present study. In the preliminary test there was no remarkable improvement in terms of reproducibility when using a larger sample fraction ex-cept in cases with only little amount of tissue on the slide. Using a larger sample fraction of the digitalised slide or quantifying all the viable tumour areas would be very time consuming because of the large number of sample images per slide combined with the manual step of outlining tumour tissue. In previous studies various digital techniques have been found to be feasible in the Table 3Hot spot values of Ki-67 LI for two pathologists
Pathologist A
% 0 5 10 15 20 25 30 40 50 60 70 80 90 Total (n)
Pathologist B 0 5 4 3 12
5 3 15 5 23
10 1 2 14 7 1 2 1 28
15 2 8 12 10 6 1 39
20 2 4 2 20 15 4 47
25 1 6 7 9 5 28
30 3 15 12 4 34
40 1 3 3 4 1 1 13
50 1 4 2 1 8
60
70
80 2 2
90 1 1
Total (n) 5 8 20 24 19 22 45 50 30 7 4 1 235
κ 0.04
SEκ 0.02
nNumber of cases SEStandard error
determination of the Ki-67 LI in gliomas and meningi-omas [11,13, 29], including detection of hot spot areas [30, 31]. In our study, the intraobserver variability for the digital quantification of hot spot values resulted in 8 cases with a difference larger than 5% between Ki-67 LI values. The digital quantification method we used was performed by systematic random sampling of the tissue and was thus not designed specifically to identify the areas with the highest Ki-67 LI. These areas would not necessarily be included in the sample images. The hot
spot values for the digital quantification was a result of a single sample image making this method very sensitive to the random area represented in that sample image. This might explain the larger variability for hot spot values compared to whole slide mean values. This might also explain some of the conspicuous differences in eval-uated hot spot values when comparing the digital quan-tification with the pathologists. We find that the digital quantification method provides a possibility of assessing larger tissue areas with numerous cells with possibly Table 4Hot spot values of Ki-67 LI for two raters
Digital quantification
% 0 5 10 15 20 25 30 40 50 60 70 80 90 Total (n)
Pathologist A 0 4 1 5
5 1 2 4 1 8
10 9 6 1 1 1 1 1 20
15 2 3 5 6 1 3 4 24
20 6 5 2 4 2 19
25 1 1 1 4 4 5 6 22
30 2 2 2 5 7 14 10 2 1 45
40 2 4 4 10 19 6 5 50
50 1 1 1 3 12 8 2 2 30
60 1 1 3 1 1 7
70 1 1 2 4
80 1 1
90
Total (n) 6 16 16 17 26 22 39 56 17 12 7 1 235
κ 0.21
SEκ 0.02
Pathologist B 0 4 1 3 1 2 1 12
5 1 12 6 2 1 1 23
10 5 7 7 4 2 2 1 28
15 1 6 10 6 5 11 39
20 1 1 1 2 5 23 9 3 2 47
25 1 2 3 3 6 8 2 3 28
30 1 1 2 18 7 4 1 34
40 2 1 5 2 2 1 13
50 1 3 1 2 1 8
60
70
80 1 1 2
90 1 1
Total (n) 6 16 16 17 26 22 39 56 17 12 7 1 235
κ 0.09
SEκ 0.02
nNumber of cases SEStandard error
more accuracy as compared to the conventional method. Challenges using digital quantification based on a classi-fier include the presence of both false positive and false negative nuclei [11]. We found that false positive nuclei could be a result of labelling of non-tumour nuclei in in-flammatory cells or vessels. False negative nuclei could re-sult from weak staining or from merging of tumour cell nuclei because of physical overlap. These challenges, how-ever, will also be met by the pathologist. The digital method requires additional steps including the scanning of slides and the outlining of relevant tumour areas prior to the evaluation process, whereas the conventional method is directly applicable in the daily diagnostic practice. In a fully digitalised diagnostic setting the digital quantification would be easily implemented. The high proportion of intraobser-ver agreement for the digital quantification in case of whole tumour slide mean values supports that the classifier used in this study is fairly accurate. In our study only twenty cases were re-evaluated and in order to test the ac-curacy of the classifier, larger studies of the reprodu-cibility are needed. If our approach were used in other laboratories, it would be important to test the re-producibility within each laboratory, but also to determine the reproducibility between laboratories. It should be em-phasized that the Ki-67 staining procedure itself should also be standardized to reach a high intra- and interla-boratory reproducibility.
Conclusions
In conclusion our results suggest marked interobserver variability when attempting to estimate precise values for the Ki-67 LI. We find that such precise values should be
used with caution and such values should therefore not be over interpreted in the grading of gliomas. The digital quantification was feasible, but intra- and interlaboratory robustness of the method need to be determined.
Additional file
Additional file 1:The results of the intraobserver variability.Table S1
Intraobserver variability for pathologist A - Whole tumour slide mean values of Ki-67 LI.Table S2Intraobserver variability for pathologist B -Whole tumour slide mean values of Ki-67 LI.Table S3Intraobserver vari-ability for pathologist A–Hot spot values of Ki-67 LI.Table S4 Intraobser-ver variability for pathologist B–Hot spot values of Ki-67 LI.Table S5
Intraobserver variability for the digital quantification of the Ki-67 LI (%). (DOCX 27 kb)
Abbreviations
HPF:High power field; LI: Labelling Index; SE: Standard error;κ: Kappa
Acknowledgements
The authors would like to thank technicians Helle Wohlleben and Tanja Dreehsen Højgaard for the excellent laboratory work. We would also like to thank DNA Digest, Cambridge, UK for support with the statistical analysis. We thank the contributors to the R Project and the authors of the R project, package `irr`, Matthias Gamer, Jim Lemon, Ian Fellows and Puspendra Singh.
Funding
Odense University Hospital Research Funds.
Availability of data and materials
The immunohistochemically stained slides are stored in the Department of Pathology, Odense University Hospital. The datasets generated and analysed during the current study are available from the corresponding author on reasonable request.
Authors’contributions
LAGN, JAB and KHL performed the evaluation of the Ki-67 LI, and were con-tributors in writing the manuscript. LAGN and JvBH planned and performed/ revised the statistical analysis. RHD and SH collected the patient data for the
Fig. 1Comparison of interobserver variation. The pairwise observed proportions of agreement are shown as green areas. The interobserver
cohort and revised the manuscript. BWK supervised the study and was a contributor in writing the manuscript. All authors read and approved the final manuscript.
Ethics approval and consent to participate
The project was approved by the Local Committee on Health Research Ethics (project number S-2011-0022) and the Danish Data Protection Agency (project number 16/11065). According to the Danish Tissue Application Register, use of the tissue was not prohibited.
Competing interests
The authors declare that they have no competing interests.
Publisher’s Note
Springer Nature remains neutral with regard to jurisdictional claims in published maps and institutional affiliations.
Author details
1Department of Pathology, Odense University Hospital, J. B. Winsløws Vej 15,
Entrance 240, DK-5000 Odense C, Denmark.2Department of Pathology, Hospital of Southern Jutland/ Sygehus Sønderjylland, Kresten Philipsens Vej 15, Dk-6200 Aabenraa, Denmark.3Department of Oncology, Odense University Hospital, Sdr. Boulevard 29, Dk-5000 Odense C, Denmark. 4
Department of Public Health, Epidemiology, Biostatistics and Biodemography, University of Southern Denmark, J.B. Winsløws Vej 9, Entrance B, 1st, Dk-5000 Odense C, Denmark.5Department of Clinical Research, University of Southern Denmark, J. B. Winsløws Vej 15, Entrance 240, DK-5000 Odense C, Denmark.
Received: 6 December 2017 Accepted: 13 May 2018
References
1. Louis DN, Ohgaki H, Wiestler OD, Cavenee WK (Eds.). WHO classification of Tumours of the central nervous system. 4th Ed. revised. Lyon: IARC; 2016. 2. Mittler MA, Walters BC, Stopa EG. Observer reliability in histological grading
of astrocytoma stereotactic biopsies. J Neurosurg. 1996;85(6):1091–4. 3. Torp SH. Diagnostic and Prognostic role of Ki67 immunostaining in
human astrocytomas using four different antibodies. Clin Neuropathol. 2002;21(6):252–7.
4. Scholzen T, Gerdes J. The Ki-67 protein: from the known and the unknown. J Cell Physiol. 2000;182:311–22.
5. Johannessen AL, Torp SH. The clinical value of Ki-67/MIB-1 labeling index in human astrocytomas. Pathol Oncol Res. 2006;12(3):143–7.
6. Prayson RA. The utility of MIB-1/Ki-67 immunostaining in the evaluation of central nervous system neoplasms. Adv Anat Pathol. 2005;12(3):144–8. 7. Rathi KR, Radotra BD, Khosla VK. Proliferative index in astrocytic tumours.
Indian J Pathol Microbiol. 2007;50(4):754–8.
8. Grzybicki DM, Liu Y, Moore SA, Brown HG, Silverman JF, D'Amico F, Raab SS. Interobserver variability associated with the MIB-1 labeling index: high levels suggest limited prognostic usefulness for patients with primary brain tumors. Cancer. 2001;92(10):2720–6.
9. Berghoff AS, Stefanits H, Woehrer A, Heinzl H, Preusser M, Hainfellner JA. Clinical neuropathology practice guide 3-2013: levels of evidence and clinical utility of prognostic and predictive candidate brain tumor biomarkers. Clin Neuropathol. 2013;32(3):148–58.
10. Hsu CY, Ho DM, Yang CF, Chiang H. Interobserver reproducibility of MIB-1 labeling index in astrocytic tumors using different counting methods. Mod Pathol. 2003;16(9):951–7.
11. Grala B, Markiewicz T, Kozlowski W, Osowski S, Slodkowska J, Papierz W. New automated image analysis method for the assessment of Ki-67 labeling index in meningiomas. Folia Histochem Cytobiol. 2009;47(4):587–92.
12. Fisher BJ, Naumova E, Leighton CC, Naumov GN, Kerklviet N, Fortin D, Macdonald DR, Cairncross JG, Bauman GS, Stitt L. Ki-67: a prognostic factor for low-grade glioma? Int J Radiat Oncol Biol Phys. 2002;52(4):996–1001. 13. Amin MR, Kurosaki M, Watanabe T, Tanaka S, Hori T. A comparative study of
MIB-1 staining indices of gliomas measured by NIH image analysis program and conventional manual cell counting method. Neurol Res. 2000;22(5):495–500. 14. Vankalakunti M, Vasishta RK, Das Radotra B, Khosla VK. MIB-1
immunolabeling: a valuable marker in prediction of benign recurring meningiomas. Neuropathology. 2007;27(5):407–12.
15. Preusser M, Hoeftberger R, Woehrer A, Gelpi E, Kouwenhoven M, Kros JM, Sanson M, Idbaih A, Brandes AA, Heinzl H, Gorlia T, Hainfellner JA, van den bent M. Prognostic value of Ki67 index in anaplastic oligodendroglial tumours–a translational study of the European Organization for Research and Treatment of Cancer brain tumor group. Histopathology. 2012;60(6): 885–94.
16. Nielsen LAG, Bangsø JA, Lindahl KH, Dahlrot RH, Hansen S, Kristensen BW. Evaluation of the proliferation marker Ki-67 in gliomas: interobserver variability and digital quantification. Clin Neuropathol. 2015;34(3):157. 17. Music D, Dahlrot RH, Hermansen SK, Hjelmborg J, de Stricker K, Hansen S,
Kristensen BW. Expression and prognostic value of the WEE1 kinase in gliomas. J Neuro-Oncol. 2016;127(2):381–9.
18. Petterson SA, Dahlrot RH, Hermansen SK, KAM S, Gundesen MT, Wohlleben H, Rasmussen T, Beier CP, Hansen S, Kristensen BW. High levels of c-met is associated with poor prognosis in glioblastoma. J Neuro-Oncol. 2015;122(3): 517–27.
19. Dahlrot RH, Hansen S, Jensen SS, Schroder HD, Hjelmborg J, Kristensen BW. Clinical value of CD133 and nestin in patients with glioma: a population-based study. Int J Clin Exp Pathol. 2014;7(7):3739–51.
20. Dahlrot RH, Hansen S, Herrstedt J, Schroder HD, Hjelmborg J, Kristensen BW. Prognostic value of Musashi-1 in gliomas. J Neuro-Oncol. 2013;115(3):453–61. 21. Dahlrot RH, Kristensen BW, Hjelmborg J, Herrstedt J, Hansen S. A
Population-based study of high-grade gliomas and mutated isocitrate dehydrogenase 1. Int J Clin Exp Pathol. 2013;6(1):31–40.
22. Dahlrot RH, Kristensen BW, Hjelmborg J, Herrstedt J, Hansen S. A population-based study of low-grade gliomas and mutated isocitrate dehydrogenase 1 (IDH1). J Neuro-Oncol. 2013;114(3):309–17. 23. Kirkwood BR, Sterne JAC. Essential Medical Statistics. 2nd ed. Oxford:
Blackwell Science; 2003.
24. R Core Team. R: a language and environment for statistical computing. R Foundation for Statistical Computing, Vienna, Austria; 2013. https://cran.r-project.org. Accessed 23 Mar 2014.
25. Gamer M, Lemon J, Fellows I and Singh P. irr: Various Coefficients of Interrater Reliability and Agreement. R package version 0.84. 2012.
https://CRAN.R-project.org/package=irr. Accessed 23 Mar 2014.
26. R Studio Team. RStudio: Integrated Development for R. RStudio, Inc.: Boston; 2015.https://www.rstudio.com. Accessed 14 Feb 2015.
27. Prayson RA, Castilla EA, Hembury TA, Liu W, Noga CM, Prok AL. Interobserver variability in determining MIB-1 labeling indices in oligodendrogliomas. Ann Diagn Pathol. 2003;7(1):9–13.
28. Preusser M, Heinzl H, Gelpi E, Hoftberger R, Fischer I, Pipp I, Milenkovic I, Wohrer A, Popovici F, Wolfsberger S, Hainfellner JA. Ki67 index in intracranial ependymoma: a promising histopathological candidate biomarker. Histopathology. 2008;53(1):39–47.
29. Coleman KE, Brat DJ, Cotsonis GA, Lawson D, Cohen C. Proliferation (MIB-1 expression) in oligodendrogliomas: assessment of quantitative methods and prognostic significance. Appl Immunohistochem Mol Morphol. 2006;14(1): 109–14.
30. Lopez XM, Debeir O, Maris C, Rorive S, Roland I, Saerens M, Salmon I, Decaestecker C. Clustering methods applied in the detection of Ki67 hot-spots in whole tumor slide images: an efficient way to characterize heterogeneous tissue-based biomarkers. Cytometry A. 2012;81(9):765–75. 31. Swiderska Z, Korzynska A, Markiewicz T, Lorent M, Zak J, Wesolowska A,