R E S E A R C H A R T I C L E
Open Access
Lung hyperinflation and functional exercise
capacity in patients with COPD
–
a
three-year longitudinal study
Linn T. Aalstad
1, Jon A. Hardie
1, Birgitte Espehaug
2, Einar Thorsen
1,3, Per S. Bakke
1, Tomas M. L. Eagan
1,4and Bente Frisk
5,6*Abstract
Background:Lung hyperinflation contributes to dyspnea, morbidity and mortality in chronic obstructive pulmonary disease (COPD). The inspiratory-to-total lung capacity (IC/TLC) ratio is a measure of lung hyperinflation and is associated with exercise intolerance. However, knowledge of its effect on longitudinal change in the 6-min walk distance (6MWD) in patients with COPD is scarce. We aimed to study whether the IC/TLC ratio predicts longitudinal change in 6MWD in patients with COPD.
Methods:This prospective cohort study included 389 patients aged 40–75 years with clinically stable COPD in Global Initiative for Chronic Obstructive Lung Disease stages II-IV. The 6MWD was measured at baseline, and after one and 3 years. We performed generalized estimating equation regression analyses to examine
predictors for longitudinal change in 6MWD. Predictors at baseline were: IC/TLC ratio, age, gender, pack years, fat mass index (FMI), fat-free mass index (FFMI), number of exacerbations within 12 months prior to inclusion, Charlson index for comorbidities, forced vital capacity (FVC), forced expiratory volume in 1 s (FEV1), and light and hard self-reported physical activity.
Results: Reduced IC/TLC ratio (p< 0.001) was a statistically significant predictor for decline in 6MWD. With a 0.1-unit decrease in baseline IC/TLC ratio, the annual decline in 6MWD was 12.7 m (p< 0.001). Study
participants with an IC/TLC ratio in the upper quartiles maintained their 6MWD from baseline to year 3, while it was significantly reduced for the patients with an IC/TLC ratio in the lower quartiles. Absence of light and hard physical activity, increased age and FMI, decreased FEV1 and FVC, more frequent exacerbations and higher Charlson comorbidity index were also predictors for lower 6MWD at any given time, but did not predict higher rate of decline over the timespan of the study.
Conclusion: Our findings demonstrated that patients with less lung hyperinflation at baseline maintained their functional exercise capacity during the follow-up period, and that it was significantly reduced for patients with increased lung hyperinflation.
Keywords:COPD, 6-min walk distance, IC/TLC ratio, Functional exercise capacity, Lung hyperinflation
* Correspondence:[email protected] 5
Department of Health and Functioning, Western Norway University of Applied Sciences, Inndalsveien 28, 5063 Bergen, Norway
6Department of Physiotherapy, Haukeland University Hospital, Bergen, Norway
Full list of author information is available at the end of the article
Background
Chronic obstructive pulmonary disease (COPD) is a major cause of morbidity and mortality, and is predicted to become the third leading cause of death worldwide in 2030 [1]. Expiratory flow limitation is generally regarded as the hallmark feature of COPD [2], but lung hyperin-flation is also a manifestation of COPD with major clin-ical consequences [3].
Lung hyperinflation is clinically relevant in COPD, mostly because of its contribution to dyspnea [4] and morbidity associated with the disease [5]. Hyperinflation has also shown to be related to exercise limitation [4], which is a significant component of quality of life [6]. The inspiratory capacity (IC) and inspiratory-to-total lung capacity (IC/TLC) ratio are indirect measures of lung hyperinflation reflecting the end-expiratory lung
volume [5, 7]. IC and IC/TLC ratio progressively
declines as COPD advances [7, 8], mirroring the rise in lung hyperinflation [9].
The 6-min walk test (6MWT) is widely used in the assessment of functional exercise capacity in patients with COPD [10]. The 6-min walk distance (6MWD) gives valuable information that can be used in the clinical staging of COPD patients, as it correlates well with dyspnea, lung hyperinflation and airway obstruction [11]. In addition, longitudinal changes in 6MWD have demonstrated to be important predictors of mortality [12–14]. However, there is limited knowledge about the effect of IC/TLC ratio on longitudinal changes in 6MWD in patients with COPD.
To our knowledge, only one previous study has exam-ined the relationship between lung hyperinflation and functional exercise capacity, using IC/TLC ratio and 6MWD in the assessment. Ramon et al. [15] demon-strated that IC/TLC ratio and subjective dyspnea pre-dicted decline in exercise capacity. However, Ramon et al. [15] only included patients recruited during their first hospitalization due to a COPD exacerbation, and may not be representative for COPD patients in general. The observation time was 1.7 years [15].
The aim of the present study was to examine whether lung hyperinflation measured as IC/TLC ratio predicts longitudinal change in 6MWD in patients with COPD. We hypothesized that increased hyperinflation predicts longitudinal decline in functional exercise capacity in patients with COPD.
Methods Study population
The current study was a prospective cohort study that included 389 of a total of 433 patients from the Bergen COPD Cohort Study (BCCS), aged 44–75 years, with an average follow-up time of 3 years (2006–2010). Details of sampling procedures and data collection for the BCCS have
been described previously [16]. In brief, all patients had a clinically stable COPD in Global Initiative for Chronic Obstructive Lung Disease (GOLD) stages II-IV [17], a smoking history of ≥10 pack years, a post-bronchodilation forced expiratory volume in 1 s (FEV1)/forced vital capacity
(FVC) ratio < 0.7 and a post-bronchodilation FEV1< 80% of
predicted value according to Norwegian reference values [18]. Exacerbations that required medical treatment and/or hospitalization during the last 4 weeks prior to inclusion led to postponement of inclusion. There were no restric-tions to treatment during the study period, and the patients received medications and therapies prescribed by their physician. Active cancer or inflammatory disorders like rheumatoid arthritis, systemic lupus erythematosus or other connective tissue disorders and inflammatory bowel disease in the last 5 years were reasons for exclusion from the study. The patients were recruited through outpatient clinics from several hospitals in Western Norway and from three private specialist practices in Bergen, Norway [16].
Measurements Six-min walk test
Functional exercise capacity was assessed by the 6MWT with 6MWD as the primary outcome measure. The 6MWT was performed at baseline and after one and 3 years after inclusion in the study. The test was super-vised by a trained technician and performed according to the American Thoracic Society (ATS) guidelines [10]. However, the 6MWT was performed only once at each visit without a prior practice test. The 6MWD and use of oxygen during the test were registered. Measurements of heart rate and oxygen saturation, as well as evaluation of dyspnea and fatigue according to the Borg CR10 Scale [19], were done before and immediately after the test.
Self-reported physical activity
Level of habitual physical activity was registered by a questionnaire with two questions related to spare time physical activity, one for hard and one for light physical activity. Sweating and breathlessness were used as the delineation between hard and light physical activity. The possible response categories were none, less than 1 h per week, 1–2 h per week and 3 or more hours per week. These questions are validated previously [20, 21], and have been used in a large Norwegian general population study [22].
Body composition, spirometry, dyspnea, exacerbations and Charlson index for comorbidities
were calculated as fat mass and fat-free mass, respectively, divided by the square of height.
The study participants underwent complete lung func-tion tests at baseline, including spirometry and plethys-mography, according to the ATS/ERS Standardization of Lung Function Testing [23,24]. We performed spirometry before and after inhalation of 0.4 mg salbutamol on a Viasys Masterscope (Viasys, Hoechberg, Germany). The FVC and FEV1were taken as the highest values from at
least three acceptable and repeatable maneuvers. Lung volumes were obtained by plethysmography and lung hyperinflation was assessed by the IC/TLC ratio. The spirometers were calibrated twice daily with a 3-L calibra-tion syringe.
The modified Medical Research Council (mMRC) dyspnea scale [25] was used to measure symptoms of dyspnea. A physician examined all the patients at baseline and registered number of exacerbations the last 12 months prior to inclusion, comorbidities and smoking habits. The Charlson index for comorbidities was calculated.
Statistics
Descriptive statistics were used to characterize the study population (mean, standard deviation and per-cent). Normal distribution was assessed by histogram, Q-Q-plot and Shapiro Wilks test. We compared the continuous and categorical variables across gender by independent t-tests and chi-square tests, respectively.
We performed generalized estimating equations (GEE) regression analyses [26] to examine IC/TLC ratio as predictor for change in 6MWD. Time was included in the model as a categorical variable with three measurements: baseline, 1 and 3 years, and in addition as a continuous variable to examine yearly change in 6MWD. Age, gender, pack years, FMI, FFMI, more than two exacerbations within 12 months prior to inclusion (yes/no), Charlson index for comorbid-ity (level 1, 2, 3 and 4), FVC, FEV1 and light or hard
self-reported physical activity (yes/no, yes =≥1 h/week) at baseline were included as potential confounders. To account for within-patient correlation we applied an unstructured working correlation structure. GEE regres-sion analysis provides an approach for analyzing corre-lated measurements without excluding subjects with an incomplete dataset.
We performed bivariate GEE analysis for each predictor variable. In an additional analysis, time was investigated as a continuous variable. Multivariate GEE analyses were performed in three stages, first including all variables as main effects, and secondly, expanding with all possible interaction terms between predictor and time. Based on the latter, the third and final model included all variables and the statistically significant interaction terms. Analyses for
multicollinearity between FMI and FFMI, and between IC/ TLC ratio, FVC and FEV1did not demonstrate
multicolli-nearity, and therefore all variables were included in the same model.
In addition, we performed multivariate GEE analyses with baseline IC/TLC ratio categorized into quartiles, and the variable was included in the analysis as the interaction term with time. The IC/TLC groups were named IC/TLC 1, 2, 3 and 4, respectively, with IC/TLC 1 representing the lower quartile.
A power analysis for a simple group comparison with three repeated measures [26] informed that 174 patients were needed to detect a difference in mean 6MWD of 30 m [27] as statistically significant at a 5% significance level and a power of 80%. The calculation was based on an assump-tion of a within-subject correlaassump-tion coefficient of 0.25 and a SD for 6MWD of 100 m. A within-subject correlation coefficient of 0.5 increased the number of patients to 232.
IBM SPSS Statistics version 24 was used to conduct the analyses. Estimated regression coefficients obtained in the GEE analyses are presented with confidence intervals and p-values. Statistical significance level was set at 0.05.
Results
Study population
At baseline, 389 patients completed the 6MWT, and 319 (82%) and 264 (68%) completed the 6MWT at 1 year and 3-years, respectively. Of the remaining 125 participants, 104 were disabled and 21 were deceased. The patients who dropped out were older (p< 0.001), had lower FEV1(p
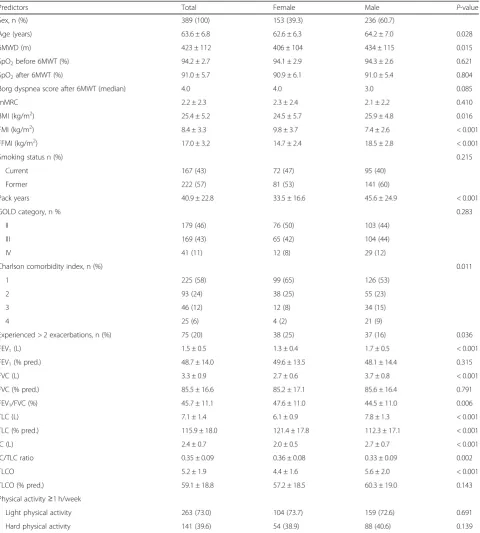
< 0.001), FVC (p< 0.001) and IC/TLC ratio (p< 0.001) compared to the patients who completed the study, and the 6MWD were 87 m (p< 0.001) shorter at baseline. Baseline characteristics of the study population are presented in Table 1. The mean age of the patients was 64 ± 7 years, and 61% were male. Airflow limitation was moderate to very severe with a mean FEV1of 49 ± 14%
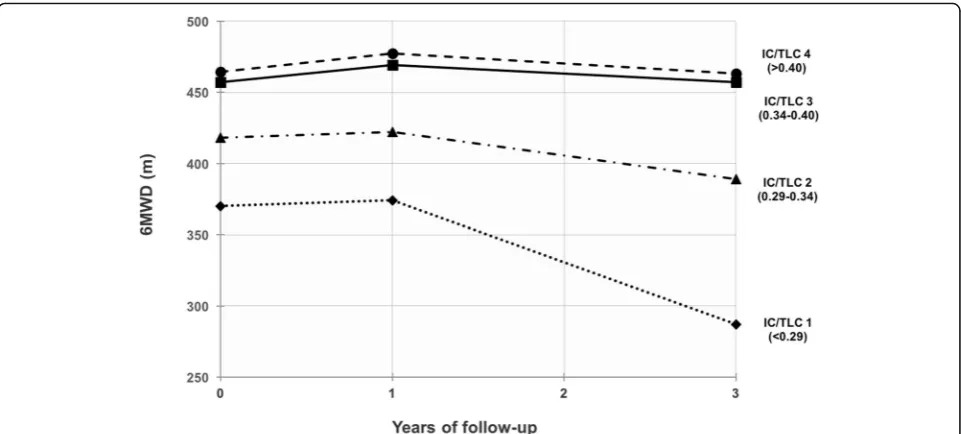
of predicted value. Measurements of IC/TLC ratio at baseline were available for 371 patients. The patients had a mean IC/TLC ratio of 0.35 ± 0.09 and approxi-mately 15% of the patients had an IC/TLC ratio below the critical threshold of 0.25. The cut points for the quartiles were 0.29 (25th percentile), 0.34 (median) and 0.40 (75th percentile).
Longitudinal change in 6MWD
3 (B =−29, p< 0.001) indicating a non-linear relationship. This pattern was most evident in patients with an IC/TLC ratio in the lower quartiles (Fig.1).
Predictors for longitudinal change in 6MWD
A 0.1 unit increase in baseline IC/TLC ratio was associated with an increase in 6MWD both in the Table 1Baseline characteristics of the study population
Predictors Total Female Male P-value
Sex, n (%) 389 (100) 153 (39.3) 236 (60.7)
Age (years) 63.6 ± 6.8 62.6 ± 6.3 64.2 ± 7.0 0.028
6MWD (m) 423 ± 112 406 ± 104 434 ± 115 0.015
SpO2before 6MWT (%) 94.2 ± 2.7 94.1 ± 2.9 94.3 ± 2.6 0.621
SpO2after 6MWT (%) 91.0 ± 5.7 90.9 ± 6.1 91.0 ± 5.4 0.804
Borg dyspnea score after 6MWT (median) 4.0 4.0 3.0 0.085
mMRC 2.2 ± 2.3 2.3 ± 2.4 2.1 ± 2.2 0.410
BMI (kg/m2) 25.4 ± 5.2 24.5 ± 5.7 25.9 ± 4.8 0.016
FMI (kg/m2) 8.4 ± 3.3 9.8 ± 3.7 7.4 ± 2.6 < 0.001
FFMI (kg/m2) 17.0 ± 3.2 14.7 ± 2.4 18.5 ± 2.8 < 0.001
Smoking status n (%) 0.215
Current 167 (43) 72 (47) 95 (40)
Former 222 (57) 81 (53) 141 (60)
Pack years 40.9 ± 22.8 33.5 ± 16.6 45.6 ± 24.9 < 0.001
GOLD category, n % 0.283
II 179 (46) 76 (50) 103 (44)
III 169 (43) 65 (42) 104 (44)
IV 41 (11) 12 (8) 29 (12)
Charlson comorbidity index, n (%) 0.011
1 225 (58) 99 (65) 126 (53)
2 93 (24) 38 (25) 55 (23)
3 46 (12) 12 (8) 34 (15)
4 25 (6) 4 (2) 21 (9)
Experienced > 2 exacerbations, n (%) 75 (20) 38 (25) 37 (16) 0.036
FEV1(L) 1.5 ± 0.5 1.3 ± 0.4 1.7 ± 0.5 < 0.001
FEV1(% pred.) 48.7 ± 14.0 49.6 ± 13.5 48.1 ± 14.4 0.315
FVC (L) 3.3 ± 0.9 2.7 ± 0.6 3.7 ± 0.8 < 0.001
FVC (% pred.) 85.5 ± 16.6 85.2 ± 17.1 85.6 ± 16.4 0.791
FEV1/FVC (%) 45.7 ± 11.1 47.6 ± 11.0 44.5 ± 11.0 0.006
TLC (L) 7.1 ± 1.4 6.1 ± 0.9 7.8 ± 1.3 < 0.001
TLC (% pred.) 115.9 ± 18.0 121.4 ± 17.8 112.3 ± 17.1 < 0.001
IC (L) 2.4 ± 0.7 2.0 ± 0.5 2.7 ± 0.7 < 0.001
IC/TLC ratio 0.35 ± 0.09 0.36 ± 0.08 0.33 ± 0.09 0.002
TLCO 5.2 ± 1.9 4.4 ± 1.6 5.6 ± 2.0 < 0.001
TLCO (% pred.) 59.1 ± 18.8 57.2 ± 18.5 60.3 ± 19.0 0.143
Physical activity≥1 h/week
Light physical activity 263 (73.0) 104 (73.7) 159 (72.6) 0.691
Hard physical activity 141 (39.6) 54 (38.9) 88 (40.6) 0.139
Data are presented as mean ± SD, unless otherwise stated. Independent samples T-test for continuous variables and Chi square for categorical variables
6MWD6-min walking distance,BMIbody mass index,FMIfat mass index,FFMIfat free mass index,GOLDGlobal Initiative for Chronic Obstructive Lung Disease,FEV1forced expiratory volume in 1 s,FVCforced vital capacity,ICinspiratory capacity,TLCtotal lung capacity,IC/TLC ratio
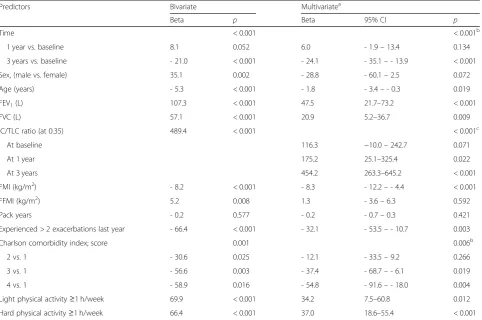
bivariate (B = 489 m,p< 0.001) and multivariate (B = 229 m,
p= 0.001) analysis (Table2). In the final model, we allowed for a time-dependent effect of the IC/TLC ratio, and found that it gained importance as predictor of 6MWD with longer follow-up (Table2). Among all included factors, only IC/TLC ratio demonstrated a statistically significant time-dependent effect on 6MWD (p< 0.001). However, several other baseline factors had a statistically significant impact on 6MWD irrespective of follow-up. We observed that not performing light and hard physical activity, decreasing values of FEV1or FVC, increasing age or FMI,
Charlson comorbidity index of 3 or higher, and having more than two exacerbations the last 12 months prior to study inclusion, predicted a statistically significant decrease in 6MWD (Table2).
Discussion
The main findings of this study were: 1) Increased lung hyperinflation measured as IC/TLC ratio pre-dicted longitudinal decline in 6MWD, with time as an effect modifier. Absence of light and hard physical activity, increased age and FMI, decreased FEV1 and
FVC, more frequent exacerbations and higher Charl-son comorbidity index were also predictors for lower 6MWD at any given time, but did not predict higher rate of decline over the timespan of the study. 2) Study participants with an IC/TLC ratio in the upper quartiles maintained their 6MWD from baseline to year 3, while it was significantly reduced for study participants with an IC/TLC ratio in the lower quartiles.
Longitudinal change in 6MWD
The analysis of data with repeated outcome measure-ments over time is complicated. Baseline predictor variables can be associated to the outcome at any given time point without actually predicting the time-related change in the outcome. It is the interaction of time and the baseline variable (effect modification) which shows whether there is a prediction of change in the outcome over time. In our study, only IC/TLC ratio interacted significantly with time, and as such, was the only variable to actually predict a change in the 6MWD. Table 2Predictors for mean 6MWD estimated with GEE regression analysis
Predictors Bivariate Multivariatea
Beta p Beta 95% CI p
Time < 0.001 < 0.001b
1 year vs. baseline 8.1 0.052 6.0 - 1.9–13.4 0.134
3 years vs. baseline - 21.0 < 0.001 - 24.1 - 35.1–- 13.9 < 0.001
Sex, (male vs. female) 35.1 0.002 - 28.8 - 60.1–2.5 0.072
Age (years) - 5.3 < 0.001 - 1.8 - 3.4–- 0.3 0.019
FEV1(L) 107.3 < 0.001 47.5 21.7–73.2 < 0.001
FVC (L) 57.1 < 0.001 20.9 5.2–36.7 0.009
IC/TLC ratio (at 0.35) 489.4 < 0.001 < 0.001c
At baseline 116.3 −10.0–242.7 0.071
At 1 year 175.2 25.1–325.4 0.022
At 3 years 454.2 263.3–645.2 < 0.001
FMI (kg/m2) - 8.2 < 0.001 - 8.3 - 12.2–- 4.4 < 0.001
FFMI (kg/m2) 5.2 0.008 1.3 - 3.6–6.3 0.592
Pack years - 0.2 0.577 - 0.2 - 0.7–0.3 0.421
Experienced > 2 exacerbations last year - 66.4 < 0.001 - 32.1 - 53.5–- 10.7 0.003
Charlson comorbidity index; score 0.001 0.006b
2 vs. 1 - 30.6 0.025 - 12.1 - 33.5–9.2 0.266
3 vs. 1 - 56.6 0.003 - 37.4 - 68.7–- 6.1 0.019
4 vs. 1 - 58.9 0.016 - 54.8 - 91.6–- 18.0 0.004
Light physical activity≥1 h/week 69.9 < 0.001 34.2 7.5–60.8 0.012
Hard physical activity≥1 h/week 66.4 < 0.001 37.0 18.6–55.4 < 0.001
Betaestimated regression coefficient,P p-value,CIconfidence interval,6MWD6-min walk distance,GEEgeneralized estimated equation,FEV1forced expiratory volume in one second,FVCforced vital capacity,IC/TLC ratioinspiratory-to-total lung capacity ratio,FMIfat mass index,FFMIfat free mass index
a
To our knowledge, only four previous studies have investigated risk factors for decline in functional exercise capacity assessed by the 6MWT in patients with COPD [12, 15, 28, 29]. Of these, only one study has examined the relationship between lung hyperinflation and func-tional exercise capacity. Ramon et al. [15] conducted a prospective cohort study with 342 patients with a clinic-ally stable COPD, and a mean follow-up period of 1.7 years. The study demonstrated that IC/TLC ratio and dyspnea score predicted decline in functional exercise capacity measured by 6MWD.
We confirmed the findings from Ramon et al. by dem-onstrating that IC/TLC ratio predicted longitudinal change in functional exercise capacity. However, patients in the study by Ramon et al. [15] were recruited during their first hospitalization due to a COPD exacerbation, and performed two 6MWTs, the first at least 3 months after discharge from hospital and the second 18–24 months after the first test. The period of follow-up was relatively short. Our study included a wide spectrum of patients with clinically stable COPD in GOLD stages II-IV that performed the 6MWT three times during a follow-up period of 3 years. We also demon-strated, irrespective of follow-up, associations between
a decrease in 6MWD and a decrease in FEV1 and
FVC, increased age, FMI, comorbidity and number of exacerbations and absence of light and hard physical activity.
Previous studies have demonstrated that airflow limi-tation (lower FEV1) and older age were risk factors for
longitudinal decline in functional exercise capacity [12, 28, 29]. In addition, Spruit et al. [29] found that lower body mass index (BMI) was a predictor for longitudinal change in functional exercise capacity. Our group has previously demonstrated in the same cohort as in this study, that lower levels of habitual hard physical activity is associated with an increased deterioration in func-tional exercise capacity [28]. In consistency with previ-ous research [12, 28,29], we demonstrated in this study that lower FEV1 and older age were associated with a
lower 6MWD. A lower FEV1is related to reduced
max-imal expiratory flow rates and impaired ventilatory capacity, being a limiting factor for functional exercise capacity.
Lung hyperinflation predisposes for a mechanical constraint on expansion of the tidal volume as the need for ventilation increases during exercise, resulting in exercise intolerance [9, 30]. Performing light and hard habitual physical activity demonstrated a positive associ-ation with 6MWD. However, these results were not significant when analyzing for time as an effect modifier. Physical activity improves exercise capacity and the function of the skeletal and muscle system, but it does not improve the bronchial obstruction in patients with COPD [31].
comorbidity index were predictors for a lower 6MWD. As previously demonstrated by Park et al. [8], progres-sion of lung hyperinflation is associated with more frequent exacerbations.
Studies have demonstrated that IC/TLC ratio declines over time in patients with COPD [7,32], including a re-cent study conducted by Park et al. [8] that demon-strated a decline in IC/TLC ratio over time at a mean rate of 0.70% per year. As such, one expects that the patients experience a progression of lung hyperinflation during the study period, associated with a decline in IC/TLC ratio [8]. Patients in the lower quartiles of IC/ TLC ratio experienced a higher decrease in 6MWD during the follow-up period compared to participants with an IC/TLC ratio in the higher quartiles, who maintained their 6MWD.
Different variables show up as significant predictors in different studies. Whether it is FEV1 or IC/TLC
ratio, or markers of clinical severity or body compos-ition, they all reflect status of the lung mechanics and clinical condition, which are the two most important factors describing the severity of the disease.
Functional exercise capacity
Functional exercise capacity is determined by central and peripheral factors, and the mechanism is complex [33]. In patients with COPD, exercise capacity is mainly limited by peripheral muscle fatigue, impaired
ventilatory mechanics and gas exchange [33, 34].
With an increased lung hyperinflation, the patients experiences increased work of breathing. The respira-tory muscles are placed at mechanical disadvantage due to adaptation of the diaphragm to chronic
over-load of the respiratory muscles [28, 35, 36]. This
results in impaired inspiratory muscle strength [37] and endurance [38], leading to dyspnea [39, 40] and reduced exercise capacity [41]. Breathing becomes more energy demanding and physical activity becomes increasingly uncomfortable, resulting in a decreased level of habitual physical activity, and secondly, a deterioration in functional exercise capacity.
Our results demonstrates that performing habitual physical activity at baseline was associated with 6MWD in a positive manner.
Lung hyperinflation
IC can be measured by spirometry, and lung hyperin-flation is therefore an easy way to evaluate the patient’s disease severity and risk for functional exer-cise capacity deterioration. Recent studies have dem-onstrated that IC can be within the normal range in patients with mild airway obstruction in GOLD stage I, although residual volume (RV) and functional
residual capacity (FRC) can be increased [8, 42],
pointing towards early hyperinflation. To be able to detect early hyperinflation, we chose to analyze IC/ TLC ratio, instead of IC alone. We could also have used the RV/TLC ratio as an explanatory variable, which is another widely used index for lung hyperin-flation. In order to compare our findings with those of Ramon et al. [15], we chose to use IC/TLC ratio.
We performed additional analyses with RV/TLC
instead of IC/TLC ratio, yielding approximately the same results.
Study strengths and limitations
The current study was a large cohort consisting of patients with clinically stable COPD in GOLD stages II-IV. The large sample size, wide spectrum of disease severity and quite even distribution among gender are clear strengths of our study. This prospective study is also one of few to consider the relationship between longitudinal change in 6MWD and IC/TLC ratio.
The 6MWT with 6MWD as main outcome is a widely used measure of functional exercise capacity in COPD, but the cardiopulmonary exercise test (CPET) performed on cycle ergometer or treadmill, is considered as the gold standard for evaluating causes of exercise intoler-ance in patients with COPD [43]. Peak oxygen uptake (VO2peak) is the main outcome of CPET. The association
between 6MWD and VO2peakhas shown to be moderate
to strong [44,45] and the 6MWD a reliable measure of walking capacity [46,47].
In healthy persons and patients with mild COPD, the 6MWT often shows a ceiling effect where it is the maximal walking speed rather than the ventilatory capacity that limits the 6MWD [28]. For some of our patients, the 6MWD was not different from the normal population. A longitudinal decline in 6MWD has been demonstrated in previous studies [12, 29], but this finding was only evident in patients with severe airflow obstruction. Even though there was a decline in 6MWD for patients in GOLD stages III and IV, the mean annual decline was less than 30 m that is considered the minimal clinically significant change [27].
The patients were evaluated three times during the follow-up period of 3 years, performing one 6MWT at each visit. Since the test-battery in the BCCS was comprehensive and demanding for the patients, only one 6MWT was performed at each visit rather than two, which is recommended by the ATS guidelines. By doing two tests, any learning effect is reduced. A
decline in 6MWD could therefore have been
This study was a subsample of the BCCS, in which patients with inflammatory diseases were excluded. However, patients with chronic diseases like heart fail-ure were included in the study. A possible limitation of our study is the possible effect that such comorbid disease could influence longitudinal change in 6MWD. Regardless, our findings are likely generalizable because comorbid diseases are common among patients with COPD and our study population is assumedly representa-tive for common COPD patients. This is also accounted for by including Charlson comorbidity index in the analyses.
Patients were free to receive medication and therapy, such as pulmonary rehabilitation, during the study. This may have influenced the longitudinal change in 6MWD. Frisk et al. [28] reported that patients participating in a pulmonary rehabilitation program during the study period reported a higher level of habitual physical activ-ity at 3 years follow-up. However, hard physical activactiv-ity and FEV1remained as significant predictors for change
in 6MWD when separate analyses were done for patients who did participate in pulmonary rehabilitation and those who did not [28].
Our study had a dropout rate of 32% from baseline to year 3. Most patients were lost to follow-up because of increased disease severity or death. Our dropout rate is comparable to the dropout rate of 31% in the study by Spruit et al. [29], which also had a study period of 3 years. The study by Casanova et al. [12] had a dropout rate of 34% during a study period of 5 years. In studies with COPD patients, an increasing dropout rate is hard to avoid due to progression of the disease during longi-tudinal studies.
Conclusion
Baseline IC/TLC ratio was a statistically significant predictor for longitudinal change in 6MWD over a period of 3 years. Patients with less lung hyperinfla-tion at baseline maintained their funchyperinfla-tional exercise capacity in the follow-up period, while it declined significantly in those with increased hyperinflation.
Clinical implications
Decline in functional exercise capacity can to a certain degree be prevented by therapeutic interventions such as pulmonary rehabilitation [48]. It is useful to be able to identify patients that are at particular risk for such deterioration, in order to modify the course of disease.
Abbreviations
6MWD:6-min walk distance; 6MWT: 6-min walk test; ATS: American Thoracic Society; BCCS: Bergen COPD Cohort Study; BMI: Body mass index; COPD: Chronic obstructive pulmonary disease; CPET: Cardiopulmonary exercise test; FEV1: Forced expiratory volume in 1 s; FFMI: Fat-free mass index;
FMI: Fat mass index; FRC: Functional residual capacity; FVC: Forced vital capacity; GEE: Generalized estimating equations; GOLD: Global Initiative for
Chronic obstructive lung disease; IC: Inspiratory capacity; IC/TLC: Inspiratory-to-total lung capacity; mMRC: Modified Medical Research Council; RV: Residual volume; VO2peak: Peak oxygen uptake
Acknowledgements Not applicable.
Funding
This research did not receive any specific grant from funding agencies in the public, commercial, or not-for-profit sectors.
Availability of data and materials
All data are securely stored on a research server connected to Haukeland University Hospital. We did not ask for permission to make the data available online in the informed consent obtained from the participants, and therefore the dataset cannot be shared.
Authors’contributions
Concept and design (LTA, BF, ET, JAH, TMLE, PSB). Data collection (LTA, BF, JAH, TMLE, PSB, ET). Data analyses and interpretation (LTA, BF, BE, JAH, ET). Drafting the manuscript (LTA, BF, ET, BE, JAH). All the authors have revised and approved the final manuscript.
Ethics approval and consent to participate
Participation in the study was voluntary. Both oral and written information was given, and written consent was obtained prior to inclusion. The study was approved by the Western Norway Regional Research Ethics Committee (REK 165.08).
Consent for publication Not applicable.
Competing interests
PSB has received speakers’fees from AstraZeneca, Boehringer Ingelheim, Pfizer unrelated to the current work, and received advisory board fees from Mundipharma, AstraZeneca, Boehringer Ingelheim, GlaxoSmithKline unrelated to the current work the last 36 months. TMLE reports speakers’ fees from AstraZeneca and Boehringer Ingelheim unrelated to the current work, within the last 36 months. All other authors declare no competing interests.
Publisher’s Note
Springer Nature remains neutral with regard to jurisdictional claims in published maps and institutional affiliations.
Author details
1Department of Clinical Science, University of Bergen, Bergen, Norway. 2
Centre for Evidence-Based Practice, Western Norway University of Applied Sciences, Bergen, Norway.3Department of Occupational Medicine, Haukeland University Hospital, Bergen, Norway.4Department of Thoracic Medicine, Haukeland University Hospital, Bergen, Norway.5Department of Health and Functioning, Western Norway University of Applied Sciences, Inndalsveien 28, 5063 Bergen, Norway.6Department of Physiotherapy, Haukeland University Hospital, Bergen, Norway.
Received: 13 July 2018 Accepted: 20 November 2018
References
1. World Health Organization. Chronic obstructive pulmonary disease (COPD). 2017. Available from:http://www.who.int/respiratory/copd/en/.
2. O'Donnell DE. Hyperinflation, dyspnea, and exercise intolerance in chronic obstructive pulmonary disease. Proc Am Thorac Soc. 2006;3(2):180–4. 3. Laveneziana PWK, O’Donnell DE. Static and Dynamic Hyperinflation in
Chronic Obstructive Pulmonary Disease. In: Mechanics of Breathing. 2nd ed; 2014. p. 73–97.
4. O'Donnell DE, Laveneziana P. Dyspnea and activity limitation in COPD: mechanical factors. COPD. 2007;4(3):225–36.
6. Jones PW. Activity limitation and quality of life in COPD. COPD. 2007;4(3):273–8. 7. Celli BR, Decramer M, Lystig T, Kesten S, Tashkin DP. Longitudinal inspiratory
capacity changes in chronic obstructive pulmonary disease. Respir Res. 2012;13:66.
8. Park J, Lee CH, Lee YJ, Park JS, Cho YJ, Lee JH, et al. Longitudinal changes in lung hyperinflation in COPD. Int J Chron Obstruct Pulmon Dis. 2017;12:501–8. 9. O'Donnell DE, Guenette JA, Maltais F, Webb KA. Decline of resting
inspiratory capacity in COPD: the impact on breathing pattern, dyspnea, and ventilatory capacity during exercise. Chest. 2012;141(3):753–62. 10. Laboratories ATSCoPSfCPF. ATS statement: guidelines for the six-minute
walk test. Am J Respir Crit Care Med. 2002;166(1):111–7.
11. Casanova C, Cote C, de Torres JP, Aguirre-Jaime A, Marin JM, Pinto-Plata V, et al. Inspiratory-to-total lung capacity ratio predicts mortality in patients with chronic obstructive pulmonary disease. Am J Respir Crit Care Med. 2005;171(6):591–7.
12. Casanova C, Cote CG, Marin JM, de Torres JP, Aguirre-Jaime A, Mendez R, et al. The 6-min walking distance: long-term follow up in patients with COPD. Eur Respir J. 2007;29(3):535–40.
13. Oga T, Nishimura K, Tsukino M, Sato S, Hajiro T, Mishima M. Exercise capacity deterioration in patients with COPD: longitudinal evaluation over 5 years. Chest. 2005;128(1):62–9.
14. Pinto-Plata VM, Cote C, Cabral H, Taylor J, Celli BR. The 6-min walk distance: change over time and value as a predictor of survival in severe COPD. Eur Respir J. 2004;23(1):28–33.
15. Ramon MA, Ferrer J, Gimeno-Santos E, Donaire-Gonzalez D, Rodriguez E, Balcells E, et al. Inspiratory capacity-to-total lung capacity ratio and dyspnoea predict exercise capacity decline in COPD. Respirology. 2016;21(3):476–82. 16. Eagan TM, Ueland T, Wagner PD, Hardie JA, Mollnes TE, Damas JK, et al. Systemic inflammatory markers in COPD: results from the Bergen COPD cohort study. Eur Respir J. 2010;35(3):540–8.
17. Vestbo J, Hurd SS, Agusti AG, Jones PW, Vogelmeier C, Anzueto A, et al. Global strategy for the diagnosis, management, and prevention of chronic obstructive pulmonary disease: GOLD executive summary. Am J Respir Crit Care Med. 2013;187(4):347–65.
18. Johannessen A, Lehmann S, Omenaas ER, Eide GE, Bakke PS, Gulsvik A. Post-bronchodilator spirometry reference values in adults and implications for disease management. Am J Respir Crit Care Med. 2006;173(12):1316–25. 19. Borg GA. Psychophysical bases of perceived exertion. Med Sci Sports Exerc.
1982;14(5):377–81.
20. Kurtze N, Rangul V, Hustvedt BE, Flanders WD. Reliability and validity of self-reported physical activity in the Nord-Trondelag health study (HUNT 2). Eur J Epidemiol. 2007;22(6):379–87.
21. Kurtze N, Rangul V, Hustvedt BE, Flanders WD. Reliability and validity of self-reported physical activity in the Nord-Trondelag health study: HUNT 1. Scand J Public Health. 2008;36(1):52–61.
22. Holmen J, Midthjell K, Krüger Ø, Langhammer A, Holmen TL, Bratberg GH, et al. The Nord-Trøndelag health study 1995-97 (HUNT 2): objectives, contents, methods and participation. Norsk Epidemiologi. 2003;13(1):19–32.
23. Miller MR, Hankinson J, Brusasco V, Burgos F, Casaburi R, Coates A, et al. Standardisation of spirometry. Eur Respir J. 2005;26(2):319–38. 24. Wanger J, Clausen JL, Coates A, Pedersen OF, Brusasco V, Burgos F, et al.
Standardisation of the measurement of lung volumes. Eur Respir J. 2005; 26(3):511–22.
25. Bestall JC, Paul EA, Garrod R, Garnham R, Jones PW, Wedzicha JA. Usefulness of the Medical Research Council (MRC) dyspnoea scale as a measure of disability in patients with chronic obstructive pulmonary disease. Thorax. 1999;54(7):581–6.
26. Twisk JW. Applied Longitudinal Data Analysis for Epidemiology: A Practical Guide. 2nd ed. Cambridge: Cambridge University Press; 2013.
27. Singh SJ, Puhan MA, Andrianopoulos V, Hernandes NA, Mitchell KE, Hill CJ, et al. An official systematic review of the European Respiratory Society/American Thoracic Society: measurement properties of field walking tests in chronic respiratory disease. Eur Respir J. 2014;44(6): 1447–78.
28. Frisk B, Espehaug B, Hardie JA, Strand LI, Moe-Nilssen R, Eagan TM, et al. Physical activity and longitudinal change in 6-min walk distance in COPD patients. Respir Med. 2014;108(1):86–94.
29. Spruit MA, Polkey MI, Celli B, Edwards LD, Watkins ML, Pinto-Plata V, et al. Predicting outcomes from 6-minute walk distance in chronic obstructive pulmonary disease. J Am Med Dir Assoc. 2012;13(3):291–7.
30. Guenette JA, Webb KA, O'Donnell DE. Does dynamic hyperinflation contribute to dyspnoea during exercise in patients with COPD? Eur Respir J. 2012;40(2):322–9.
31. Casaburi R, ZuWallack R. Pulmonary rehabilitation for management of chronic obstructive pulmonary disease. N Engl J Med. 2009;360(13):1329–35. 32. Cortopassi F, Celli B, Divo M, Pinto-Plata V. Longitudinal changes in
handgrip strength, hyperinflation, and 6-minute walk distance in patients with COPD and a control group. Chest. 2015;148(4):986–94.
33. Pepin V, Saey D, Laviolette L, Maltais F. Exercise capacity in chronic obstructive pulmonary disease: mechanisms of limitation. COPD. 2007;4(3):195–204. 34. Killian KJ, Leblanc P, Martin DH, Summers E, Jones NL, Campbell EJ. Exercise
capacity and ventilatory, circulatory, and symptom limitation in patients with chronic airflow limitation. Am Rev Respir Dis. 1992;146(4):935–40. 35. Levine S, Gregory C, Nguyen T, Shrager J, Kaiser L, Rubinstein N, et al.
Bioenergetic adaptation of individual human diaphragmatic myofibers to severe COPD. J Appl Physiol (1985). 2002;92(3):1205–13.
36. Levine S, Kaiser L, Leferovich J, Tikunov B. Cellular adaptations in the diaphragm in chronic obstructive pulmonary disease. N Engl J Med. 1997; 337(25):1799–806.
37. Rochester DF, Braun NM. Determinants of maximal inspiratory pressure in chronic obstructive pulmonary disease. Am Rev Respir Dis. 1985;132(1):42–7. 38. Perez T, Becquart LA, Stach B, Wallaert B, Tonnel AB. Inspiratory muscle
strength and endurance in steroid-dependent asthma. Am J Respir Crit Care Med. 1996;153(2):610–5.
39. Killian KJ. Sense of effort and dyspnoea. Monaldi Arch Chest Dis. 1998;53(6):654–60. 40. Hamilton AL, Killian KJ, Summers E, Jones NL. Muscle strength, symptom
intensity, and exercise capacity in patients with cardiorespiratory disorders. Am J Respir Crit Care Med. 1995;152(6 Pt 1):2021–31.
41. Maltais F, Simard AA, Simard C, Jobin J, Desgagnes P, LeBlanc P. Oxidative capacity of the skeletal muscle and lactic acid kinetics during exercise in normal subjects and in patients with COPD. Am J Respir Crit Care Med. 1996;153(1):288–93.
42. Deesomchok A, Webb KA, Forkert L, Lam YM, Ofir D, Jensen D, et al. Lung hyperinflation and its reversibility in patients with airway obstruction of varying severity. COPD. 2010;7(6):428–37.
43. Force ERST, Palange P, Ward SA, Carlsen KH, Casaburi R, Gallagher CG, et al. Recommendations on the use of exercise testing in clinical practice. Eur Respir J. 2007;29(1):185–209.
44. Oga T, Nishimura K, Tsukino M, Hajiro T, Ikeda A, Mishima M. Relationship between different indices of exercise capacity and clinical measures in patients with chronic obstructive pulmonary disease. Heart Lung. 2002;31(5):374–81.
45. Hill K, Jenkins SC, Cecins N, Philippe DL, Hillman DR, Eastwood PR. Estimating maximum work rate during incremental cycle ergometry testing from six-minute walk distance in patients with chronic obstructive pulmonary disease. Arch Phys Med Rehabil. 2008;89(9):1782–7. 46. Hernandes NA, Wouters EF, Meijer K, Annegarn J, Pitta F, Spruit MA.
Reproducibility of 6-minute walking test in patients with COPD. Eur Respir J. 2011;38(2):261–7.
47. Eiser N, Willsher D, Dore CJ. Reliability, repeatability and sensitivity to change of externally and self-paced walking tests in COPD patients. Respir Med. 2003;97(4):407–14.