RESEARCH
The telestroke and thrombolysis therapy
in diabetic stroke patients
Thomas I. Nathaniel
*, Chibueze Ubah, Leah Wormack and Jordan Gainey
Abstract
Objective: Several controversial findings have been reported on treatment outcomes for diabetic stroke patients that received thrombolysis therapy in the hospital. We determined whether the association between telestroke technology, thrombolysis therapy and clinical risk factors in diabetic acute ischemic stroke may result in the inclusion or exclusion or more diabetic ischemic stroke patients for thrombolysis therapy.
Methods: Retrospective data that comprises of a total of 3202 acute ischemic stroke patients from a regional stroke registry that contained telestroke and non telestroke patients with a primary diagnosis of acute ischemic stroke of which 312 were identified as diabetic stroke patients were used in this study. Multivariate logistic regression models were used to determine the associated pre-clinical risk factors, and demographics associated with recombinant tissue plasminogen activator (rtPA) therapy in a subset of diabetic acute ischemic stroke patients in the telestroke and non-telestroke settings.
Results: In the telestroke, only higher International Normalized Ratio (INR) [odds ratio, OR = 0.063 (0.003–1.347, 95% confidence interval (CI)] was associated with exclusion from thrombolysis. Direct admission [OR, 3.141 (1–9.867), 95% CI] and telestroke [OR, 4.87 (1.834–12.928), 95% CI] were independent predictors in the inclusion for thrombolysis therapy. In the non telestroke, older age (> 80 years) [(OR), 0.955 (0.922–0.989), 95% CI], higher blood glucose level [OR, 0.994 (0.99–0.999); 95% CI], higher INR [OR, 0.113 (0.014–0.944); 95% CI], and renal insufficiency [OR, 0.163 (0.033–0.791); 95% CI] were associated with exclusion while higher NIH stroke scale [OR, 1.068 (1.009–1.13); 95% CI] was associated with inclusion for thrombolysis in the non telestroke.
Conclusion: The non-telestroke setting admitted more diabetic stroke patients to the hospital, but more were excluded from thrombolysis therapy when compared with the telestroke setting. Measures to improve clinical risk factors that excluded more diabetic ischemic stroke patients in the non telestroke will improve the use of thrombolysis in the treatment of diabetic acute ischemic stroke patients.
Keywords: Acute stroke, Diabetes mellitus, Exclusion, Inclusion, Telestroke, Non telestroke
© The Author(s) 2019. This article is distributed under the terms of the Creative Commons Attribution 4.0 International License (http://creat iveco mmons .org/licen ses/by/4.0/), which permits unrestricted use, distribution, and reproduction in any medium, provided you give appropriate credit to the original author(s) and the source, provide a link to the Creative Commons license, and indicate if changes were made. The Creative Commons Public Domain Dedication waiver (http://creat iveco mmons .org/ publi cdoma in/zero/1.0/) applies to the data made available in this article, unless otherwise stated.
Introduction
Diabetes mellitus is a frequently identified comorbid risk factor in acute ischemic stroke. The risk of ischemic stroke in diabetic patients is twofold higher when com-pared to people without diabetes [1]. This underlies the close relationship between these two co-occurring com-mon diseases. Though the disease processes are closely related, controversial findings have been reported on
treatment outcomes for diabetic stroke patients that received thrombolysis therapy [2–6]. This is because the management of diabetic stroke patients is complicated, and this results in most of the observed controversial outcomes.
Although diabetes is not an absolute or relative exclu-sion criteria for thrombolysis, a low rate of thrombolysis therapy has been reported in diabetic ischemic stroke patients due to concerns over poorer outcomes [7]. Proposed factors for the poor response include stroke severity [8], a higher risk of developing post stroke hyper-glycemia [9] and vascular risk factors [2]. Thrombolysis
Open Access
*Correspondence: nathanit@greenvillemed.sc.ed
is known to produce better outcomes in stroke patients when compared with diabetic stroke patients [6], and clinical trials [10] did not suggest the withholding of thrombolysis therapy from diabetic stroke patients [11]. Moreover, existing studies suggest that the lower rate of thrombolysis therapy in diabetic stroke patients does not appear to be related to contraindications for throm-bolysis because a comparison of contraindications for thrombolysis between ischemic stroke patients with and without diabetes did not reveal a significant difference [12].
It has been shown that a practice-based model of tel-estroke can manage pretreatment clinical risk factors for thrombolysis therapy relaxing the criteria for the inclu-sion or excluinclu-sion for thrombolysis in ischemic stroke patients [13]. Although the telestroke is known with favorable outcomes in acute ischemic stroke [13–17], however, the effect of telestroke technology in enhanc-ing the use of thrombolysis therapy in diabetic stroke patients when compared with treatment is not known. We know that several studies in non telestroke settings, reveal controversial findings on treatment outcomes for diabetic stroke patients that received thrombolysis therapy. While some studies report poorer outcomes in diabetic ischemic stroke patients when compared with non-diabetic acute ischemic stroke patients [2–4], others have shown the safety and beneficial effects of recombi-nant tissue plasminogen activator (rtPA) [5, 6]. It is also known that treatment outcomes in telestroke programs have been favorable, and consistent with good expecta-tions in several studies in acute ischemic stroke [13–19]. What is not known is whether the association between telestroke technology, thrombolysis therapy and clinical risk factors in diabetic acute ischemic stroke may result in the inclusion or exclusion of diabetic ischemic stroke patients for thrombolysis therapy. We investigated this issue in a population of diabetic acute ischemic stroke patients treated in a telestroke and compared our find-ings with a non telestroke setting. We used multivariate models to predict the odds of including more diabetic stroke patients for thrombolysis therapy in the telestroke when compared with the non telestroke setting. The cur-rent study investigated telestroke technology in the use of thrombolysis therapy in diabetic acute ischemic stroke patients with various baseline clinical risk factors.
Method
Patient selection and baseline characteristics
Retrospective data were collected from the acute ischemic stroke registry of Greenville Health System (GHS) between January 2010 and June 2016. The regis-try has been described in our previous studies [20–23]. Patients were selected with prospective inclusion of
consecutive patients with diabetic acute ischemic stroke treated in a stroke center (non-telestroke) and telestroke network. Data for the various pre-clinical risk factors was extracted including; atrial fib/flutter, carotid artery stenosis, congestive heart failure, depression, dyslipi-demia, coronary artery disease, family history of stroke, hormone replacement therapy, hypertension, migraine, obesity, peripheral vascular disease, previous stroke, previous TIA, prosthetic heart valve, renal insufficiency, sleep apnea, smoking, substance abuse. Additional vari-ables from time of admission were also included. The National Institutes of Health stroke scale (NIHSS) was used to evaluate severity of neurologic impairment. Laboratory analysis for the concentrations of total cho-lesterol, low-density lipoprotein cholesterol (LDL), tri-glycerides, lipids, high-density lipoprotein cholesterol (HDL), blood glucose and creatine were obtained at admission. Values for systolic blood pressure, diastolic blood pressure and International Normalized Ratio (INR) were determined.
Upon admission, all patients underwent brain com-puted tomography. Patients with subarachnoid and intracerebral hemorrhage were excluded in our analysis. A standardized stroke protocol was used in all patients, including T2-weighted, T1-weighted, and diffusion-weighted images. Data on symptom onset time and the admission to Emergency Department (ED) for both tel-estroke and non teltel-estroke diabetic stroke patients were collected. Patients that were directly admitted to the ED or with emergency medical services (EMS) and those with indirect admission by being transferred to the ED in the telestroke or non telestroke from another hospi-tal were also identified. Data on patient demographics, including age, sex, race, and ethnicity were also extracted Information on the ambulation status prior to event, dur-ing and at discharge were also collected. Ethical approval was obtained from the Institutional Review Board of Greenville Health System and the institutional Commit-tee for Ethics.
Data analysis
Pearson’s Chi Squared analyses. Descriptive statistics were calculated for the demographic and clinical char-acteristics of patients. All continuous variables were pre-sented as mean (STD), and comparisons between groups were determined using the Student’s T test. All variables presented in Tables 1 and 2 were analyzed using univari-ate analysis while multivariunivari-ate models were used to iden-tify significant associations with exclusion or inclusion for thrombolysis therapy in the whole diabetic stroke population in telestroke and non telestroke settings (see Tables 3, 4 and 5). Adjustments in the multivariate analy-sis were based on univariate significance. Subsequent multivariate logistic regression was based on risk factors in diabetic stroke patients associated with thromboly-sis therapy and specific for telestroke or non telestroke identified by the univariate analysis. This analysis identi-fied independent predictors of exclusion or inclusion for thrombolysis therapy. The multivariable model was built by stepwise conditional logistic regression. We used a backward procedure as a follow-up to test the modeling strategy, while the test for the log likelihood was used to assess the suitability of fit and to compare nested mod-els. All variables that produced changes > 10% of the odds ratio (OR) when eliminated were considered to be con-founding variables, while variables with a value of P < 0.01 on univariate testing were included. All stepwise regres-sion models were assessed using Hosmer & Lemeshow test, Cox & Snell R2 and Classification Plots. Multicol-linearity of variables were assessed with variance infla-tion factor analysis to confirm independence of variables included in regression model.
Results
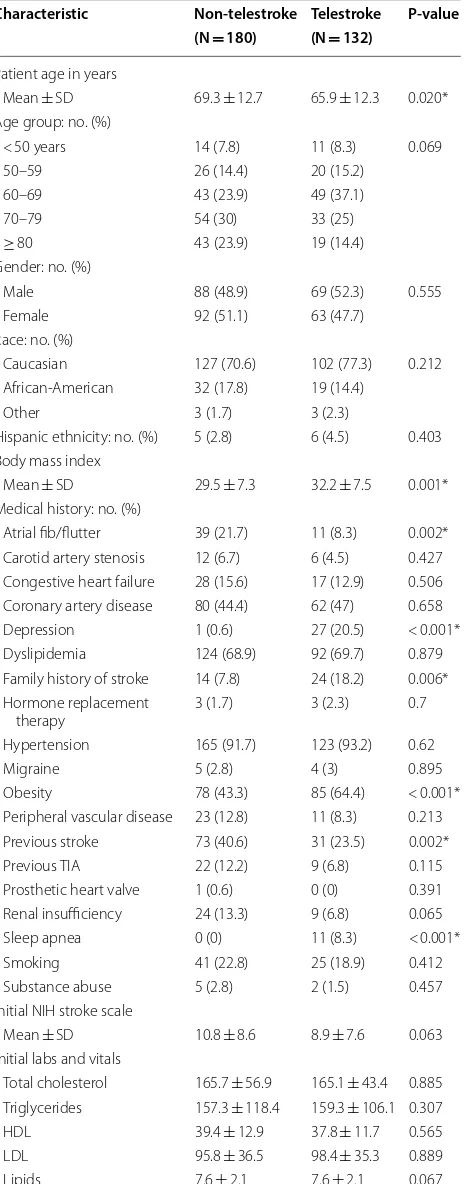
A total of 3202 acute ischemic stroke patients were col-lected from the stroke registry, 312 were identified as diabetic stroke patients. Of the 312, 180 were in the non-telestroke setting and 132 in the non-telestroke setting. Com-parisons between the baseline demographic and clinical characteristics of telestroke and non-telestroke diabetic acute ischemic stroke patients are presented in Table 1. Telestroke patients tended to be younger (65.9 ± 12.3 vs. 69.3 ± 12.7), have a higher body mass index (32.2 ± 7.5 vs. 29.5 ± 7.3), less likely to have a history of atrial fibril-lation (8.3% vs. 21.7%), or a previous stroke (23.5% vs. 40.6%), more likely to have a family history of stroke (18.2% vs. 7.8%) and obese (64.4% vs. 43.3%). At the time of presentation, telestroke patients had a lower creatinine (1.2 ± 1.0 vs. 1.5 ± 1.1) and lower diastolic blood pressure (78.8 ± 17.1 vs. 81.8 ± 19.2). Telestroke patients tended to have a better ambulatory status at baseline, at the time of presentation and at discharge. Telestroke patients were more likely to be directly admitted (71.2% vs. 11.7%) and more likely to receive rtPA (86.4% vs. 37.8%). Multivariate
analysis reveals three factors more associated with tele-stroke patients than non-teletele-stroke patients: obesity [OR, 2.493 (1.135–5.475); 95% CI, P = 0.023], direct admission [OR, 14.248 (6.012–33.766); 95% CI, P < 0.001], and rtPA administration obesity [OR, 1.068 (1.009–1.13); 95% CI, P < 0.001].
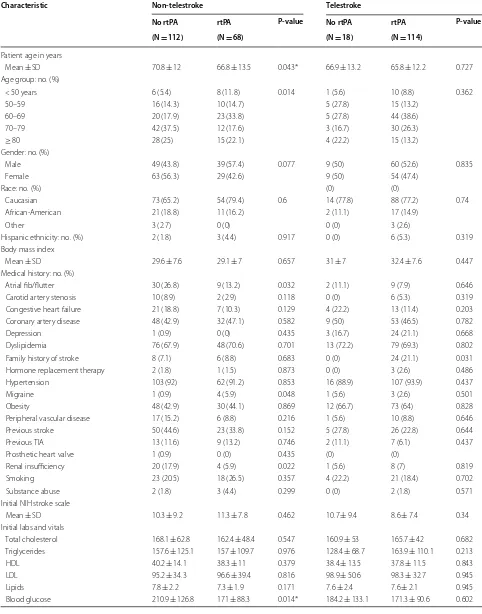
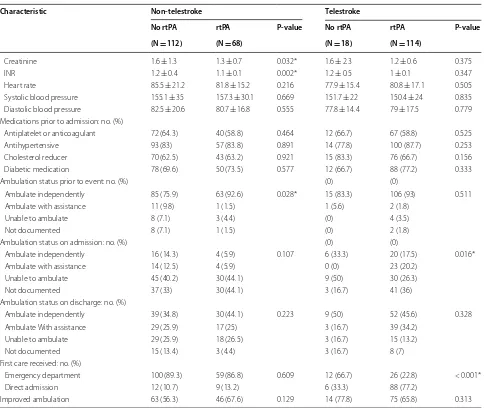
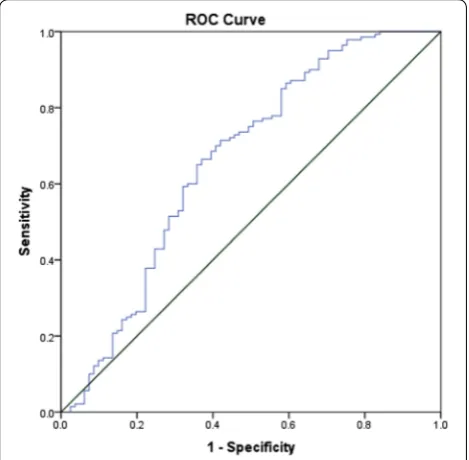
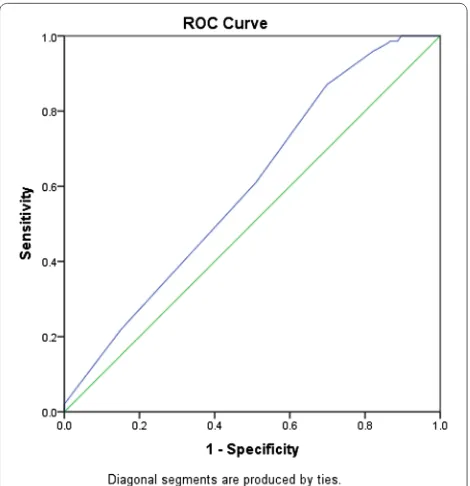
As shown in Table 2, non-telestroke patients who received rtPA were more likely to be younger (66.8 ± 13.5 vs. 70.8 ± 12), have a lower blood glucose level (171 ±88 vs. 210.9 ±126.8), have a lower creatinine 1.3 ± 0.7 vs. 1.6 ± 1.3), a lower INR (1.1 ± 0.1 vs. 1.2 ± 0.4), and present a better ambulatory status at baseline than patients who did not receive rtPA. In the telestroke, patients who received rtPA were more likely to have a worse ambulatory status at presentation and more likely to be directly admitted (77.2% vs. 33.3%). Multivariate analysis reveals four factors associated with rtPA (Table 3). Higher INR [OR, 0.139 (0.029–0.67); 95% CI, P = 0.014] and congestive heart failure [OR, 0.329 (0.124–0.878); 95% CI, P = 0.026] were associated with rtPA exclusion while direct admission [OR = 3.141 (1–9.867); 95% CI, P = 0.050] and being a telestroke patient [OR, 4.87 (1.834–12.928); 95% CI, P = 0.0001] were more associated with rtPA inclusion. The ROC curve for the predictive power of the regression model is presented in Fig. 1. The discriminating capability of the model was very good as shown by the ROC curve, with area under the curve (AUROC) of AUROC = 0.774 (95% CI, 0.712–0.836, P < 0.00). In the non-telestroke (Table 4), older age (> 80 years) [OR, 0.955 (0.922– 0.989;95% CI, P = 0.009], higher blood glucose level
[OR, 0.994 (0.99–0.999);95% CI, P = 0.0014], higher
INR [OR, 0.113 (0.014–0.944);95% CI, P = 0.004], and
renal insufficiency [OR, 0.163 (0.033–0.024);95% CI, P = 0.004], were all associated with rtPA exclusion
while higher NIH stroke scale [OR, 1.068 (1.009– 1.13);95% CI, P = 0.023] was associated with rtPA
inclusion. As presented in Fig. 2, the predictive power of the logistic regression was strong. The area under the curve (AUROC) is 0.678 (95% CI, 0.639–0.718, P < 0.01). In the telestroke (Table 5), only higher INR [OR, 0.063 (0.003–1.347) 95% CI, P = 0.077]) was
associated with rtPA exclusion and the association was not significant. The predictive model power of the logistic regression was strong (Fig. 3), AUROC = 0.678
(95% CI, 0.639–0.718, P<0.05).
Discussion
setting. Following the adjustment for comorbidities, the telestroke setting represents the strongest predictor for the administration of thrombolysis therapy. In both telestroke and non-telestroke diabetic acute ischemic stroke patients, direct admission represents a predictor for administration of thrombolysis therapy. In the univariate analysis, non-telestroke diabetic stroke patients who received thrombolysis were more likely to be younger, have a lower blood glucose level, lower creatinine, lower INR, and present with a better ambulatory status at baseline than the patients Table 1 Demographic factors and clinical characteristics
of acute ischemic stroke patients with a history of diabetes divided by telestroke status
Characteristic Non-telestroke Telestroke P-value (N = 180) (N = 132)
Patient age in years
Mean ± SD 69.3 ± 12.7 65.9 ± 12.3 0.020* Age group: no. (%)
< 50 years 14 (7.8) 11 (8.3) 0.069 50–59 26 (14.4) 20 (15.2)
60–69 43 (23.9) 49 (37.1)
70–79 54 (30) 33 (25)
≥ 80 43 (23.9) 19 (14.4)
Gender: no. (%)
Male 88 (48.9) 69 (52.3) 0.555 Female 92 (51.1) 63 (47.7)
Race: no. (%)
Caucasian 127 (70.6) 102 (77.3) 0.212 African-American 32 (17.8) 19 (14.4)
Other 3 (1.7) 3 (2.3)
Hispanic ethnicity: no. (%) 5 (2.8) 6 (4.5) 0.403 Body mass index
Mean ± SD 29.5 ± 7.3 32.2 ± 7.5 0.001* Medical history: no. (%)
Atrial fib/flutter 39 (21.7) 11 (8.3) 0.002* Carotid artery stenosis 12 (6.7) 6 (4.5) 0.427 Congestive heart failure 28 (15.6) 17 (12.9) 0.506 Coronary artery disease 80 (44.4) 62 (47) 0.658 Depression 1 (0.6) 27 (20.5) < 0.001* Dyslipidemia 124 (68.9) 92 (69.7) 0.879 Family history of stroke 14 (7.8) 24 (18.2) 0.006* Hormone replacement
therapy 3 (1.7) 3 (2.3) 0.7
Hypertension 165 (91.7) 123 (93.2) 0.62
Migraine 5 (2.8) 4 (3) 0.895
Obesity 78 (43.3) 85 (64.4) < 0.001* Peripheral vascular disease 23 (12.8) 11 (8.3) 0.213 Previous stroke 73 (40.6) 31 (23.5) 0.002* Previous TIA 22 (12.2) 9 (6.8) 0.115 Prosthetic heart valve 1 (0.6) 0 (0) 0.391 Renal insufficiency 24 (13.3) 9 (6.8) 0.065 Sleep apnea 0 (0) 11 (8.3) < 0.001* Smoking 41 (22.8) 25 (18.9) 0.412 Substance abuse 5 (2.8) 2 (1.5) 0.457 Initial NIH stroke scale
Mean ± SD 10.8 ± 8.6 8.9 ± 7.6 0.063 Initial labs and vitals
Total cholesterol 165.7 ± 56.9 165.1 ± 43.4 0.885 Triglycerides 157.3 ± 118.4 159.3 ± 106.1 0.307 HDL 39.4 ± 12.9 37.8 ± 11.7 0.565 LDL 95.8 ± 36.5 98.4 ± 35.3 0.889 Lipids 7.6 ± 2.1 7.6 ± 2.1 0.067
Table 1 (continued)
Characteristic Non-telestroke Telestroke P-value (N = 180) (N = 132)
Blood glucose 195.8 ± 115.2 173 ± 97 0.054 Creatinine 1.5 ± 1.1 1.2 ± 1 0.007* INR 1.1 ± 0.3 1 ± 0.2 0.074 Heart rate 84.1 ± 19.2 80.4 ± 16.9 0.097 Systolic blood pressure 155.9 ± 33.2 150.6 ± 23.6 0.158 Diastolic blood pressure 81.8 ± 19.2 78.8 ± 17.1 <0.001* Medications prior to admission: no. (%)
Antiplatelet or
anticoagu-lant 112 (62.2) 79 (59.8) 0.671 Antihypertensive 150 (83.3) 114 (86.4) 0.464 Cholesterol reducer 113 (62.8) 91 (68.9) 0.258 Diabetic medication 128 (71.1) 100 (75.8) 0.361 Ambulation status prior to event: no. (%)
Ambulate independently 148 (82.2) 121 (91.7) 0.106 Ambulate with assistance 12 (6.7) 3 (2.3)
Unable to ambulate 11 (6.1) 5 (3.8) Not documented 9 (5) 3 (2.3) Ambulation status on admission: no. (%)
Ambulate independently 20 (11.1) 26 (19.7) 0.016* Ambulate with assistance 18 (10) 23 (17.4)
Unable to ambulate 75 (41.7) 39 (29.5) Not documented 67 (37.2) 44 (33.3) Ambulation status on discharge: no. (%)
Ambulate independently 69 (38.3) 61 (46.2) 0.044* Ambulate with assistance 46 (25.6) 42 (31.8)
Unable to ambulate 47 (26.1) 18 (13.6) Not documented 18 (10) 11 (8.3) First care received: no. (%)
Emergency department 159 (88.3) 38 (28.8) < 0.001* Direct admission 21 (11.7) 94 (71.2)
rtPA administration 68 (37.8) 114 (86.4) < 0.001* Improved ambulation 109 (60.6) 89 (67.4) 0.213 Continuous variables are represented as Mean ± S.D. and comparisons between groups are made with a Student’s T Test. Discrete variables are represented as Count (Percent Frequency) and comparisons between groups were made using Pearson’s Chi Squared
Table 2 Clinical characteristics, medical history, and presenting symptoms of acute ischemic stroke patients with a history of diabetes stratified by rtPA status and telestroke status
Characteristic Non-telestroke Telestroke
No rtPA rtPA P-value No rtPA rtPA P-value
(N = 112) (N = 68) (N = 18) (N = 114)
Patient age in years
Mean ± SD 70.8 ± 12 66.8 ± 13.5 0.043* 66.9 ± 13.2 65.8 ± 12.2 0.727 Age group: no. (%)
< 50 years 6 (5.4) 8 (11.8) 0.014 1 (5.6) 10 (8.8) 0.362
50–59 16 (14.3) 10 (14.7) 5 (27.8) 15 (13.2)
60–69 20 (17.9) 23 (33.8) 5 (27.8) 44 (38.6)
70–79 42 (37.5) 12 (17.6) 3 (16.7) 30 (26.3)
≥ 80 28 (25) 15 (22.1) 4 (22.2) 15 (13.2)
Gender: no. (%)
Male 49 (43.8) 39 (57.4) 0.077 9 (50) 60 (52.6) 0.835
Female 63 (56.3) 29 (42.6) 9 (50) 54 (47.4)
Race: no. (%) (0) (0)
Caucasian 73 (65.2) 54 (79.4) 0.6 14 (77.8) 88 (77.2) 0.74
African-American 21 (18.8) 11 (16.2) 2 (11.1) 17 (14.9)
Other 3 (2.7) 0 (0) 0 (0) 3 (2.6)
Hispanic ethnicity: no. (%) 2 (1.8) 3 (4.4) 0.917 0 (0) 6 (5.3) 0.319 Body mass index
Mean ± SD 29.6 ± 7.6 29.1 ± 7 0.657 31 ± 7 32.4 ± 7.6 0.447 Medical history: no. (%)
Atrial fib/flutter 30 (26.8) 9 (13.2) 0.032 2 (11.1) 9 (7.9) 0.646 Carotid artery stenosis 10 (8.9) 2 (2.9) 0.118 0 (0) 6 (5.3) 0.319 Congestive heart failure 21 (18.8) 7 (10.3) 0.129 4 (22.2) 13 (11.4) 0.203 Coronary artery disease 48 (42.9) 32 (47.1) 0.582 9 (50) 53 (46.5) 0.782
Depression 1 (0.9) 0 (0) 0.435 3 (16.7) 24 (21.1) 0.668
Dyslipidemia 76 (67.9) 48 (70.6) 0.701 13 (72.2) 79 (69.3) 0.802
Family history of stroke 8 (7.1) 6 (8.8) 0.683 0 (0) 24 (21.1) 0.031 Hormone replacement therapy 2 (1.8) 1 (1.5) 0.873 0 (0) 3 (2.6) 0.486
Hypertension 103 (92) 62 (91.2) 0.853 16 (88.9) 107 (93.9) 0.437
Migraine 1 (0.9) 4 (5.9) 0.048 1 (5.6) 3 (2.6) 0.501
Obesity 48 (42.9) 30 (44.1) 0.869 12 (66.7) 73 (64) 0.828
Peripheral vascular disease 17 (15.2) 6 (8.8) 0.216 1 (5.6) 10 (8.8) 0.646 Previous stroke 50 (44.6) 23 (33.8) 0.152 5 (27.8) 26 (22.8) 0.644
Previous TIA 13 (11.6) 9 (13.2) 0.746 2 (11.1) 7 (6.1) 0.437
Prosthetic heart valve 1 (0.9) 0 (0) 0.435 (0) (0)
Renal insufficiency 20 (17.9) 4 (5.9) 0.022 1 (5.6) 8 (7) 0.819
Smoking 23 (20.5) 18 (26.5) 0.357 4 (22.2) 21 (18.4) 0.702
Substance abuse 2 (1.8) 3 (4.4) 0.299 0 (0) 2 (1.8) 0.571
Initial NIH stroke scale
Mean ± SD 10.3 ± 9.2 11.3 ± 7.8 0.462 10.7 ± 9.4 8.6 ± 7.4 0.34 Initial labs and vitals
who did not receive thrombolysis. In the telestroke setting, diabetic acute ischemic stroke patients who received thrombolysis were more likely to have a worse ambulatory status at presentation and more likely to be directly admitted to the emergency department.
In the adjusted analysis for the total diabetic stroke population, only direct admission and being treated in the telestroke setting were independent variables associated with administration of thrombolysis therapy. The non-telestroke setting admitted more diabetic stroke patients, but more were excluded from thrombolysis therapy when compared with the telestroke setting. This may be connected with a higher rate of hospital admission of patients with
highly variable clinical risk factors, resulting in the exclusion of more admitted patients from thrombolysis therapy when compared with the telestroke setting. In the adjusted analysis for the non-telestroke setting, age (> 80), higher blood glucose level, and renal insufficiency were all associated with exclusion from thrombolysis. The benefits of thrombolysis therapy have been shown in many studies [20, 22– 30]. Findings indicate higher functional dependency in stroke patients older than 80 years that received thrombolysis therapy [31–36]. The observed poor functional outcome appeared to be linked to poorer baseline clinical conditions such as congestive heart failure, ischemic heart disease, and hypertension Table 2 (continued)
Characteristic Non-telestroke Telestroke
No rtPA rtPA P-value No rtPA rtPA P-value
(N = 112) (N = 68) (N = 18) (N = 114)
Creatinine 1.6 ± 1.3 1.3 ± 0.7 0.032* 1.6 ± 2.3 1.2 ± 0.6 0.375
INR 1.2 ± 0.4 1.1 ± 0.1 0.002* 1.2 ± 0.5 1 ± 0.1 0.347
Heart rate 85.5 ± 21.2 81.8 ± 15.2 0.216 77.9 ± 15.4 80.8 ± 17.1 0.505 Systolic blood pressure 155.1 ± 35 157.3 ± 30.1 0.669 151.7 ± 22 150.4 ± 24 0.835 Diastolic blood pressure 82.5 ± 20.6 80.7 ± 16.8 0.555 77.8 ± 14.4 79 ± 17.5 0.779 Medications prior to admission: no. (%)
Antiplatelet or anticoagulant 72 (64.3) 40 (58.8) 0.464 12 (66.7) 67 (58.8) 0.525 Antihypertensive 93 (83) 57 (83.8) 0.891 14 (77.8) 100 (87.7) 0.253 Cholesterol reducer 70 (62.5) 43 (63.2) 0.921 15 (83.3) 76 (66.7) 0.156 Diabetic medication 78 (69.6) 50 (73.5) 0.577 12 (66.7) 88 (77.2) 0.333
Ambulation status prior to event: no. (%) (0) (0)
Ambulate independently 85 (75.9) 63 (92.6) 0.028* 15 (83.3) 106 (93) 0.511 Ambulate with assistance 11 (9.8) 1 (1.5) 1 (5.6) 2 (1.8)
Unable to ambulate 8 (7.1) 3 (4.4) (0) 4 (3.5)
Not documented 8 (7.1) 1 (1.5) (0) 2 (1.8)
Ambulation status on admission: no. (%) (0) (0)
Ambulate independently 16 (14.3) 4 (5.9) 0.107 6 (33.3) 20 (17.5) 0.016* Ambulate with assistance 14 (12.5) 4 (5.9) 0 (0) 23 (20.2)
Unable to ambulate 45 (40.2) 30 (44.1) 9 (50) 30 (26.3)
Not documented 37 (33) 30 (44.1) 3 (16.7) 41 (36)
Ambulation status on discharge: no. (%)
Ambulate independently 39 (34.8) 30 (44.1) 0.223 9 (50) 52 (45.6) 0.328 Ambulate With assistance 29 (25.9) 17 (25) 3 (16.7) 39 (34.2)
Unable to ambulate 29 (25.9) 18 (26.5) 3 (16.7) 15 (13.2)
Not documented 15 (13.4) 3 (4.4) 3 (16.7) 8 (7)
First care received: no. (%)
Emergency department 100 (89.3) 59 (86.8) 0.609 12 (66.7) 26 (22.8) < 0.001*
Direct admission 12 (10.7) 9 (13.2) 6 (33.3) 88 (77.2)
Improved ambulation 63 (56.3) 46 (67.6) 0.129 14 (77.8) 75 (65.8) 0.313 Continuous variables are represented as Mean ± S.D. and comparisons between groups are made with a Student’s T Test. Discrete variables are represented as Count (Percent Frequency) and comparisons between groups were made using Pearson’s Chi Squared
renal insufficiency were all associated with exclusion from thrombolysis therapy in diabetic stroke patients treated in the non-telestroke setting. These factors Table 3 A stepwise regression model to elucidate clinical
factors more associated rtPA inclusion in the total study population of diabetic acute ischemic stroke patients
Positive B values (Adj, OR > 1) denote variables more associated with rtPA inclusion while negative B values (Adj. OR < 1) denote variables more associated with rtPA exclusion. Multicollinearity and interactions among independent variables were checked. Hosmer–Lemeshow test (P = 0.084), Cox & Snell (R2= 0.260), classification table (overall correctly classified percentage = 74.3%) were applied to check the model fitness
*P < 0.05
B value Adj. odds ratio Wald P value
INR − 1.971 0.139 (0.029–0.67) 6.054 0.014* Congestive heart
failure − 1.111 0.329 (0.124–0.878) 4.930 0.026* Direct admission 1.145 3.141 (1–9.867) 3.842 0.050 Telestroke 1.583 4.87 (1.834–12.928) 10.097 0.001* Constant 2.256 9.541 6.418 0.011*
Table 4 A stepwise regression model to elucidate clinical factors more associated rtPA inclusion in the non-telestroke population
Positive B values (Adj, OR > 1) denote variables more associated with rtPA inclusion while negative B values (Adj. OR < 1) denote variables more associated with rtPA exclusion. Multicollinearity and interactions among independent variables were checked. Hosmer–Lemeshow test (P = 0.493), Cox & Snell (R2= 0.224), classification table (overall correctly classified percentage = 70.8%) were applied to check the model fitness
*P < 0.05
B value Adj. odds ratio Wald P value
Higher age − 0.046 0.955 (0.922–0.989) 6.797 0.009* NIH stroke scale 0.066 1.068 (1.009–1.13) 5.190 0.023* Blood glucose level − 0.006 0.994 (0.99–0.999) 6.037 0.014* INR − 2.180 0.113 (0.014–0.944) 4.054 0.044* Renal insufficiency − 1.817 0.163 (0.033–0.791) 5.064 0.024* Constant 6.225 505.460 11.330 0.001*
Table 5 A stepwise regression model to elucidate clinical factors more associated rtPA inclusion in the telestroke population
Positive B values (Adj, OR > 1) denote variables more associated with rtPA inclusion while negative B values (Adj. OR < 1) denote variables more associated with rtPA exclusion. Multicollinearity and interactions among independent variables were checked. Cox & Snell (R2= 0.051), and a classification table (overall correctly classified percentage = 91.0%) were applied to check the model fitness
*P < 0.05
B value Adj. odds ratio Wald P value
INR − 2.758 0.063 (0.003–1.347) 3.130 0.077 Constant 5.155 173.322 8.724 0.003*
in older stroke patients. In the current study, our results indicate that pre-stroke functional status, higher blood glucose level, age older than 80, and
Fig. 1 ROC curve to analyze the predictive power of the logistic regression presented in Table 3. The fig indicates AUROC = 0.774 (0.712–0.836) for clinical factors associated rtPA inclusion or exclusion in the non-telestroke population
have been shown to influence functional outcome in longitudinal studies among elderly stroke patients [20, 37, 38]. Stroke-related mortality is linked to age as a major independent risk factor mainly because elderly acute ischemic patients are more susceptible to complications and have more comorbidities than their younger counterparts [39]. However, advanced age should not be a contraindication for thrombolysis in diabetic stroke patients. Instead, the course of treatment should be decided on a case-by-case basis after a detailed evaluation of existing comorbidities and pre-stroke clinical risks as well as the potential benefits of thrombolytic therapy for each individual old diabetic acute ischemic stroke patient.
A major finding in this study is that our multivariate model predicted a direct association of treatment in the telestroke setting as an independent variable with the highest odds for the inclusion of diabetic stroke patients for thrombolysis therapy. Moreover, following adjustment for baseline demographic and clinical risk factors in the telestroke network, only diabetic stroke patients with higher INR were excluded from thrombolysis, and the effect was not significant. These findings differ from the non-telestroke setting in which diabetic stroke patients with increased age, higher
blood glucose level, higher INR, and renal insufficiency were all pre-clinical risk factors that predicted exclusion from thrombolysis therapy. The finding that in the non-telestroke setting, diabetic stroke patients with complicated pre-clinical risk factors were associated with a higher likelihood of exclusion from thrombolysis therapy, suggests a more stringent exclusion criteria when compared with the telestroke setting. Therefore, it is possible that telestroke technology provides a real-world clinical setting that streamlines in-hospital evaluation with less stringent exclusion criteria, allowing stroke neurologist to consult quickly on whether or not administer thrombolysis therapy. This may enable an increase in the rate of use and efficiency of the timeline for administration of thrombolysis in the treatment of diabetic acute ischemic stroke patients.
There are limitations to our study. First, our study is limited by its retrospective design, although data was col-lected using an established prospective stroke registry, a risk of selection bias is possible. Furthermore, this is uni-center stroke registry and does not allow for the generali-zation of our findings. Moreover, information about the management of diabetes mellitus (type I or type II) was not included in our analysis. The relatively small groups of patients of diabetic stroke patients did not increase the power of our analysis. The strengths of our study are that in the non-telestroke setting, increased age, higher blood glucose level, renal insufficiency were pre-clinical risk factors that predicted the exclusion from thrombol-ysis therapy, while only INR predicted a non-significant exclusion from thrombolysis therapy in the telestroke setting. Our multivariate model was able to identify treatment in the telestroke setting as an independent var-iable with the highest prediction for the inclusion of dia-betic stroke patients for thrombolysis therapy. Finally, we found that in older diabetic stroke patients (> 80 years), exclusion maybe linked with pre-treatment functional status that includes history of higher blood glucose level, higher INR, and renal insufficiency.
Conclusion
Diabetes is not an exclusion criterion for thrombolysis, however, a low rate of thrombolysis therapy has been reported in diabetic acute ischemic stroke patients. More studies are necessary to determine how identified exclu-sion risk factors in the non-telestroke setting can be improved to provide a real-world clinical setting with less stringent exclusion criteria for thrombolysis therapy.
Abbreviations
rtPA: recombinant tissue plasminogen activator; TIA: trans ischemic attack; OR: adjusted odd ratio; GWTG : get with the guideline; AHA: American Heart Association; NIH scores: National Institute of Health scores; AUROC: area under Fig. 3 ROC curve to analyze the predictive power of the logistic
the curve; ROC: receiver operator characteristic; CI: confidence interval; CAD: coronary artery disease; MAP: mean arterial pressure; CHF: congestive heart failure; PVD: peripheral vascular disease; GHS: Greenville Health System.
Authors’ contributions
TIN and JG designed the concept, experimental design, data analysis, while CU and LW critically revised the drafts last version of this manuscript. All authors read and approved the final manuscript.
Acknowledgements
We thank the stroke unit of Greenville Health system for helping in the data collection.
Competing interests
The authors declare that they have no competing interests.
Availability of data and materials
All materials are available for use from the corresponding author.
Consent for publication
Not applicable.
Ethics approval and consent to participate
This study was performed with the approval of the Institutional Review Board of Greenville Health System and the institutional Committee for Ethics. Being a retrospective data analysis with blinded data, no consent was needed.
Funding
This study was funded by the Fullerton Foundation (Grant No. 78029867).
Publisher’s Note
Springer Nature remains neutral with regard to jurisdictional claims in pub-lished maps and institutional affiliations.
Received: 4 February 2019 Accepted: 2 March 2019
References
1. Tun NN, Arunagirinathan G, Munshi SK, Pappachan JM. Diabetes mellitus and stroke: a clinical update. World J Diabetes. 2017;8(6):235–48. 2. Braun KF, Otter W, Sandor SM, Standl E, Schnell O. All-cause in-hospital
mortality and comorbidity in diabetic and non-diabetic patients with stroke. Diabetes Res Clin Pract. 2012;98(1):164–8.
3. MacDougal EL, Herman WH, Wing JJ, Morgenstern LB, Lisabeth LD. Diabetes and ischaemic stroke outcome. Diabet Med. 2018;35(9):1249–57.
4. Mapoure YN, Ba H, Ayeah CM, Kenmegne C, Luma HN, Njamnshi AK. Acute stroke patients with newly diagnosed diabetes mellitus have poorer outcomes than those with previously diagnosed diabetes mellitus. J Stroke Cerebrovasc Dis. 2018;27(9):2327–35.
5. Fuentes B, Martinez-Sanchez P, de Lecinana MA, et al. Diabetes and previous stroke: hazards for intravenous thrombolysis? Eur J Neurol. 2012;19(4):587–93.
6. Mishra NK, Ahmed N, Davalos A, et al. Thrombolysis outcomes in acute ischemic stroke patients with prior stroke and diabetes mellitus. Neurology. 2011;77(21):1866–72.
7. Reeves MJ, Vaidya RS, Fonarow GC, et al. Quality of care and outcomes in patients with diabetes hospitalized with ischemic stroke findings from get with the guidelines–stroke. Stroke. 2010;41(5):E409–17.
8. Kamouchi M, Matsuki T, Hata J, et al. Prestroke glycemic control is associated with the functional outcome in acute ischemic stroke the Fukuoka Stroke Registry. Stroke. 2011;42(10):2788–94.
9. Gray CS, Scott JF, French JM, Alberti K, O’Connell JE. Prevalence and prediction of unrecognised diabetes mellitus and impaired glucose tolerance following acute stroke. Age Ageing. 2004;33(1):71–7. 10. Kwiatkowski T, Libman R, Tilley BC, et al. The impact of imbalances
in baseline stroke severity on outcome in the National Institute of
Neurological Disorders and Stroke recombinant tissue plasminogen activator stroke study. Ann Emerg Med. 2005;45(4):377–84. 11. Generalized efficacy of t-PA for acute stroke. Subgroup analysis of the
NINDS t-PA stroke trial. Stroke. 1997;28(1):209.
12. Fuentes B, Cruz-Herranz A, Martinez-Sanchez P, et al. Acute ischemic stroke patients with diabetes should not be excluded from intravenous thrombolysis. J Thromb Thrombolysis. 2014;38(4):522–7.
13. Al Kasab S, Adams RJ, Debenham E, Jones DJ, Holmstedt CA. Medical University of South Carolina Telestroke: a telemedicine facilitated network for stroke treatment in South Carolina a progress report. Telemed E-Health. 2017;23(8):674–7.
14. Bagot KL, Bladin CF, Vu M, et al. Exploring the benefits of a stroke telemedicine programme: an organisational and societal perspective. J Telemed Telecare. 2016;22(8):489–94.
15. Itrat A, Taqui A, Cerejo R, et al. Telemedicine in prehospital stroke evaluation and thrombolysis taking stroke treatment to the doorstep. JAMA Neurol. 2016;73(2):162–8.
16. Kulcsar M, Gilchrist S, George MG. Improving stroke outcomes in rural areas through telestroke programs: an examination of barriers, facilitators, and state policies. Telemed E-Health. 2014;20(1):3–10.
17. LaMonte MP, Bahouth MN, Xiao Y, Hu P, Baquet CR, Mackenzie CF. Outcomes from a comprehensive stroke telemedicine program. Telemed J E-Health. 2008;14(4):339–44.
18. Gonzalez MA, Hanna N, Rodrigo ME, Satler LF, Waksman R. Reliability of prehospital real-time cellular video phone in assessing the simplified National Institutes of Health Stroke Scale in patients with acute stroke a novel telemedicine technology. Stroke. 2011;42(6):1522–7.
19. Demaerschalk BM, Raman R, Ernstrom K, Meyer BC. Efficacy of telemedicine for stroke: pooled analysis of the Stroke Team Remote Evaluation Using a Digital Observation Camera (STRokE DOC) and STRokE DOC arizona telestroke trials. Telemed E-Health. 2012;18(3):230–7. 20. Nathaniel TI, Gainey J, Blum B, Montgomery C, Ervin L, Madeline L. Clinical
risk factors in thrombolysis therapy: telestroke versus nontelestroke. J Stroke Cerebrovasc Dis. 2018;27(9):2524–33.
21. Nathaniel TI, Cochran T, Chaves J, et al. Co-morbid conditions in use of recombinant tissue plasminogen activator (rt-PA) for the treatment of acute ischaemic stroke. Brain Inj. 2016;30(10):1261–5.
22. Gainey J, Brecthtel J, Blum B, et al. Functional outcome measures of recombinant tissue plasminogen activator-treated stroke patients in the telestroke technology. J Exp Neurosci. 2018;12:1–11.
23. Wapshott T, Blum B, Williams K, Nathaniel TI. Investigation of gender differences and exclusive criteria in a diabetic acute ischemic stroke population treated with recombinant tissue-type plasminogen activator (rtPA). J Vasc Interv Neurol. 2017;9(6):26–32.
24. Barral M, Lassalle L, Dargazanli C, et al. Predictors of favorable outcome after mechanical thrombectomy for anterior circulation acute ischemic stroke in octogenarians. J Neuroradiol. 2018;45(4):211–6.
25. Fazzone B, Morris G, Black LA, et al. Exclusion and inclusion criteria for thrombolytic therapy in an ischemic stroke population.e 4(2): 1112. J Neurol Disord Strok. 2016;4(2):1–5.
26. Cochran T, Chaves J, Fulmer E, et al. Analysis of comorbidities in ischemic stroke patient. Neurology. 2014;82(10):278.
27. Blum B, Wormack L, Holtel M, et al. Gender and thrombolysis therapy in stroke patients with incidence of dyslipidemia. BMC Womens Health. 2019;19:11.
28. Gainey J, Blum B, Bowie B, et al. Stroke and dyslipidemia: clinical risk factors in the telestroke versus non-telestroke. Lipids Health Dis. 2018;17:226.
29. Brecthel L, Gainey J, Penwell A, Nathaniel TI. Predictors of thrombolysis in the telestroke and non telestroke settings for hypertensive acute ischemic stroke patients. BMC Neurol. 2018;18:215.
30. Colello MJ, Ivey LE, Gainey J, et al. Pharmacological thrombolysis for acute ischemic stroke treatment: gender differences in clinical risk factors. Adv Med Sci. 2018;63(1):100–6.
31. Sandercock P, Wardlaw JM, Lindley RI. The benefits and harms of intravenous thrombolysis with recombinant tissue plasminogen activator within 6 h of acute ischemic stroke (the third international stroke trial [IST-3]); a randomised controlled trial Lancet. Lancet. 2012;379:2352–63. 32. Yayan J. Effectiveness of alteplase in the very elderly after acute ischemic
•fast, convenient online submission
•
thorough peer review by experienced researchers in your field
• rapid publication on acceptance
• support for research data, including large and complex data types
•
gold Open Access which fosters wider collaboration and increased citations maximum visibility for your research: over 100M website views per year
•
At BMC, research is always in progress.
Learn more biomedcentral.com/submissions
Ready to submit your research? Choose BMC and benefit from: 33. Sagnier S, Galli P, Poli M, et al. The impact of intravenous thrombolysis on
outcome of patients with acute ischemic stroke after 90 years old. BMC Geriatr. 2016;16:156.
34. Fredwall M, Sternberg S, Blackhurst D, Lee A, Leacock R, Nathaniel TI. Gender differences in exclusion criteria for recombinant tissue-type plasminogen activator. J Stroke Cerebrovasc Dis. 2016;25(11):2569–74. 35. Gainey J, Brecthtel L, Blum B, et al. Functional outcome measures of
recombinant tissue plasminogen activator-treated stroke patients in the telestroke technology. J Exp Neurosci. 2018;12:1179069518793412.
36. Lawson TR, Brown IE, Westerkam DL, et al. Tissue plasminogen activator (rt-PA) in acute ischemic stroke: outcomes associated with ambulation. Restor Neurol Neurosci. 2015;33(3):301–8.
37. Demaerschalk BM. Scientific rationale for the inclusion and exclusion criteria for intravenous alteplase in acute ischemic stroke: a statement for healthcare professionals from the American Heart Association/American Stroke Association. Stroke. 2016;47(11):581.
38. Fugate J, Rabinstein A. Absolute and relative contraindications to IV rt-PA for acute ischemic stroke. Neurohospitalist. 2015;5(3):110–21.