R E S E A R C H A R T I C L E
Open Access
New method for the mathematical
derivation of the ventilatory anaerobic
threshold: a retrospective study
Hirotaka Nishijima
1,2,3,4*, Kazuyuki Kominami
2, Kazuo Kondo
3, Masatoshi Akino
1,2and Masayuki Sakurai
4Abstract
Background:Ventilatory anaerobic threshold (VAT) is a useful submaximal measure of exercise tolerance; however, it must be visually determined. We developed a new mathematical method to objectively determine VAT.
Methods:We employed two retrospective population data sets (A/B). Data A (from 128 healthy subjects, patients with cardiovascular risk factors, and cardiac subjects at institution A, who underwent symptom-limited cardiopulmonary exercise testing) were used to develop the method. Data B (from 163 cardiac patients at
institution B, who underwent pre−/post-rehabilitation submaximal exercise testing) were used to apply the
developed method. VAT (by V-slope) was visually determined (vVAT), assuming that the pre-VAT segment is parallel to the respiratory exchange ratio (R) = 1 line.
Results: First, from data A, exponential fitting of ramp V-slope data yielded the equation y = bax, where a is the slope of the exponential function: a smaller value signified a less steep curve, representing less VCO2 against VO2. Next, a tangential line parallel to R= 1 was drawn. The x-axis value of the contact point was the derived VAT, termed the expVAT (VCO2) (calculated as LN (1/[b*LN(a)]/LN(a). This point represents an instantaneous ΔVCO2/ΔVO2of 1.0. Second, in a similar way, the relation of VO2 vs. VE (minute ventilation) was fitted exponentially. The tangent line that crosses zero was drawn and the x-axis value was termed expVAT (VE) (calculated as 1/LN(a). For data A, the correlation coefficients (r) of vVAT versus VAT (CO2), and VAT (VE) were 0.924 and 0.903, respectively (p< 0.001), with no significant difference between mean values with the limits of agreement (1.96*SD of the
pair difference) being ±276 and ± 278 mL/min, respectively. expVAT (VCO2) and expVAT (VE) significantly
correlated with VO2peak (r= 0.971, r= 0.935, p< 0.001). For data B, after cardiac rehabilitation, expVAT (CO2) and exp. (VE) (mL/min) increased from 641 ± 185 to 685 ± 201 and from 696 ± 182 to 727 ± 209, respectively (p< 0.001, p< 0.008), while vVAT increased from 673 ± 191 to 734 ± 226 (p< 0.001). During submaximal testing,
expVAT (VCO2) underestimated VAT, whereas expVAT (VE) did not.
Conclusions: Two new mathematically-derived estimates to determine VAT are promising because they yielded an objective VAT that significantly correlated with VO2peak, and detected training effect as well as visual VAT did.
Keywords: V-slope, Exponential fitting, Cardiac rehabilitation
© The Author(s). 2019Open AccessThis article is distributed under the terms of the Creative Commons Attribution 4.0 International License (http://creativecommons.org/licenses/by/4.0/), which permits unrestricted use, distribution, and reproduction in any medium, provided you give appropriate credit to the original author(s) and the source, provide a link to the Creative Commons license, and indicate if changes were made. The Creative Commons Public Domain Dedication waiver (http://creativecommons.org/publicdomain/zero/1.0/) applies to the data made available in this article, unless otherwise stated.
* Correspondence:[email protected]
1
Cardiology, Sapporo Ryokuai Hospital, 6-30 Kitanao 1-1, Kiyota-ku, Sapporo 004-0861, Japan
2Cardiac Rehabilitation, Sapporo Ryokuai Hospital, 6-30 Kitano 1-1, Kiyota-ku,
Sapporo 004-0861, Japan
Background
Ventilatory anaerobic threshold (VAT) and maximal oxygen uptake (VO2max) are two commonly used
parameters during cardiopulmonary exercise testing (CPX) [1, 2] that provide physiological and metabolic data that are unobtainable with routine clinical exercise testing involving only electrocardiographic and blood pressure measurements and clinical signs and symptoms. VO2max is currently the gold standard for measuring
exercise tolerance; VAT, also an index of exercise tolerance, has a singular characteristic not shared by VO2max. VAT is visually observed online during
exer-cise testing before the symptom-limited maximal point. Furthermore, it closely correlates with VO2max, the gold
standard measure of exercise tolerance. Additionally, the exercise protocol does not require maximal testing. However, as it requires visual determination, it is ultim-ately a subjective measurement. In a scientific investiga-tion employing VAT, the detecinvestiga-tion of VAT must be made in a blinded manner.
Several computerized algorithms to objectively detect VAT have been developed [3]; however, they have not been widely used. Cardiopulmonary exercise systems generally include computer programs to detect VAT, although their validity has never been tested. It has been reported that there is significant variability in VAT deter-mination among varying programs [3].
In this study, we describe a simple, new method to math-ematically derive VAT that does not require computer
programs and its successful application in assessing the ef-fects of cardiac rehabilitation.
Methods
Study design and population
This retrospective study aimed to develop a new method for the objective determination of VAT. It is based on data sets from two institutions: symptom-limited exercise testing data from institution A and pre- and post- cardiac rehabilitation submaximal exercise testing data from institution B. The objective method of deter-mining VAT was developed using data from institution A. The developed method was then applied to the data from institution B. The mean age of the 128 subjects at institution A (population A) was 52 ± 21 years. This population consisted of 67 healthy subjects, 20 pa-tients with cardiovascular risk factors (hypertension, diabetes mellitus, and hyperlipidemia) who were medication, and 41 patients with various cardiovascu-lar diseases (Table 1). The New York Heart Association (NYHA) functional class of the patients was determined as either I or II, although the classification had not been coded. As a rule, those with NYHA class III or higher did not undergo exercise testing at either institution. Al-though not a clinical one, we employed the Weber-Janicki classification of exercise tolerance for cardiac patients [4]. The mean age of the 163 patients undergoing cardiac rehabilitation at institution B (population B) was 63 ± 10 years (Table 1). CPX was performed upon entry to the
Table 1Demographic and clinical characteristics (populations A and B)
Population A healthy (n= 67)
Population A with CV risks (n= 20)
Population A cardiac (n= 41)
Population B cardiac (n= 163)
Age, y 37 ± 20* 59 ± 11 67 ± 9 63 ± 10
Sex (male/female) 48/19 20/0 26/15 141/22
Body weight, kg 62 ± 11* 72 ± 7 59 ± 9 66.1 ± 10.9
Body mass index, kg/m2 22.1 ± 3.0* 25.8 ± 2.8 23.3 ± 3.1 24.7 ± 3.2
Heart disease etiology: ischemic (%) NA NA 76 84
Weber class: A/B/C/D† NA NA
Using VO2peak (n) 7/12/20/2 NA
Using VAT (n) 1/16/18/6 11/40/66/29
Medications (n) NA
ACE or ARB 9 16 91
Diuretic 2 7 51
Beta-blocker 0 17 72
Inotropics 0 0 4
Ca channel blocker 17 7 35
Anti-lipidemic 3 16 85
Anti-diabetic 2 4 42
*p-Value was significant at least at < 0.05 by 1-way analysis of variance
†Weber-Janicki functional classification: Using VO2peak, based on VO2peak; Using VAT, based on the ventilatory anaerobic threshold
cardiac rehabilitation program, and follow-up testing was done after 3–6 months (mean, 4.5 ± 0.9 months). In 52 pa-tients of the total 163, a hospital-based program (requiring outpatient visits) was not feasible and a home exercise program was offered. Exercise was prescribed at the inten-sity of the visually determined VAT (vVAT), lasting about 30 min, primarily using stationary bikes or treadmills. Bodyweight resistance exercise was also offered. A total of about 1 h of exercise consisted of working bouts and rest-ing periods. The home program initially consisted of walk-ing for 10 min at the level of VAT, eventually extendwalk-ing to 30 min/day.
CPX
CPX was performed using a stationary bicycle and a breath-by-breath gas analyzer (AE-300S; Minato Ika-gaku, Tokyo, Japan). The exercise testing protocol was similar at both institutions; work rates varied from 5 to 25 W/min, preceded by a 2-min warm-up stage. As a general rule at institution A, symptom-limited maximal exercise testing was performed; however, for the purpose of this study, only data sets of exercise tests in which it was documented that the subject was unable to continue pedaling at a specified rate were selected. Cardiologists directly supervised tests. No cardiopulmonary exercise data, such as peak heart rate (HR), VO2, or respiratory
exchange rate (R), were reviewed for the inclusion. At institution B, a submaximal exercise protocol was rou-tinely adopted. Physical therapists who were certified by the Japanese Association of Cardiac Rehabilitation ad-ministered exercise tests and in-house cardiologists were always available when needed. Exercise was generally stopped shortly after the test administrator saw online that the VAT had appeared. In the rehabilitation study of institution B, 127 patients underwent pre−/post-exercise testing under the same 10 W/min ramp protocol, with 13 patients under the same ramp protocol (5 or 15 W/ min) and 23 patients under different ramp protocols. In this group (institution B), the last highest value of physiological measurement, such as HR or VO2, was
described as the highest HR or VO2; this was not the
conventional HRpeak or VO2peak under the
symptom-limited exercise testing. For the perceived rate of exer-tion, the Borg scale (/20) was used. Although both scales of dyspnea and leg fatigue were recorded, the higher of the two scales was used for analysis in this study.
All subjects completed a written informed consent to exercise tests.
Visual determination of VAT
The VAT was determined according to the V-slope method [1], because we concur with Wasserman et al. [1] that this graphical method depicts the most basic and direct metabolic energy relation during exercise:
VO2vs. VCO2(VCO2: as a presumed result of the
buff-ered lactic acid produced), from which V-slope VAT is to be detected. This is not affected by factors other than those that produce VCO2, such as individual ventilatory
sensitivity to CO2and the presence of mechanical
limi-tation to ventilation such as chronic obstructive pulmon-ary disease [1], which may alter the relation: VO2vs. VE.
It seems that most researchers employ a method of breakpoint detection with two lines (pre- and post-segments, S1 and S2), as reported by Beaver et al. [5], to determine VAT. We have found that a variation pro-posed by Sue et al. [6] offers easier VAT detection. This method proposes that the pre-VAT segment of the V-slope (S1) is parallel to the respiratory exchange ratio (R) = 1 line, although this is primarily based on empirical observations. Once this parallel line is visually set (S1), the post-VAT segment (S2) is simply seen as breaking off from this parallel line. When more than one such paral-lel lines were observed, the first one was always taken as S1, the end of which is the VAT. The VAT thus deter-mined best agreed with the lactate threshold in the study we previously reported [7]. Ventilatory equivalent and end-tidal gas concentration plots were also utilized, pri-marily for the detection of hyperventilation, which breaks the V-slope leftward and may be interpreted as a VAT point. The details of our VAT detection method have been reported with actual examples in a previous study [8] and in this study Additional file1. The initial part of Additional file 1 also includes explanations of our VAT determination technique using sample graphs. The VAT values that several test administrators recorded at the time of testing were not used in this research analysis. All VAT determinations were performed inde-pendently by one investigator. VAT determinations before and after rehabilitation were performed in a completely blinded manner; the independent controller assigned a random number to each graph. The reliability of VAT determination (population A: symptom-limited) by the investigator whose reading was adopted in this study was ±129 mL/min according to the limits of agreement (LoA), with two cases of failed detection. This compared well with the report of Myers et al. (±207 mL/min). [9]. In the submaximal series, VAT was not detected in 17 cases before rehabilitation and in 8 cases after rehabilitation.
Our detection of VAT according to the ventilatory equiva-lent has been unsatisfactory in the past; the non-detection rate had been higher than that using the V-slope. However, in this investigation, we determined the ventilatory equiva-lent VAT (veqVAT) in population A for the purpose of comparison. The veqVAT was not detected in 10 cases.
Mathematical estimation of objective VAT
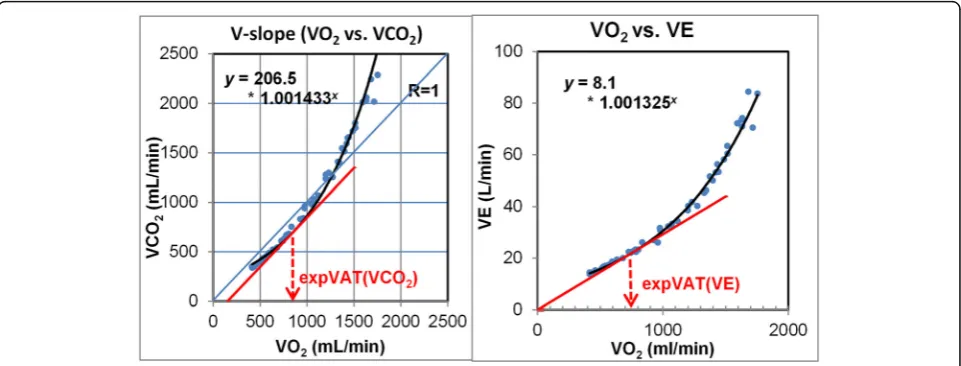
warm-up data). The function was expressed as y = bax. Subsequently, the straight tangent line parallel to R= 1 was drawn by using differential calculus. This was done based on the framework of our visual method of detect-ing VAT, as previously described [8]. The x-axis value of the contact point of the exponential curve and the tangent parallel line is the derived VAT (Fig.1: left), and this was termed expVAT (VCO2). The final expVAT
value was simply calculated according to the following equation: LN (1/[b*LN(a)]) divided by LN(a), where LN is the natural logarithm. All 128 graphs demonstrating exponentially fitted curves for raw data points are included in Additional file 2. The derivation of this equation is detailed in Additional file 3: Supplementary Methods 1. The coefficient of the exponential function
“a” represents the overall steepness of the V-slope, with a smaller value representing a higher VAT. The physio-logical meaning of the slope equaling 1.0 is interesting because at that point on the fitted exponential V-slope, the instantaneousΔVCO2/ΔVO2is 1.0.
In view of the increasing use of oxygen uptake efficiency slope (OUES), which is calculated as a slope of VO2/log-transformed minute ventilation (VE) [10], we
also derived VAT based on the conventional VO2vs. VE
relation. This relation was initially used by Wasserman et al. [1] for detecting VAT, and subsequently replaced by the VO2vs. VCO2relation (V-slope method). A
vari-ation of this method, the ventilatory equivalent method, is still used as an alternative/supplement to the V-slope method; a rise of VE/VO2 from the horizontal line is
taken as a VAT. The horizontal line as a baseline for VE/ VO2 mathematically assumes that on the VO2 vs. VE
graph, a line that crosses the origin is the reference line. Accordingly, after we performed an exponential fitting
of the VO2(x-axis) vs. VE (y-axis) relation, we drew the
tangential line to the exponential curve that crosses the origin (0, 0) of the graph (Fig. 1: right). The x-value of the contact point was termed the expVAT (VE), corre-sponds to the point of the minimum (nadir) value of VE/VO2, which some investigators use as VAT [11]. The final equation for calculation is simply 1/LN(a), the inverse of LN(a); a small value representing a less steep slope yields a larger VAT.
OUES of VE and VCO2
We also calculated the OUES, as our method has a similarity to this method. OUES uses a logarithmic transformation [10]. Our method uses an exponential function, which is the inverse function of the logarithm. OUES is based on the linear relation between log-transformed VE (x-axis) and non-log-transformed VO2
(y-axis), in contrast to the more conventional relation of VO2(x-axis) vs. VE (y-axis). As the V-slope method of
VAT is fitted as an exponential relation of VO2(x-axis)
vs. VCO2 (y-axis) in this study, we plotted the relation of log-transformed VCO2 (x-axis) vs. VO2 (y-axis) for
comparison. Taking the logarithm of VCO2and applying
a linear equation will provide a similar index to the original OUES. To prevent confusion, we called this parameter OUES (VCO2) and the original OUES as
OUES (VE).
Occasionally, the fitting of original data by exponential function was visually poor, with poor linear correlation coefficient (r) between the original and fitted values owing to insufficient number of data or artifacts such as hyperventilation. We excluded these by applying the outlier detection method of Smirnov-Grubbs on the value of r; 4 plots for population A and 7 plots for
Fig. 1(left) Diagram showing the method of determination of expVAT (VCO2), and (right) expVAT (VE). expVAT (VCO2), VAT derived from
exponential fitting of the V-slope (VCO2 vs. VO2). expVAT (VE), VAT derived from exponential fitting of the relation VO2vs. VE (p) (30 y/o healthy
population B were excluded for further analysis. The details are given in Additional file 3: Supplementary Methods 2.
Sensitivity analysis
The first sensitivity analysis aimed to assess whether not exercising to a symptomatic maximum influences the calculated value of derived VAT and OUES; the first 75% of data points of the exercise duration were used and compared with the full data values (Population A). The second sensitivity analysis was performed to assess how far beyond vVAT the exercise had to be extended before the methods of expVAT (VCO2) and expVAT (VE)
be-came effective for detecting pre- and post-rehabilitation changes (Population B). Two analyses were performed: 1) when the range of data was limited only up to the point of vVAT, and 2) when it was extended beyond to the point of vVAT + 100 mL/min VO2 (approximately
the limits of agreement for intra-individual VAT deter-minations). Additionally, as it was mathematically evi-dent that exponential fitting could be performed and expVATs could be calculated even when the V-slope data were limited to the range equal to vVAT or lower (pre-VAT slope), a linear regression analysis was performed for this data segment to detect the data range in which it was unlikely to detect valid expVATs (Population A) .
Additionally, comparisons of vVAT, expVAT (VCO2),
and expVAT (VE) in each subject group in population A (healthy, those with CV risks, cardiac subjects) were per-formed to assess the consistency of these values across groups.
Statistical analysis
Results are given as mean ± standard deviation. The means of the two groups were compared using the Stu-dent’s t-test. Paired data were compared using the paired t-test. Correlations between variables were assessed using Pearson correlation coefficients (r). The compari-son of the three groups was performed using a one-way analysis of variance (ANOVA) followed by post-hoc test (Bonferroni). Correlated groups were assessed using re-peat ANOVA. When assessing the agreement between the two methods, we employed the limits of agreement (LoA) [12], as in cases of repeat determinations of vVAT, and the agreement of vVAT vs. expVAT. When describ-ing LoA in the text, 1.96*SD of the difference of relevant pairs of data was used. Two correlated correlation coeffi-cients (r) were compared using Williams’s procedure [13]. Outlier detection was performed using the Smirnov-Grubbs method (atp= 0.001). When the expo-nentially fitted slopes of the V-slope and the VO2vs. VE
slope were compared, both VCO2 and VE values were
converted to the percentage of each peak value and expressed as a slope (%peak) because the units of VCO2
and VE differed. Residuals were also calculated from the %peak values and expressed as the root mean square deviation (RMSD, analogous to the standard deviation of residuals).
The percentage of age-adjusted maximal HR was calculated as peak HR/(220-age) × 100. Relative VAT (%) was calculated as (VAT/VO2peak) × 100.
Statistical analyses including curve fitting were performed with Statistics for Excel 2015 (Social Survey Research Information Co., Tokyo, Japan).
The research protocol was approved by the institu-tional review boards of Sapporo Ryokuai Hospital and Hokko Memorial Hospital. The corresponding author had full access to all the data in the study and takes responsibility for its integrity and the data analysis.
Results
The demographic and clinical characteristics of the two populations (A and B) are summarized in Table1.
The basic results of CPX and derived values including expVAT (VCO2), expVAT (VE), OUES (VE), and OUES
(VCO2) are summarized in Table 2(maximal) and Table
3 (submaximal, pre/post cardiac rehabilitation). In the maximal exercise study (institution A), expVAT (VCO2)
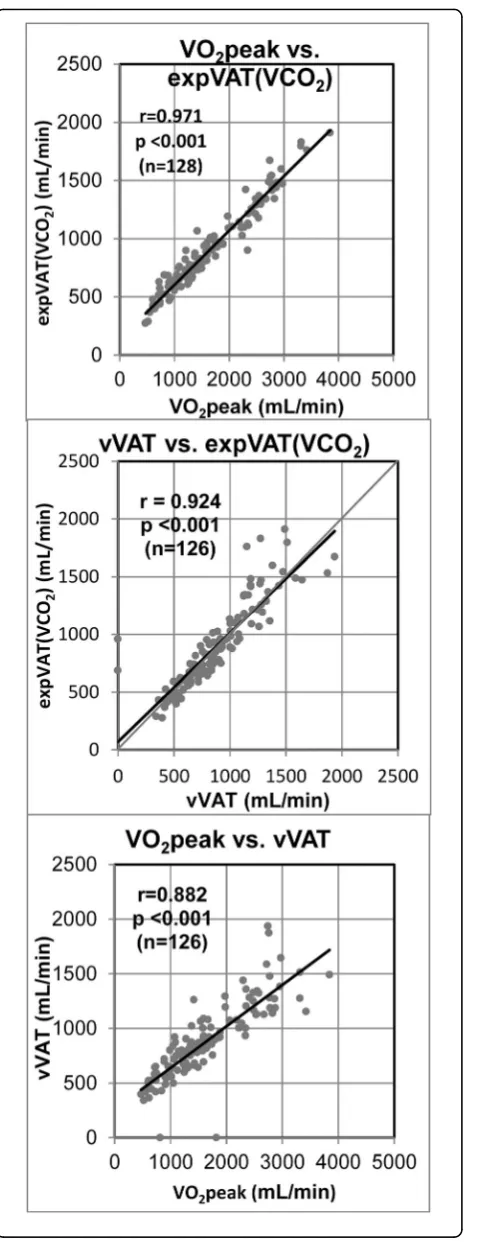
significantly correlated with both VO2peak (r= 0.971, p< 0.001) and vVAT (r= 0.924, p< 0.001) (Fig. 2: top, middle). The correlation (r) between VO2peak and vVAT
was 0.882 (p< 0.001) (Fig.2: bottom). The expVAT (VE) also significantly correlated with both VO2peak (r=
0.932, p< 0.001) and vVAT (r= 0.903, p< 0.001). Inter-estingly, the correlation coefficient between expVAT (VCO2) and VO2peak was significantly better than that
of vVAT vs. expVAT (VCO2) (p< 0.01). The correlation
between expVAT (VE) and VO2peak was also significantly
better than that of expVAT (VE) vs. vVAT (p= 0.041). The LoA between expVAT (VCO2) vs. vVAT, and that of expVAT (VE) vs, vVAT were ± 276 and ± 278 mL/min (Fig.3), respectively, which were considerably higher than the intra-individual reliability of ±129 mL/min of our institution (see Methods: visual determination of VAT). Additionally, the variation in agreement was larger at higher VATs.
The correlations among VO2peak, vVAT, expVAT
(VCO2), expVAT (VE), OUES (VCO2), and OUES (VE)
were all excellent, with r values ranging from 0.882 to 0.998. The correlation matrix among these variables is shown in Table 3. Derived values such as expVAT and OUES tended to have better correlation with vO2peak than vVAT. There were no significant differences in the mean values among vVAT, expVAT (CO2), and expVAT
(VE) (p= 0.712, by repeat ANOVA).
The mean expVAT (VCO2) and VAT (VE) represented
57.3 ± 8.2% and 57.6 ± 11.4% of VO2peak, respectively,
(%relative VAT). Both %relative expVAT (VCO2) and
%relative vVAT significantly decreased as VO2peak
increased, although with a higher VO2peak, %relative
VAT tended to plateau at about 50% (Additional file 3). As the calculation formula shows, the coefficient of the fitted exponential equation “a” (slope) was the primary factor in determining the value of the derived VAT; a smaller value represented a slower exponential slope, which signified a higher VAT. The coefficient a was inversely correlated with expVAT (VCO2) and expVAT
(VE) (r= 0.842 and r= 0.842, p< 0.001 and p< 0.001, respectively).
The mean veqVAT (1049 ± 414 mL/min) was signifi-cantly higher than either vVAT, expVAT (VCO2), or
expVAT (VE) (p< 0.001).
Comparison of the two age−/sex-matched groups (21 healthy vs. 21 cardiac subjects) showed that the mean VO2peak, vVAT, expVAT (VCO2), expVAT (VE), OUES
(VCO2), and OUES (VE) were all significantly different
between the groups (Additional file3: Table S1).
The results of the submaximal exercise protocol for pre- and post-cardiac rehabilitation (institution B) are summarized in Table4.
The vVAT, expVAT (CO2), expVAT (VE), OUES
(CO2), and OUES (VE) each improved significantly after
cardiac rehabilitation, although the mean detected pre/ post difference was largest with vVAT, followed by expVAT (VCO2) and then expVAT (VE). The mean
expVAT (VCO2) was significantly less than the mean vVAT
at both pre- and post-rehabilitation by about 7.2 ± 14.7%
Table 2Cardiopulmonary exercise and derived variables of population A (maximal exercise)
Healthy subjects Patients with CV risk factors Cardiac subjects
Peak work rate, W 170 ± 65* 121 ± 36 71 ± 28
Ramp duration, s 550 ± 139 572 ± 132 494 ± 148
Peak Borg scale 16.7 ± 1.3* 16.8 ± 1.4 15.4 ± 1.6
Peak HR, beats/min 164 ± 23* 134 ± 27 117 ± 19
%Predicted peak HR 90 ± 9.5* 83 ± 13 77 ± 12
VO2peak, mL/min 2031 ± 728* 1581 ± 413 973 ± 323
VO2peak, mL/kg/min 32.2 ± 9.2* 22.0 ± 6.0 16.0 ± 4.0
Peak R 1.18 ± 0.09 1.15 ± 0.09 1.14 ± 0.10
vVAT, mL/min 1042 ± 310* 916 ± 237 629 ± 169
vVAT, mL/min/kg 16.7 ± 4.1* 12.6 ± 3.2 10.4 ± 1.9
expVAT (VCO2), mL/min 1085 ± 353* 874 ± 199 589 ± 168
expVAT (VCO2), mL/min/kg 17.2 ± 4.2* 12.1 ± 2.7 9.7 ± 2.0
Exponential coefficient 1.0012 ± 0.0003* 1.0013 ± 0.0002 1.0020 ± 0.0006
expVAT (VE), mL/min 1053 ± 295* 884 ± 203 634 ± 176
expVAT (VE), mL/min/kg 16.7 ± 3.4* 12.2 ± 2.8 10.4 ± 2.3
Exponential coefficient 1.0010 ± 0.0003* 1.0011 ± 0.0002 1.0017 ± 0.0006
OUES (VCO2), mL/min 2036 ± 599* 1725 ± 345 1197 ± 326
OUES (VE), mL/min 2386 ± 679* 1988 ± 451 1413 ± 404
*p-Value was significant at least at < 0.05 by 1-way analysis of variance.
HRheart rate,VO2oxygen uptake,Rrespiratory exchange rate,vVATvisual ventilatory anaerobic threshold: expVAT (VCO2), exponential VAT based on VO2vs.
VCO2; expVAT (VE), exponential VAT based on VO2vs. VE; OUES (VCO2), oxygen uptake efficiency slope based on logVCO2vs. VO2; OUES (VE), oxygen uptake
efficiency slope based on logVE vs. VO2
Table 3Correlation matrix of exercise tolerance variables (population A)
VO2peak vVAT expVAT
(VCO2)
expVAT (VE)
OUES (VCO2)
OUES (VE)
VO2peak 0.882 0.971 0.932 0.968 0.935
vVAT 0.882 0.924 0.903 0.914 0.897
expVAT (VCO2) 0.971 0.924 0.970 0.987 0.970
expVAT (VE) 0.932 0.903 0.970 0.970 0.998
OUES (VCO2) 0.968 0.914 0.987 0.970 0.971
OUES (VE) 0.935 0.897 0.970 0.998 0.971
(p< 0.001) and 6.8 ± 11.5% (p< 0.001), respectively. The mean expVAT (VE) did not differ significantly from the mean vVAT at both pre- and post-rehabilitation, although the sensitivity to detect changes was less than that of expVAT (VCO2). As seen in Table 3, the coefficients “a” (slope) was not as sensitive as the calculated values of VAT to detect changes (p-values not as good). Additionally, the correlations among vVAT, expVAT (CO2), expVAT (VE),
OUES (VE), and OUES (VCO2) were excellent both at
pre-and post-rehabilitation, with r values ranging from 0.799 to
Fig. 3Bland and Altman plot between vVAT and expVAT. (top) expVAT (VCO2) and (bottom) expVAT (VE).
Fig. 2Relation between (top) VO2peak vs. expVAT (VCO2), (middle)
vVAT vs. expVAT (VCO2), and (bottom) VO2peak vs. vVAT.
0.976 and from 0.873 to 0.994, respectively (Additional file 3: Table S2).
Sensitivity analysis
An assessment of 75% of the data (population A) showed that expVAT (VCO2) significantly decreased by
7.4 ± 7.1% compared with that of the full data (p= 0.001, from 893 ± 359 to 816 ± 301 mL/min), whereas expVAT (VE) did not show a significant change (p= 0.125, from 895 ± 310 to 885 ± 292 mL/min). An assessment of 75% of OUES (VCO2) data significantly decreased by 8.2 ±
5.9% compared with the full data value (p< 0.001, from 1719 ± 615 to 1562 ± 520 mL/min), whereas the 75% of OUES (VE) data decreased by only 2.1 ± 7.9% (from 2019 ± 716 to 1962 ± 670 mL/min,p< 0.01).
When the analyzed range of data was limited to that of vVAT and lower (population B), significant changes were not detected from pre- to post-expVAT (VCO2) or expVAT (VE). When the data range was extended be-yond to vVAT + 100 mL/min VO2, expVAT (VCO2)
reg-istered a significant change (p= 0.013), with VAT (VE) showing a tendency (p= 0.070) from pre- to post-rehabilitation. Additional file 3: Table S3 shows the details).
The linear regression of the pre-VAT slope yielded a mean slope of 0.901 ± 0.102 (mean ± SD). The 95% upper
range is 1.105 (0.901 + 0.204). Therefore, below this level of linear slope, it may be considered that VAT has not been reached with the particular exercise test and expVAT should not be calculated.
Additionally, comparisons of the three modes of VATs (vVAT, expVAT (VCO2), expVAT (VE)) were performed
in each subject group in population A (healthy, those with CV risks, and cardiac subjects). In healthy subjects, a significant difference was observed between the mean vVAT and expVAT (VCO2) (p= 0.038). In cardiac
sub-jects, a significant difference was observed between the mean vVAT and expVAT (VCO2) (p= 0.007) and
be-tween expVAT (VCO2) and expVAT (VE) (p= 0.004).
The absolute mean differences were relatively small, at about 40 mL/min in each case. The main reasons for these discrepancies were primarily the differences in the configuration of the V-slope and the slope for VO2 vs.
VE in each group, affecting the degree of exponential fit-ting. These details are presented in the Additional file3.
Discussion
We developed a new objective method of estimating VAT: expVAT (VCO2) and expVAT (VE). expVAT (of VCO2 and VE) significantly correlated with VO2peak
and vVAT. Furthermore, the developed method detected changes in VAT after cardiac rehabilitation, as well as vVAT did. There have been many attempts to objectively determine VAT using mathematical or computer algo-rithms [14–24]. Seven studies used breakpoint detection with two or more linear functions, three used polyno-mial functions [16, 17], one used a computerized cumu-lative sum method to detect a change in the data trend [23], and only one used an exponential model [15]. Many of these methods as well as others have been inte-grated into computer programs and tested by Ekkekakis et al. [3]. The computed VAT values varied widely from each other, with the correlation coefficients among them ranging from 0.363 to 0.967. Unfortunately, the authors did not compare the computed values with either vVAT or VO2max (or VO2peak).
As far as we could ascertain, only one study used an exponential model [15]. That study used VE/VO2
(venti-latory equivalent of O2), rather than VE itself, on the
y-axis and VO2on the x-axis. The study subjects included
45 active males. The exponential formula was as follows: y =ebx + a/x. Differentiating it yielded the minimum value of y (:VE/VO2), whereas x (:VAT) = 1/b. Theoretically,
the values from that study should be identical to our values. The differences between the previous study and our study are as follows: our method has been applied to the most basic VAT relation: both V-slope (VO2 vs.
VCO2) and the relation VO2vs. VE, without
transform-ation of data. We applied the method in a much larger population (n= 128), including cardiac patients who
Table 4Cardiopulmonary exercise and derived variables of population B (submaximal exercise: before/after cardiac rehabilitation)
Before After p-Value
Body weight, kg 66.1 ± 10.9 66.7 ± 10.9 0.008
Highest work rate, Wa 66 ± 20 82 ± 24 < 0.001
Ramp exercise duration, s 360 ± 107 438 ± 121 < 0.001
Highest Borg scalea, /20 14.1 ± 1.7 14.7 ± 1.9 < 0.001
Highest HRa, beats/min 109 ± 18 116 ± 18 < 0.001
Highest VO2a, mL/min 971 ± 285 1146 ± 341 < 0.001
Highest VO2a, mL/min/kg 14.6 ± 3.4 17.0 ± 4.0 < 0.001
Highest Ra 1.06 ± 0.10 1.09 ± 0.11 < 0.001
vVAT, mL/min 673 ± 191 734 ± 226 < 0.001
vVAT, mL/min/kg 10.1 ± 2.4 10.8 ± 2.8 < 0.001
expVAT (VCO2), mL/min 641 ± 185 685 ± 201 < 0.001
expVAT (VCO2), mL/min/kg 9.6 ± 2.3 10.2 ± 2.4 < 0.001
Exponential coefficient,“a” 1.0018 ± 0.0004 1.0017 ± 0.0004 0.001
expVAT (VE), mL/min 696 ± 182 727 ± 209 0.008
expVAT (VE), mL/min/kg 10.6 ± 2.7 10.9 ± 2.7 0.074
Exponential coefficient,“a” 1.0015 ± 0.0004 1.0014 ± 0.0004 0.011
OUES (VCO2), mL/min 1306 ± 327 1385 ± 355 < 0.001
OUES (VE), mL/min 1513 ± 398 1610 ± 467 < 0.001 a
were young or old and male or female individuals. We also applied the method, with success, to detect changes in exercise tolerance before and after intervention (be-fore and after cardiac rehabilitation).
None of these computer programs seem to have been widely used or available for use to date. One of the main reasons might be the unavailability of those computer programs to clinicians or researchers in general. Most CPX systems seem to include a computer program for detecting VAT; however, the exact algorithm has not been made public. Furthermore, no large-scale study comparing mathematically computed VAT’s with that using the visual method that has been published.
As an objective means to estimate exercise tolerance, the OUES has been increasingly used [10]. The close correlation with VO2peak has been noted. OUES has
also been successfully used to detect exercise tolerance changes after cardiac rehabilitation [25]. At present, OUES generates a new value (VO2/log-transformed VE)
not resembling the commonly-used values such as VO2peak or VAT; however, in the future, this value may
become commonly adopted. Our method is unique be-cause it generates an estimated value of VAT from the exponentially fitted V-slope.
Our method preserves the original relation of VO2vs.
VCO2(V-slope) or VE, as proposed by Wasserman et al.
[1]. We curve-fitted the slope by using the exponential function because the exponential model of lactate in-crease during exercise has been proposed [26] and the increase in buffered acid has been associated with both VCO2and VE increase. The resulting exponential
func-tion yieldsy=bax, where “a” is the slope of the V-slope, analogous to the slope of OUES. This described a char-acteristic of each V-slope and represented a parameter of exercise tolerance; a smaller“a”representing a less steep slope signified a larger value of VAT; less CO2was
pro-duced with increasing VO2. We calculated VAT from the
exponentially fitted V-slope based on our visual method of detecting VAT [8]. As we utilized a parallel line to the
R= 1 line to detect VAT on a V-slope as proposed by Sue et al. [6], we hypothesized in a similar fashion that the parallel tangent line to the exponentially fitted V-slope might yield a close estimate of VAT, if not exactly a deflection point.
The expVAT showed a close correlation with OUES. The two methods detected changes after cardiac re-habilitation equally well; they are mathematically related. The VO2 vs. VE relation is the inverse function of the
VE vs. VO2 relation. The VO2 vs. VE relation is fitted
well with the exponential function, and the relation VE vs. VO2is fitted with the logarithmic function, which is
the inverse function of the exponential function.
As our derivation shows, this is not a method attempt-ing to detect a deflection point of two lines or slopes (S1
and S2). Rather, it represents a certain midway point to-ward VO2peak. The result shows it is more closely
re-lated to VO2peak than to vVAT. The expVAT (VCO2)
point is where the V-slope (exponentially fitted) equals the instantaneous ΔVCO2/ΔVO2 of 1.0 (“instantaneous
R” as contrasted with the conventional R, which is an average R to that point). Therefore, it has an important physiological basis in the framework of exercise energy metabolism: it is not merely a convenient technical point to estimate VAT.
The expVAT (VE) represents the point where the ratio of VE to VO2 (ventilatory equivalent of O2) changes from a decreasing to an increasing pattern. The mean expVAT (VE) agreed with the mean expVAT (VCO2).
This was somewhat against our expectation as the expVAT (VCO2) required the hypothesis of parallel shifting of S1 to R= 1 (rightward shift of V-slope) [8], whereas expVAT (VE) did not. We cannot explain why these two methods nearly agreed. Although VE changes may physiologically follow VCO2changes, the sensitivity
to CO2may vary individually and also according to the
presence of ventilatory limitations, such as in chronic obstructive pulmonary disease [5, 6]. Furthermore, par-ticularly during the lighter phase of incremental exercise, VE is significantly influenced by a reduction in the dead space/tidal volume ratio, as VE does not equal alveolar ventilation. All these factors may differentially influence expVAT (VE).
The LoA of about 270 mL/min is probably too large for expVAT to replace vVAT. In addition, a variation in agreement was larger in subjects with a higher VO2peak,
which appeared to be a stepwise linear pattern of VCO2
increase in these subjects (see Additional file3, section 8 for details). However, the correlation coefficient (r) be-tween expVAT and vVAT was excellent and the group distinction between normal and cardiac subjects could be made. expVAT detected changes in exercise tolerance after cardiac rehabilitation as well as vVAT. Therefore, it seems that expVAT may be used as an objective index of exercise tolerance when group means are compared, or when post intervention changes are evaluated.
vVAT on the V-slope is an important variable to watch during CPX because it provides visualization of a meta-bolic breakpoint online during an exercise test, albeit a subjective one. For personnel administering an exercise test, it is easy to see online whether the exercising sub-ject has passed a metabolic breakpoint (exactly at what point may not be practically important). It is much eas-ier to see that the subject has passed a breakpoint than to pinpoint the exact breakpoint.
Study limitations
VAT or training effects for this population. Our data also do not include those of cardiac patients with NYHA III; therefore, we do not know whether our method can be applied to patients with severe functional disability. Retrospective data of cardiac rehabilitation were utilized to examine whether changes in expVAT would parallel changes in vVAT, which were determined in a blinded fashion. The study was not purported to assess the un-biased effects of cardiac rehabilitation that we practice at our hospital; the study was not a randomized controlled trial. The effects were assessed with only submaximal testing and VAT. Maximal exercise studies are needed to confirm whether expVAT also parallels changes in VO2peak during cardiac rehabilitation.
The expVAT (VCO2) and OUES (VCO2) calculated
using 75% of the data exhibited a mean 7–8% decrease compared with those calculated using the full data. However, in the submaximal exercise study before and after rehabilitation, expVAT (VCO2) performed as well
as vVAT did. Therefore, in comparing pre− /post-inter-vention changes, the lack of a symptomatic maximum may not be too important, as far as exercise protocols are approximately similar in the sense that the exercise passed beyond a visually identifiable VAT point, but not necessarily reaching symptomatic maximum. This issue requires further studies. On the other hand, VE-derived measures, such as expVAT (VE) and OUES (VE), showed only a small or insignificant decrease when 75% of the data were used. In addition, expVAT (VCO2)
indi-cates an exponential fitting problem, particularly in sub-jects with a higher exercise tolerance. This may signify that these VE-derived measures are superior to those de-rived from VCO2. However, as stated earlier, the VO2vs.
VCO2relation and the VO2vs. VE relation do not
repre-sent physiologically identical relations; it is entirely pos-sible that the overall agreement between expVAT (VCO2) and expVAT (VE) is somewhat coincidental.
This aspect may need to be studied in broader range of populations.
Finally, even if we constructed a perfect computer pro-gram that exactly locates a VAT point on the basis of a threshold model, it would still be a subjective one as long as there is variation in the individually determined threshold (vVAT). Only the consistency of individual VAT determinations would improve, whereas a systemic difference would remain. Therefore, it would not be an unbiased universal value. Indexes such as expVAT and OUES are largely determined in the context of the whole curve of VCO2or VE vs. VO2and the slope
characteris-tics of the whole curve appear to determine exercise tol-erance. In that sense expVAT and OUES will not be influenced by individual differences in the threshold visually. Despite not being free from personal bias, vVAT is a useful clinical tool because we believe people usually
agree on whether a certain point on the curve (wherever it exactly is) is past a threshold. In addition, it is indis-pensable as an on-line metabolic monitor during exer-cise testing because vVAT may be determined quite independently of the whole curve.
Conclusions
In summary, we have developed a new objective math-ematical method to estimate VAT that does not require a computer software program. The estimated VAT showed a high correlation with vVAT and VO2peak
dur-ing maximal exercise. It also detected changes after car-diac rehabilitation as well as vVAT did.
Additional files
Additional file 1:Determination of vVAT in all 128 cases. (PPTX 2642 kb)
Additional file 2:Exponential fitting of all 128 cases. (PPTX 2984 kb)
Additional file 3:Supplementary Methods-1. Derivation of computation formula of expVAT.Supplementary Methods-2.Detection of outliers on exponential fitting.Supplementary figure.Description of data: Relation of VO2peak vs. %relative expVAT.Table S1.Age− /sex-matched comparisons of CPX variables.Table S2.Correlation matrix of CPX variables in Population B.Table S3.Sensitivity analysis.
Supplementary material:Comparison of three modes of VAT in each subject group (Population A). (DOCX 1058 kb)
Abbreviations
ACE:Angiotensin-converting enzyme; ANOVA: Analysis of variance; ARB: Angiotensin II receptor blocker; BMI: Body mass index;
CPX: Cardiopulmonary exercise testing; expVAT (VCO2): Calculated VAT based
on exponential fitting of V-slope (VO2vs. VCO2); expVAT (VE): Calculated VAT
based on exponential fitting of VO2vs. VE relation; HR: Heart rate;
IQR: Interquartile range; NYHA: New York Heart Association classification; OUES: Oxygen uptake efficiency slope; R: Respiratory exchange rate; RQ: Respiratory quotient; RR: Respiration rate; RtShift: Rightward shift of V-slope; S1: Pre-VAT slope of the V-slope or the S1 itself; S2: Post-VAT slope of the V-slope or the S2 itself; SBP: Systolic blood pressure; VAT: Ventilatory anaerobic threshold expressed in ml/min VO2; VCO2: Minute carbon dioxide
production; VE: Minute ventilation; VO2: Minute oxygen uptake;
VO2peak: Peak oxygen uptake; V-slope: Graphical representation of VO2(mL/
min, x-axix) vs. VCO2(mL/min, y-axis); vVAT: Visually determined ventilatory
anaerobic threshold; W: Watt
Acknowledgments
We thank Ms. Namiko Horigome, Sendai Cardiovascular Center, Sendai, Japan, for acting as the controller for the blinded reading of VAT, and Ms. Tomomi Nakayama, Hokko Memorial Hospital, Sapporo, Japan, for data collection. We also thank Sapporo Medical University Library, Sapporo, Japan, for collecting literature. The authors declare that the results of the study are presented clearly, honestly, and without fabrication, falsification, or inappropriate data manipulation.
Authors’contributions
Conceptualization and methodology: HN, KK1, KK2, MA. MS. Formal analysis: HN, KK1, KK2. Investigation: HN, KK1, KK2. Writing the paper: HN, KK1, KK2. Supervision: HN, MA. MS. All authors critically revised the manuscript. All gave final approval and agreed to be accountable for all aspects of this work ensuring integrity and accuracy.
Availability of data and materials
The datasets generated and analyzed during the current study are available in the Figshare repository, DOI:https://doi.org/10.6084/m9.figshare.7607414
Ethics approval and consent to participate
This research was approved by the institutional review board of two institutions: Hokko Memorial Hospital and Sapporo Ryokuai Hospital. All patients signed written informed consents to undergo exercise testing and cardiac rehabilitation.
Consent for publication Not applicable.
Competing interests
The authors declare that they have no competing interests.
Author details
1Cardiology, Sapporo Ryokuai Hospital, 6-30 Kitanao 1-1, Kiyota-ku, Sapporo
004-0861, Japan.2Cardiac Rehabilitation, Sapporo Ryokuai Hospital, 6-30 Kitano 1-1, Kiyota-ku, Sapporo 004-0861, Japan.3Cardiac Rehabilitation, Hokko Memorial Hospital, 1-6 Kita-27 Higashi-8, Higashiku, Sapporo 065-0027, Japan.4Cardiology, Hokko Memorial Hospital, 1-6 Kita-27 Higashi-8, Higashiku, Sapporo 065-0027, Japan.
Received: 8 February 2019 Accepted: 5 June 2019
References
1. Wasserman K, Hansen JE, Sue DY, Stringer WW, Sietsema KE, Sun XG, et al. Principles of Exercise Testing and Interpretation: Including Pathophysiology and Clinical Application. 5th ed. Philadelphia: Lippincott Williams & Wilkins; 2012. p. 84–6.
2. Matsumura N, Nishijima H, Kojima S, Hashimoto F, Minami M, Yasuda H. Determination of anaerobic threshold for assessment of functional state in patients with chronic heart failure. Circulation. 1983;68(2):360–7. 3. Ekkekakis P, Lind E, Hall EE, Petruzzello SJ. Do regression-based computer
algorithms for determining the ventilatory threshold agree? J Sports Sci. 2008;26:967–76.https://doi.org/10.1080/02640410801910269.
4. Janicki JS, Weber KT, McElroy PA. Use of the cardiopulmonary exercise test to evaluate the patient with chronic heart failure. Eur Heart J. 1988;9:55–8. 5. Beaver WL, Wasserman K, Whipp BJ. A new method for detecting anaerobic
threshold by gas exchange. J Appl Physiol. 1986;60:2020–7. 6. Sue DY, Wasserman K, Moricca RB, Casaburi R. Metabolic acidosis
during exercise in patients with chronic obstructive pulmonary disease. Use of the V-slope method for anaerobic threshold determination. Chest. 1988;94:931–8.
7. Kominami K, Nishijima H, Imahashi K, Katsuragawa T, Murakami M, Yonezawa K, et al. Very early lactate threshold in healthy young men as related to oxygen uptake kinetics. Medicine (Baltimore). 2015;94:e1559.
https://doi.org/10.1097/MD.0000000000001559.
8. Nishijima H, Kondo K, Yonezawa K, Hashimoto H, Sakurai M. Quantification and physiological significance of the rightward shift of the V-slope during incremental cardiopulmonary exercise testing. BMC Sports Sci Med Rehabil. 2017;9:9.https://doi.org/10.1186/s13102-017-0073-1.
9. Myers J, Goldsmith RL, Keteyian SJ, Brawner CA, Brazil DA, Aldred H, et al. The ventilatory anaerobic threshold in heart failure: a multicenter evaluation of reliability. J Card Fail. 2010;16:76–83.https://doi.org/10.1016/j.cardfail.2009. 08.009. Epub 2009 Sep 26.
10. Baba R, Nagashima M, Goto M, et al. Oxygen uptake efficiency slope: a new index of cardiorespiratory functional reserve derived from the relation between oxygen uptake and minute ventilation during incremental exercise. J Am Coll Cardiol. 1996;28:1567–72.
11. Mezzani A, Agostoni P, Cohen-Solal A, Corrà U, Jegier A, Kouidi E, et al. Standards for the use of cardiopulmonary exercise testing for the functional evaluation of cardiac patients: a report from the Exercise Physiology Section of the European Association for Cardiovascular Prevention and
Rehabilitation. Eur J Cardiovasc Prev Rehabil. 2009;16:249–67.
12. Bland JM, Altman DG. Statistical methods for assessing agreement between two methods of clinical measurement. Lancet. 1986;1:307–10.
13. Howell DC. Statistical Methods for Psychology. 6th ed. Belmont, CA: Thomson Wadsworth; 2007. p. 261–2.
14. Fukuba Y, Munaka M, Usui S, Sasahara H. Comparison of objective methods for determining ventilatory threshold. Jpn J Physiol. 1988;38(2):133–44. 15. Hagan RD, Smith MG. Pulmonary ventilation in relation to oxygen uptake
and carbon dioxide production during incremental load work. Int J Sports Med. 1984;5(4):193–7.
16. Santos EL, Giannella-Neto A. Comparison of computerized methods for detecting the ventilatory thresholds. Eur J Appl Physiol. 2004;93(3):315–24. 17. Cheng B, Kuipers H, Snyder AC, Keizer HA, Jeukendrup A, Hesselink M. A
new approach for the determination of ventilatory and lactate thresholds. Int J Sports Med. 1992;13(7):518–22.
18. Schneider DA, Phillips SE, Stoffolano S. The simplified V-slope method of detecting the gas exchange threshold. Med Sci Sports Exerc. 1993;25(10): 1180–4.
19. Zamunér AR, Catai AM, Martins LE, Sakabe D, Da Silva E. Identification and agreement of first turn point by mathematical analysis applied to heart rate, carbon dioxide output and electromyography. Braz J Phys Ther. 2013;17(6): 614–22.
20. Orr GW, Green HJ, Hughson RL, Bennett GW. A computer linear regression model to determine ventilatory anaerobic threshold. J Appl Physiol Respir Environ Exerc Physiol. 1982;52(5):1349–52.
21. Novais LD, Silva E, Simões RP, Sakabe DI, Martins LE, Oliveira L, et al. Anaerobic Threshold by Mathematical Model in Healthy and Post-Myocardial Infarction Men. Int J Sports Med. 2016;37(2):112–8. 22. Dickstein K, Barvik S, Aarsland T, Snapinn S, Millerhagen J. Validation of a
computerized technique for detection of the gas exchange anaerobic threshold in cardiac disease. Am J Cardiol. 1990;66(19):1363–7. 23. Smith DA, O’Donnell TV. The time course during 36 weeks’endurance
training of changes in Vo2 max. and anaerobic t + hreshold as determined with a new computerized method. Clin Sci (Lond). 1984;67(2):229–36. 24. Higa MN, Silva E, Neves VF, Catai AM, Gallo L Jr, Silva de Sá MF, et al.
Comparison of anaerobic threshold determined by visual and mathematical methods in healthy women. Braz J Med Biol Res. 2007;40(4):501–8. 25. Van Laethem C, Van De Veire N, De Backer G, et al. Response of the oxygen
uptake efficiency slope to exercise training in patients with chronic heart failure. Eur J Heart Fail. 2007;9:625–9.
26. Anderson GS, Rhodes EC. A review of blood lactate and ventilatory methods of detecting transition thresholds. Sports Med. 1989;8:43–55.
Publisher’s Note