R E S E A R C H A R T I C L E
Open Access
The longitudinal relationship of changes of
adiposity to changes in pulmonary function and
risk of asthma in a general adult population
Runa V Fenger
1*, Arturo Gonzalez-Quintela
2, Carmen Vidal
2, Lise-Lotte Husemoen
1, Tea Skaaby
1,
Betina H Thuesen
1, Mette Aadahl
1, Flemming Madsen
3and Allan Linneberg
1,4,5Abstract
Background:Adiposity has been linked to both higher risk of asthma and reduced lung function. The effects of adiposity on asthma may depend on both atopic status and gender, while the relationship is less clear with respect to lung function. This study aimed to explore longitudinal weight changes to changes in forced expiratory volume in first second (FEV1) and forced vital capacity (FVC), as well as to incident cases of asthma and wheezing,
according to atopy and gender.
Methods:A general population sample aged 19–72 years was examined with the same methodology five years apart. Longitudinal changes in weight, body mass index, waist circumference, and fat percentage (bio-impedance) were analyzed with respect to changes of FEV1 and FVC (spirometry), and incidence of asthma and wheezing (questionnaire). Gender, atopy (serum specific IgE-positivity to inhalant allergens) and adipose tissue mass prior to adiposity changes were examined as potential effect modifiers.
Results:A total of 2,308 persons participated in both baseline and five-year follow-up examinations. Over the entire span of adiposity changes, adiposity gain was associated with decreasing levels of lung function, whereas adiposity loss was associated with increasing levels of lung function. All associations were dependent on gender (p-interactions < 0.0001). For one standard deviation weight gain or weight loss, FEV1 changed with (+/−) 72 ml (66-78 ml) and FVC with (+/−)103 ml (94-112 ml) in males. In females FEV1 changed with (+/−) 27 ml (22-32 ml) and FVC with (+/−) 36 ml (28-44 ml). There were no changes in the FEV1/FVC-ratio. The effect of adiposity changes increased with the level of adipose tissue mass at the start of the study (baseline), thus, indicating an aggregate effect of the total adipose tissue mass. Atopy did not modify these associations. There were no statistically significant associations between changes in adiposity measures and risk of incident asthma or wheeze.
Conclusions:Over a five-year period, increasing adiposity was associated with decreasing lung function, whereas decreasing adiposity was associated with increasing lung function. This effect was significantly greater in males than in females and increased with pre-existing adiposity, but was independent of atopy.
Keywords:Adiposity, Asthma, Atopy, FENO, Longitudinal, Lung function, Obesity
* Correspondence:[email protected] 1
Research Centre for Prevention and Health, The Capital Region of Denmark, Building 84-85, Nordre Ringvej 57, DK-2600 Glostrup, Denmark
Full list of author information is available at the end of the article
Background
Adiposity has consistently been associated with asthma [1] and has also been associated with impaired lung function, e.g. as assessed by decreased levels of forced expiratory volume in first second (FEV1) and forced vital capacity (FVC) [2-6]. Thus, adiposity may influ-ence the lungs in several ways, e.g. through inflammation leading to asthma-like, obstructive changes, or in terms of a mechanical impact on lung function (restrictive changes).
Adiposity increases the risk of asthma and may cause more severe symptoms along with a reduced response to medications [1,7,8]. Some studies have indicated that these effects are stronger in non-atopic individuals than atopic individuals [9-11], although contrary re-sults also have been noted [12]. Further, adiposity has been reported to be more strongly associated with asthma types characterised by non-eosinophilic inflam-mation rather than by eosinophilic inflaminflam-mation [13]. However, it has not been investigated whether adipos-ity also has differential effects on lung function in atopic and non-atopic individuals or in individuals with or without eosinophilic inflammation in the air-ways. Underlying pathological processes, such as eosino-philic or neutroeosino-philic inflammation [14], could possibly modify the longitudinal relationship of adiposity with lung function.
Mechanically, adiposity may cause an extra load on the thoracic cage [15], increase the intra-abdominal pressure, and impede the movements of the diaphragm [16]. This has in smaller experimental settings been re-ported to decrease static lung volumes and lead to breathing at smaller tidal volumes [17]. Cross-sectional studies have suggested that these changes are stronger in persons with predominantly abdominal adiposity than in persons with predominantly general adiposity [18]. Yet, prospective population based studies are sparse and have assessed adiposity changes mainly by weight or BMI [2,3,19-22], except from one study that included waist and hip circumferences but not FVC [4]. Therefore, studies quantifying longitudinal changes of lung function with respect to different adiposity phenotypes may add further information about the longitudinal relationship between adiposity and lung function.
This prospective general population study aimed to in-vestigate the association of longitudinal changes in weight, body mass index (BMI), waist circumference (WC), and fat percentage with longitudinal changes in FEV1 and FVC, and with concomitant incidence of asthma and wheezing. Further, we examined whether these associ-ations were modified by gender, atopy, or eosinophilic inflammation of the lower airways as reflected by forced expiratory nitric oxide (FENO).
Methods
Study population
The current study used already sampled data from the Health2006 study and the Health2006-follow-up study conducted five years apart. The participants in the base-line Health2006 cohort were drawn as a random sample from the background population aged 18–69 years, living in 11 municipalities in the south-western part of suburban Copenhagen. A total of 3471 individuals (44.7%) entered the study and participated in the health examination, which took place in 2006–08 (Health2006 baseline [23]). In 2011–12, participants in the baseline Health2006 were invited for a 5-year follow-up examination including es-sentially the same study protocol. A total of 3,405 were eligible for invitation (21 had emigrated and 45 died). A total of 2,308 (68.6%) agreed to participate and were re-examined between November 2011 and November 2012. Fourteen participants did not have valid measures of either FEV1 or FVC at either baseline or follow-up and were excluded from the study, which for the main analyses was based on 2,294 participants. All partici-pants gave written informed consent before taking part in the study, which was approved by the ethics com-mittee of the Capital Region of Denmark, Copenhagen (KA20060011).
Questionnaire data
Physical measurements and assessment of lung function and FENO
Anthropometric measures were obtained with participants in light clothing and without shoes. Height was measured to the nearest cm, weight to the nearest 0.1 kg, and body mass index (BMI) was calculated as kg/m2. Waist circum-ference (WC) was measured to the nearest cm using a tape measure midway between the lower rib margin and the iliac crest. Fat percentage was measured using a foot-to-foot Tanita Body Composition Analyzer (TBF-300, TANITA Corporation of America, Inc., Illinois, U.S.A.). Spirometry was performed according to American Thoracic Society and the European Respiratory Society (ATS/ERS) standard [25] using Spiro USB Spirometers (MicroMedical Limited, Rochester, Kent, UK). Spirometers were checked daily with a 3-liter calibrated syringe, and checked every six months with a decompression flow simulator [26]. FENO measurements were performed only at baseline
using a NIOX MINO (Aerocrine AB, Stockholm, Sweden). A dynamic flow restrictor yielded a constant flow rate of 50 mL/s, in accordance with recommendations of the ATS/ERS guidelines for FENO measurement [27]. Nitric
oxide concentrations between 5 and 300 ppb were mea-sured and measurements below 5 ppb were set to zero by the NIOX MINO. Nitric oxide concentrations above 20 ppb were considered high.
Biomarkers
Baseline serum samples were analysed for serum specific IgE against the four most clinically important inhalant allergens in Denmark: birch, grass, cat, and the house dust mite Dermatophagoides pteronyssinus, using the ADVIA Centaur Specific IgE assay [28]. Atopy was de-fined as at least one positive test (≥0.35 kilo units/L) against specific IgE. Plasma glucose concentrations were analysed by a hexokinase/glucose-6-phosphate dehydro-genase assay (Roche Diagnostic, Germany), and insulin concentrations were measured by fluoroimmunoassay technique (Dako Diagnostics Ltd., UK). The homeostatic model assessment-insulin resistance (HOMA-IR) index was calculated as: fasting plasma glucose (mmol/L) x fast-ing serum insulin (mU/L)/22.5 and applied only to the non-diabetic individuals. High-density lipoprotein (HDL) and triglyceride concentrations were measured by stand-ard enzymatic techniques (Roche Diagnostic, Germany).
Statistics
We used the R-statistical package, version 3.0.2 (http:// www.r-project.org/) for all analyses. All p-values are two-tailed and statistical significance defined as p <0.05. P-values of likelihood ratio tests were used to test for significance of all multivariate analyses. We used linear re-gression and checked for equal residual variance across the full range of all exposure variables to check the linear
model assumptions. We also tested possible non-linear as-sociations by dividing the exposure variables in splines and by testing the quadratic term of the variables in the regression models. For our main analyses, we used abso-lute or percentage changes (between baseline and five-year follow up) of the adiposity measures to changes in FEV1 and FVC. The changes of FEV1 (or FVC) were modelled as five-year FEV1 (or FVC) adjusted for FEV1 (or FVC) at baseline. We also tested the ‘reverse’ associ-ation of baseline lung function measures to changes of adiposity measures. The adiposity measures were standar-dised by division of each measure by its own standard error to ease interpretation of the regression coefficients and to ease a comparison of the magnitude of effects be-tween the different adiposity measures. In analyses of inci-dence of asthma and wheezing, logistic regression was used, similar model checks were applied, and the adiposity measures were categorised in four equally sized groups by quartiles of their respective distributions. Possible interac-tions were tested by adding an interaction term to the regression models, e.g. (adiposity measure*atopy) or (adiposity measure*gender). Finally, all analyses were repeated with s-Trig, s-HDL, and HOMA-IR included in the models to test whether these metabolic markers would attenuate the estimates found for adiposity. Sensitivity analyses included exclusion of the lower and upper 0.0025, 0.005, 0.01 fractiles of the adiposity measures, as well as sep-arate analyses in non- and never smokers, and in younger or older (age categories were +/−40, +/−45, +/−50 years) individuals.
Finally, we made a simulation-model based on randomly generated heights, BMI-levels, and levels of lung volume dependent on height. This model gives an example of how adipose tissue above a certain ‘person-dependent ideal’ would influence lung function (Additional file 1).
Results
The baseline characteristics of the study population are given in Table 1. All characteristics are listed separately for participants and non-participants in the follow-up study. Of note is that non-participants as compared to participants had significantly higher levels of adiposity measures and higher levels of FEV1 and FVC. However, the baseline associations of adipose tissue levels with asthma, wheezing, FEV1 or FVC were not significantly different between participants and non-participants, all p-values for interaction between participation and each adiposity measure were between 0.12 and 0.98. Sensitivity analyses did not change the pattern of results presented.
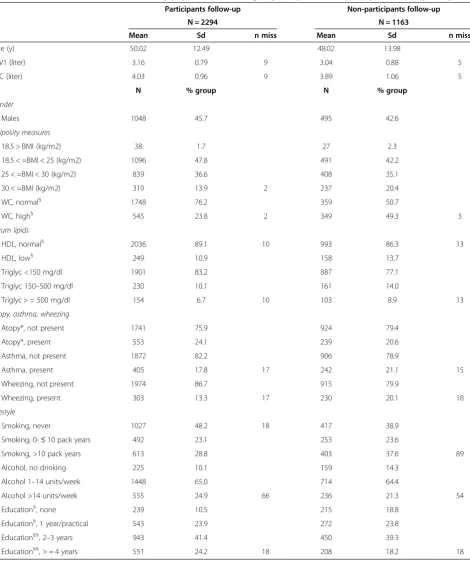
similar extend (Figure 1 and Table 2). This pattern was observed in both males and females but the strength of these associations differed significantly between the two
genders (Table 2): For all four adiposity measures, the estimated effect of adiposity changes on changes in FEV1 and FVC were approximately three times higher
Table 1 Baseline characteristics of the study population according to participation in the five-year follow-up study
Participants follow-up Non-participants follow-up
N = 2294 N = 1163
Mean Sd n miss Mean Sd n miss
Age (y) 50.02 12.49 48.02 13.98
FEV1 (liter) 3.16 0.79 9 3.04 0.88 5
FVC (liter) 4.03 0.96 9 3.89 1.06 5
N % group N % group
Gender
Males 1048 45.7 495 42.6
Adiposity measures
18.5 > BMI (kg/m2) 38 1.7 27 2.3
18.5 < =BMI < 25 (kg/m2) 1096 47.8 491 42.2
25 < =BMI < 30 (kg/m2) 839 36.6 408 35.1
30 < =BMI (kg/m2) 319 13.9 2 237 20.4
WC, normal§ 1748 76.2 359 50.7
WC, high§ 545 23.8 2 349 49.3 3
Serum lipids
HDL, normal§ 2036 89.1 10 993 86.3 13
HDL, low§ 249 10.9 158 13.7
Triglyc <150 mg/dl 1901 83.2 887 77.1
Triglyc 150–500 mg/dl 230 10.1 161 14.0
Triglyc > = 500 mg/dl 154 6.7 10 103 8.9 13
Atopy, asthma, wheezing
Atopy*, not present 1741 75.9 924 79.4
Atopy*, present 553 24.1 239 20.6
Asthma, not present 1872 82.2 906 78.9
Asthma, present 405 17.8 17 242 21.1 15
Wheezing, not present 1974 86.7 915 79.9
Wheezing, present 303 13.3 17 230 20.1 18
Lifestyle
Smoking, never 1027 48.2 18 417 38.9
Smoking, 0-≤10 pack years 492 23.1 253 23.6
Smoking, >10 pack years 613 28.8 403 37.6 89
Alcohol, no drinking 225 10.1 159 14.3
Alcohol 1–14 units/week 1448 65.0 714 64.4
Alcohol >14 units/week 555 24.9 66 236 21.3 54
Education§, none 239 10.5 215 18.8
Education§, 1 year/practical 543 23.9 272 23.8
Education§§, 2–3 years 943 41.4 450 39.3
Education§§, > = 4 years 551 24.2 18 208 18.2 18
FEV1, forced expiratory volumes first second; FVC, forced vital capacity; BMI, body mass index; WC, waist circumference; Diabetes*, either self-reported diabetes or fasting p-glucose > =7.1 mmol/L; HDL, serum level of high-density lipoprotein; Triglyc, serum level of triglyceride; *Atopy defined as serum specific IgE positivity (> = .35 kU/l) to inhalant allergens;§
above primary school,§§
in males than in females in absolute numbers. The percentage changes were the double in males as com-pared to females. For instance, for every one standard deviation of weight change (5.4 kg) from baseline to follow-up, FEV1 either increased or decreased with approxi-mately 72 ml (66-78 ml) in males and 26 ml (21-31 ml) in females, similarly FVC either increased or decreased with 111 ml (101-121 ml) in males and 35 ml (27-43 ml) in fe-males. The metabolic markers, s-triglyceride, s-HDL, or HOMA-IR did not attenuate the effects of adiposity mea-sures on changes in FEV1 and FVC (data not shown). Estimated mean declines for one year of increasing age were approximately 32.8 (31.3-34.4) ml FEV1 and 21.4 (19.0-23.9) ml FVC. In never-smokers, the correspon-ding estimates were 31.0 (28.7-33.3) ml FEV1and 21.0 (17.4-24.6) ml FVC. All age-estimates were essentially similar in males and females but were significantly smaller in younger than in older individuals.
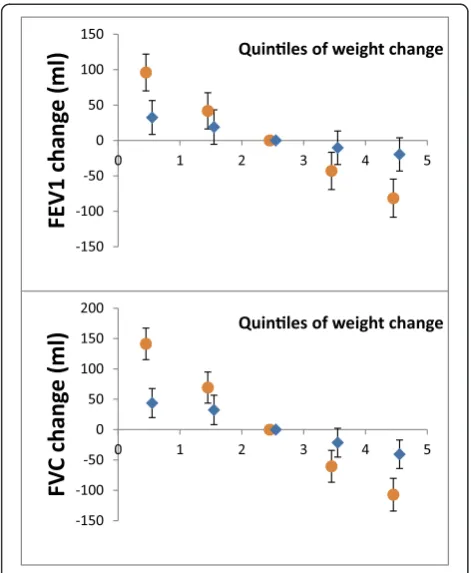
The five-year adiposity changes had a differential impact on lung function changes according to baseline adiposity levels, as assessed as baseline BMI (Figure 2). Five-year adiposity changes were associated with dose-dependent
greater declines of FEV1 and FVC in participants who were overweight and obese at baseline as compared to participants who were lean at baseline (Figure 2). Again, this effect was significantly different in males and fe-males but the interaction of baseline-BMI*five-year changes of adiposity was only significant with respect to FVC (p = 0.02). Essentially similar results can be ob-tained by running our simulation example (Additional file 1). There were not any associations between changes of adiposity with changes of the FEV1/FVC-ratio between baseline and follow-up. For one standard deviation change of any adiposity measure, the FEV1/FVC-ratio changed between −0.0023 (fat percentage) to 0.00097 (BMI) in males (p-values 0.14-0.83) and this was not different in females (p for interactions 0.66-0.99).
To further investigate the temporal relationship of asso-ciations between changes in adiposity and lung function, we performed‘reverse’analyses where baseline FEV1 and FVC were used as explanatory variables for subsequent adiposity changes. However, there were no such statisti-cally significant associations. Thus, these results support that changes in adiposity have an influence on lung func-tion, but lung function does not have a similar influence on changes in adiposity.
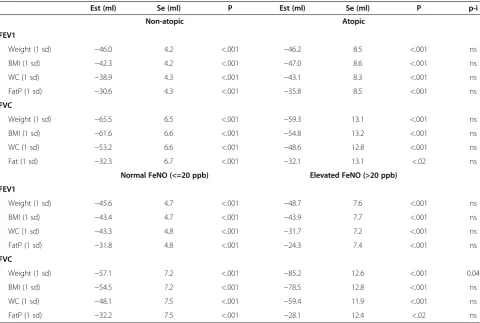
The inverse association of adiposity with lung func-tion was confirmed in both persons with and without asthma at baseline (Table 3). The gender differences in lung function declines from baseline to follow-up were also independent of asthma status at baseline (Table 3). With respect to atopy and FENO -levels, there were
es-sentially no differences in the associations of adiposity changes to changes of FEV1 and FVC between atopic and non-atopic individuals or between persons with or without elevated FENO-levels (Table 4). Analyses in
never- and non-smokers gave similar results (data not shown).
Finally, we investigated whether baseline levels of adi-posity measures or changes of adiadi-posity levels from base-line to follow-up were associated with incident asthma and wheezing. The incidence of asthma and wheezing be-tween baseline and follow-up was 7.0% (158/2265) and 5.9% (133/2263), respectively. There were no statistically significant associations of any adiposity measure (baseline or changes) with incident asthma but for changes of weight and BMI there was a positive association with wheezing (Table 5). Notably, the novel cases of asthma in our cohort could be categorised as‘late-onset’asthma because all participants were > =19 years at baseline. Restricting our analysis further to novel cases of asthma and wheezing in participants e.g. above > = 25 years or > = 40 years yielded similar results. There were no differences between atopic and non-atopic individuals or individuals with or without elevated FENO-levels with respect to incident
asthma or wheezing (data not shown).
Discussion
We quantified the longitudinal relationship of several adiposity measures, including waist circumference and fat percentage, with lung function reflected by FEV1 and FVC. Thus, we confirmed changes of FEV1 and FVC per one kilo weight increase as summarised in Additional file 2 and extended that knowledge by reporting longitu-dinal estimates for abdominal adiposity (waist circumfer-ence) and fat percentage. We found that an increase in adiposity over five years was associated with declines in FEV1 and FVC, whereas a decrease in adiposity was as-sociated with increases of FEV1 and FVC. These associa-tions were more pronounced in males than in females but were independent of atopy and FENO -levels.
Adi-posity changes were not associated with changes in the FEV1/FVC-ratio and were not associated with incident asthma.
Adipose tissue and especially upper body fat have in cross-sectional studies been shown to be associated with decreased static lung volumes as assessed by functional
Table 2 Five-year changes of FEV (ml) and FVC (ml) in males and females per one standard deviation (1 sd) increase of adiposity measure
Males Females
Est (ml) Se (ml) P Est (ml) Se (ml) p p-i
FEV1
Weight (1 sd) −72.6 5.8 <.001 −27.3 4.9 <.0001 <.001
BMI (1 sd) −78.5 6.5 <.001 −25.5 4.6 <.0001 <.001
WC (1 sd) −66.4 6.1 <.001 −23.4 4.8 <.0001 <.001
FatP (1 sd) −52.0 6.2 <.001 −19.2 4.9 <.0001 <.001
FVC
Weight (1 sd) −103.2 9.0 <.001 −36.2 7.6 <.0001 <.001
BMI (1 sd) −113.6 10.0 <.001 −32.6 7.1 <.0001 <.001
WC (1 sd) −90.7 9.4 <.001 −28.1 7.4 <.0001 <.001
FatP (1 sd) −54.3 9.7 <.001 −18.0 7.6 0.01 0.002
Linear regression models fitted with interaction between the specific adiposity measure and gender. Adjusted for age, atopy, tobacco use (pack years). Est, beta-estimate; Se, standard error for Est; p, p-value; p-i, p-value for difference (interaction) between males and females; BMI, body mass index; WC, waist circumference; FatP, fat percentage.
Figure 2Changes of lung function according to weight changes and baseline adiposity.Five-year changes of FEV1 (upper panel) and FVC (lower panel) per one standard deviation increase of weight between baseline and follow-up according to baseline levels of BMI (X-axis) in males (circles) and females (diamonds), adjusted for age, atopy, tobacco use (pack years), and atopy.
Table 3 Five-year changes of FEV1 (ml) and FVC (ml) in males and females per one standard deviation increase of BMI from baseline to follow-up, according to asthma status at baseline
Males Females
Est Se p Est Se p
FEV1 Asthma −96.4 16.7 <.001 −10.7 10.8 0.32 Non-asthma −75.6 7.0 <.001 −29.1 5.2 <.001
FVC Asthma −109.7 24.4 <.001 −15.0 15.8 0.34 Non-asthma −115.0 11.0 <.001 −37.3 8.1 <.001
residual capacity and expiratory reserve volume [16,17,29]. As expiratory flow velocity is dependent on the degree of previous lung inflation due to the elastic properties of the lung [30], lower static lung volumes would subsequently impact on expiratory flows. Our results support such mechanical changes in a longitudinal setting. Firstly, the longitudinal adiposity changes were inversely associated with expiratory flow as reflected by FEV1. Secondly, pre-existing adiposity (at baseline) enhanced the negative im-pact of adiposity gain (Figure 2). Thus, the cumulative mass of adipose tissue was associated with reduced lung function as assessed by FEV1 and FVC. Adding that the FEV1/FVC-ratio remained unchanged, there was not a measurable increasing obstructive pattern with increasing adiposity. In comparison, inflammatory mechanisms would be expected to induce asthma-like, obstructive alterations in lung function [31].
The gender differences in the adiposity-lung function associations in this study were substantial, and may emphasise the mechanical aspects as males have more abdominal fat for the same degree of adiposity than
females [32]. Similar conclusions have been put for-ward by authors in other studies [4,33,34] but supple-mentary explanations may exist. At least in asthma patients, recent cluster analyses have shown that a sub-group of non-adipose males have a high yearly loss of FEV1 that is not explained by presence or absence of atopy, the duration of disease etc. [35,36]. This could indicate that another pathological mechanism towards declines of lung volumes occurs in those males, and this could also apply to males without asthma. Differ-ences in sex hormonal levels, which are emphasised by decreasing gender differences in lung volume decline in elderly [3] is a possible explanation for an apparently different airway pathology in males and females. Other possibilities are different thresholds for the detrimental effects of pulmonary irritants, or differences in airway calibre between males and females [37], although none have been fully documented so far.
Atopy or FENO-levels did not modify the effects of
adiposity on lung function. Thus, an underlying atopic as compared to non-atopic condition or an underlying
Table 4 Five-year changes of FEV (ml) and FVC (ml) in non-atopic and atopic individuals (upper panel), and in individuals with or without elevated FeNO-levels (lower panel), per one standard deviation increase of adiposity measures
Est (ml) Se (ml) P Est (ml) Se (ml) P p-i
Non-atopic Atopic
FEV1
Weight (1 sd) −46.0 4.2 <.001 −46.2 8.5 <.001 ns
BMI (1 sd) −42.3 4.2 <.001 −47.0 8.6 <.001 ns
WC (1 sd) −38.9 4.3 <.001 −43.1 8.3 <.001 ns
FatP (1 sd) −30.6 4.3 <.001 −35.8 8.5 <.001 ns
FVC
Weight (1 sd) −65.5 6.5 <.001 −59.3 13.1 <.001 ns
BMI (1 sd) −61.6 6.6 <.001 −54.8 13.2 <.001 ns
WC (1 sd) −53.2 6.6 <.001 −48.6 12.8 <.001 ns
Fat (1 sd) −32.3 6.7 <.001 −32.1 13.1 <.02 ns
Normal FeNO (<=20 ppb) Elevated FeNO (>20 ppb) FEV1
Weight (1 sd) −45.6 4.7 <.001 −48.7 7.6 <.001 ns
BMI (1 sd) −43.4 4.7 <.001 −43.9 7.7 <.001 ns
WC (1 sd) −43.3 4.8 <.001 −31.7 7.2 <.001 ns
FatP (1 sd) −31.8 4.8 <.001 −24.3 7.4 <.001 ns
FVC
Weight (1 sd) −57.1 7.2 <.001 −85.2 12.6 <.001 0.04
BMI (1 sd) −54.5 7.2 <.001 −78.5 12.8 <.001 ns
WC (1 sd) −48.1 7.5 <.001 −59.4 11.9 <.001 ns
FatP (1 sd) −32.2 7.5 <.001 −28.1 12.4 <.02 ns
eosinophilic as compared to non-eosinophilic airway in-flammation did not appear to enhance the inverse asso-ciation of adiposity with lung function in our general population. It is possible that a characterisation of par-ticipants by e.g. eosinophils in sputum or blood would have yielded other results, as elevated FENO-levels only are indicative of eosinophil airway inflammation [38]. For instance, cluster analyses have indicated that some groups of asthma patients are characterised by eosino-phil airway inflammation and low lung function [39]. Further, faster declines of lung volumes in non-atopic as compared to atopic asthma patients have also been re-ported [36,40,41]. However, our study was conducted in a general population and not in specific groups of pa-tients. Thus, absence of effect modification by atopy or FENO-levels in our study appears to emphasise
restrict-ive changes of lung function with increasing adiposity. However, our study was not powered to investigate ef-fect modifications. Therefore, more studies are needed to confirm or refute the presence of effect modification by atopy or elevated FENO-levels.
We did not find an association between increasing adi-posity and asthma incidence but for increasing weight and BMI there was a positive association with incident
wheezing. This is in contrast with findings of most lon-gitudinal studies, which have reported a positive associ-ation between increasing BMI and incidence of asthma [1]. However, the power to detect such differences in the present study was relatively low as indicated by relatively wide 95% confidence intervals. Possibly, testing the asso-ciation of adiposity with bronchial hyperreactivity (BHR) would have yielded other results; in a previous study we found a positive association of adiposity with BHR [42], but such information was not available in the current study.
The strengths of the study include the prospective de-sign, validated and similar methods for measurements of FEV1 and FVC at baseline and follow-up, assessment of atopy by serum specific IgE and airway eosinophil in-flammation by FENO. The limitations include the lack of
tests for variability of lung function to define asthma, lack of measures of lung volumes, and that the analyses are based on the assumption that increases or decreases of weight and BMI were due to adipose tissue and not muscle mass. Selection bias may have decreased the gen-eralisability of the study and loss to follow-up influenced the reported associations. However, we found similar baseline associations of adipose tissue measures with all
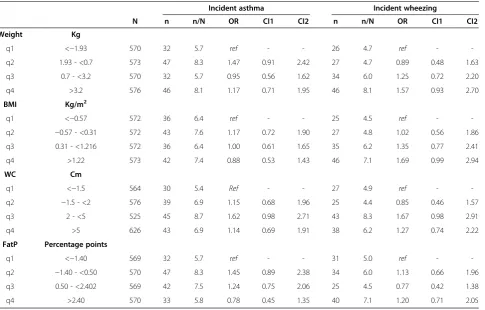
Table 5 The association of changes of adiposity measures (quartiles) between baseline and five-year follow-up with risk of novel (incident) asthma and wheezing
Incident asthma Incident wheezing
N n n/N OR CI1 CI2 n n/N OR CI1 CI2
Weight Kg
q1 <−1.93 570 32 5.7 ref - - 26 4.7 ref -
-q2 1.93 - <0.7 573 47 8.3 1.47 0.91 2.42 27 4.7 0.89 0.48 1.63
q3 0.7 - <3.2 570 32 5.7 0.95 0.56 1.62 34 6.0 1.25 0.72 2.20
q4 >3.2 576 46 8.1 1.17 0.71 1.95 46 8.1 1.57 0.93 2.70
BMI Kg/m2
q1 <−0.57 572 36 6.4 ref - - 25 4.5 ref -
-q2 −0.57 - <0.31 572 43 7.6 1.17 0.72 1.90 27 4.8 1.02 0.56 1.86
q3 0.31 - <1.216 572 36 6.4 1.00 0.61 1.65 35 6.2 1.35 0.77 2.41
q4 >1.22 573 42 7.4 0.88 0.53 1.43 46 7.1 1.69 0.99 2.94
WC Cm
q1 <−1.5 564 30 5.4 Ref - - 27 4.9 ref -
-q2 −1.5 - <2 576 39 6.9 1.15 0.68 1.96 25 4.4 0.85 0.46 1.57
q3 2 - <5 525 45 8.7 1.62 0.98 2.71 43 8.3 1.67 0.98 2.91
q4 >5 626 43 6.9 1.14 0.69 1.91 38 6.2 1.27 0.74 2.22
FatP Percentage points
q1 <−1.40 569 32 5.7 ref - - 31 5.0 ref -
-q2 −1.40 - <0.50 570 47 8.3 1.45 0.89 2.38 34 6.0 1.13 0.66 1.96
q3 0.50 - <2.402 569 42 7.5 1.24 0.75 2.06 25 4.5 0.77 0.42 1.38
q4 >2.40 570 33 5.8 0.78 0.45 1.35 40 7.1 1.20 0.71 2.05
outcomes in participants and non-participants in the follow-up indicating that our results may apply to a general population.
Conclusion
In conclusion, changes of adiposity had a high, gender specific impact on FEV1 and FVC but not on the FEV1/ FVC-ratio. Increasing adiposity was associated with lung function decline, whereas loss of adiposity was associ-ated with increasing lung function. These associations were independent of atopy, FENO -levels, and metabolic
markers, but were modified by the level of adipose tissue prior to the adiposity changes indicating the importance of aggregate adipose tissue mass. The adiposity changes leading to declines of FEV1 and FVC were not concomi-tantly associated with incidence of asthma or wheezing, however, a low number of novel cases of asthma and wheezing may have limited the power to detect associa-tions with these outcomes.
Additional files
Additional file 1:Simulation model of lung function depending on BMI.
Additional file 2:Overview of longitudinal studies of the association between increasing adiposity and decreasing lung function conducted in general adult populations.
Competing interests
The authors declare that they have no competing interests.
Authors’contributions
RVF and TS carried out the analyses and drafted the paper. AGQ, CV, LLH, and AL designed the study and helped to draft the manuscript. FM collected the spirometry data and participated in the design of the study. BHT and MA helped to draft the manuscript. All authors read and approved the final manuscript.
Acknowledgements
We are very grateful for the funding that we have received from: Aase and Einar Danielsens Foundation and The Danish Scientific Research Council and the Danish Lung Association.
Author details
1Research Centre for Prevention and Health, The Capital Region of Denmark, Building 84-85, Nordre Ringvej 57, DK-2600 Glostrup, Denmark.2Department of Medicine, Complejo Hospitalario Universitario, Santiago de Compostella, Spain.3The Danish Lung function Laboratory, Helsingør, Denmark. 4Department of Clinical Experimental Research, Glostrup University Hospital, Glostrup, Denmark.5Department of Clinical Medicine, Faculty of Health and Medical Sciences, University of Copenhagen, Copenhagen, Denmark.
Received: 17 June 2014 Accepted: 12 November 2014 Published: 22 December 2014
References
1. Beuther DA, Sutherland ER:Overweight, obesity, and incident asthma: a meta-analysis of prospective epidemiologic studies.Am J Respir Crit Care Med2007,175:661–666.
2. Chinn S, Jarvis D, Melotti R, Luczynska C, Ackermann-Liebrich U, Anto JM, Cerveri I, de MR, Gislason T, Heinrich J, Janson C, Kunzli N, Leynaert B, Neukirch F, Schouten J, Sunyer J, Svanes C, Vermeire P, Wjst M, Burney P:
Smoking cessation, lung function, and weight gain: a follow-up study. Lancet2005,365:1629–1635.
3. Rossi A, Fantin F, Di FV, Guariento S, Giuliano K, Fontana G, Micciolo R, Solerte SB, Bosello O, Zamboni M:Body composition and pulmonary function in the elderly: a 7-year longitudinal study.Int J Obes (Lond)2008, 32:1423–1430.
4. Carey IM, Cook DG, Strachan DP:The effects of adiposity and weight change on forced expiratory volume decline in a longitudinal study of adults.Int J Obes Relat Metab Disord1999,23:979–985.
5. Chinn DJ, Cotes JE, Reed JW:Longitudinal effects of change in body mass on measurements of ventilatory capacity.Thorax1996,51:699–704. 6. Wannamethee SG, Shaper AG, Whincup PH:Body fat distribution, body
composition, and respiratory function in elderly men.Am J Clin Nutr 2005,82:996–1003.
7. Sutherland ER:Linking obesity and asthma.Ann N Y Acad Sci2014, 1311:31–41.
8. Mosen DM, Schatz M, Magid DJ, Camargo CA Jr:The relationship between obesity and asthma severity and control in adults.J Allergy Clin Immunol 2008,122:507–511.
9. Kronander UN, Falkenberg M, Zetterstrom O:Prevalence and incidence of asthma related to waist circumference and BMI in a Swedish community sample.Respir Med2004,98:1108–1116.
10. Appleton SL, Adams RJ, Wilson DH, Taylor AW, Ruffin RE:Central obesity is associated with nonatopic but not atopic asthma in a representative population sample.J Allergy Clin Immunol2006,118:1284–1291. 11. Granell R, Henderson AJ, Evans DM, Smith GD, Ness AR, Lewis S, Palmer TM,
Sterne JA:Effects of BMI, fat mass, and lean mass on asthma in childhood: a Mendelian randomization study.PLoS Med2014,11:e1001669.
12. Ronmark E, Andersson C, Nystrom L, Forsberg B, Jarvholm B, Lundback B: Obesity increases the risk of incident asthma among adults.Eur Respir J 2005,25:282–288.
13. Haldar P, Pavord ID, Shaw DE, Berry MA, Thomas M, Brightling CE, Wardlaw AJ, Green RH:Cluster analysis and clinical asthma phenotypes.Am J Respir Crit Care Med2008,178:218–224.
14. Scott HA, Gibson PG, Garg ML, Wood LG:Airway inflammation is augmented by obesity and fatty acids in asthma.Eur Respir J2011,38(3):594–602. 15. Salome CM, King GG, Berend N:Physiology of obesity and effects on lung
function.J Appl Physiol (1985)2010,108:206–211.
16. Steier J, Lunt A, Hart N, Polkey MI, Moxham J:Observational study of the effect of obesity on lung volumes.Thorax2014,69(8):752–759. 17. Jones RL, Nzekwu MM:The effects of body mass index on lung volumes.
Chest2006,130:827–833.
18. Wehrmeister FC, Menezes AM, Muniz LC, Martinez-Mesa J, Domingues MR, Horta BL:Waist circumference and pulmonary function: a systematic review and meta-analysis.Syst Rev2012,1:55.
19. Thyagarajan B, Jacobs DR Jr, Apostol GG, Smith LJ, Jensen RL, Crapo RO, Barr RG, Lewis CE, Williams OD:Longitudinal association of body mass index with lung function: the CARDIA study.Respir Res2008,9:31. 20. Bottai M, Pistelli F, Di PF, Carrozzi L, Baldacci S, Matteelli G, Scognamiglio A,
Viegi G:Longitudinal changes of body mass index, spirometry and diffusion in a general population.Eur Respir J2002,20:665–673. 21. Pistelli F, Bottai M, Carrozzi L, Pede FD, Baldacci S, Maio S, Brusasco V,
Pellegrino R, Viegi G:Changes in obesity status and lung function decline in a general population sample.Respir Med2008,102:674–680. 22. Chen Y, Horne SL, Dosman JA:Body weight and weight gain related to
pulmonary function decline in adults: a six year follow up study.Thorax 1993,48:375–380.
23. Thuesen BH, Cerqueira C, Aadahl M, Ebstrup JF, Toft U, Thyssen JP, Fenger RV, Hersoug LG, Elberling J, Pedersen O, Hansen T, Johansen JD, Jorgensen T, Linneberg A:Cohort profile: the health2006 cohort, research centre for prevention and health.Int J Epidemiol2014,43(2):568–575.
24. Berg ND, Husemoen LL, Thuesen BH, Hersoug LG, Elberling J, Thyssen JP, Carlsen BC, Johansen JD, Menne T, Bonnelykke K, Stender S, Meldgaard M, Szecsi PB, Linneberg A:Interaction between filaggrin null mutations and tobacco smoking in relation to asthma.J Allergy Clin Immunol2012, 129:374–380. 380.
26. Pedersen OF, Naeraa N, Lyager S, Hilberg C, Larsen L:A device for evaluation of flow recording equipment.Bull Eur Physiopathol Respir1983,19:515–520. 27. ATS/ERS recommendations for standardized procedures for the online and offline measurement of exhaled lower respiratory nitric oxide and nasal nitric oxide, 2005.Am J Respir Crit Care Med2005,171:912–930. 28. Petersen AB, Gudmann P, Milvang-Gronager P, Morkeberg R, Bogestrand S,
Linneberg A, Johansen N:Performance evaluation of a specific IgE assay developed for the ADVIA centaur immunoassay system.Clin Biochem 2004,37:882–892.
29. Sutherland TJ, Goulding A, Grant AM, Cowan JO, Williamson A, Williams SM, Skinner MA, Taylor DR:The effect of adiposity measured by dual-energy X-ray absorptiometry on lung function.Eur Respir J2008,32:85–91. 30. Hayes D Jr, Kraman SS:The physiologic basis of spirometry.Respir Care
2009,54:1717–1726.
31. Shore SA:Obesity, airway hyperresponsiveness, and inflammation.J Appl Physiol2010,108:735–743.
32. Bjorntorp P:Adipose tissue distribution and function.Int J Obes1991, 15(Suppl 2):67–81.
33. Chen Y, Rennie D, Cormier YF, Dosman J:Waist circumference is associated with pulmonary function in normal-weight, overweight, and obese subjects.Am J Clin Nutr2007,85:35–39.
34. Leone N, Courbon D, Thomas F, Bean K, Jego B, Leynaert B, Guize L, Zureik M:Lung function impairment and metabolic syndrome: the critical role of abdominal obesity.Am J Respir Crit Care Med2009,179:509–516. 35. Moore WC, Meyers DA, Wenzel SE, Teague WG, Li H, Li X, D’Agostino R Jr,
Castro M, Curran-Everett D, Fitzpatrick AM, Gaston B, Jarjour NN, Sorkness R, Calhoun WJ, Chung KF, Comhair SA, Dweik RA, Israel E, Peters SP, Busse WW, Erzurum SC, Bleecker ER:Identification of asthma phenotypes using cluster analysis in the severe asthma research program.Am J Respir Crit Care Med2010,181:315–323.
36. Amelink M, de Nijs SB, Berger M, Weersink EJ, Ten BA, Sterk PJ, Bel EH: Non-atopic males with adult onset asthma are at risk of persistent airflow limitation.Clin Exp Allergy2012,42:769–774.
37. Chen Y, Rennie DC, Pahwa P, Dosman JA:Pulmonary function in adults with recent and former asthma and the role of sex and atopy.BMC Pulm Med2012,12:32.
38. Dweik RA, Boggs PB, Erzurum SC, Irvin CG, Leigh MW, Lundberg JO, Olin AC, Plummer AL, Taylor DR:An official ATS clinical practice guideline: interpretation of exhaled nitric oxide levels (FENO) for clinical applications.Am J Respir Crit Care Med2011,184:602–615.
39. Wu W, Bleecker E, Moore W, Busse WW, Castro M, Chung KF, Calhoun WJ, Erzurum S, Gaston B, Israel E, Curran-Everett D, Wenzel SE:Unsupervised phenotyping of severe asthma research program participants using expanded lung data.J Allergy Clin Immunol2014,133:1280–1288. 40. Marcon A, Corsico A, Cazzoletti L, Bugiani M, Accordini S, Almar E, Cerveri I,
Gislason D, Gulsvik A, Janson C, Jarvis D, Martinez-Moratalla J, Pin I, de MR: Body mass index, weight gain, and other determinants of lung function decline in adult asthma.J Allergy Clin Immunol2009,123:1069–1074. 1074. 41. Ulrik CS, Backer V, Dirksen A:A 10 year follow up of 180 adults with
bronchial asthma: factors important for the decline in lung function. Thorax1992,47:14–18.
42. Fenger RV, Linneberg A, Vidal C, Vizcaino L, Husemoen LL, Aadahl M, Gonzalez-Quintela A:Determinants of serum tryptase in a general population: the relationship of serum tryptase to obesity and asthma.Int Arch Allergy Immunol2012,157:151–158.
doi:10.1186/1471-2466-14-208
Cite this article as:Fengeret al.:The longitudinal relationship of changes of adiposity to changes in pulmonary function and risk of
asthma in a general adult population.BMC Pulmonary Medicine
201414:208.
Submit your next manuscript to BioMed Central and take full advantage of:
• Convenient online submission
• Thorough peer review
• No space constraints or color figure charges
• Immediate publication on acceptance
• Inclusion in PubMed, CAS, Scopus and Google Scholar
• Research which is freely available for redistribution