Multiple-Criteria Decision Analysis: A Novel
Rank Aggregation Method
Derya Yiltas-Kaplan
Department of Computer Engineering, Istanbul University, 34320, Avcilar, Istanbul, Turkey Email: dyiltas@ istanbul.edu.tr
---ABSTRACT---Ranking among several objects is a very crucial operation for different applications to find a vote value for each object against the others. Multiple metrics can be combined to get a single vote value of an object. There are many studies in the literature that convert the ranking problem into a graph structure to solve it with a discrete mathematical process. Generally, these studies define multiple metrics as matrix forms and then relate them with the computations of eigenvectors to find the best ranked object. However, due to the dynamic nature of the metric values, ranking approaches should be fast and less complex. In this study a different approach for the ranking process with multiple metrics is proposed. This approach is fast and easy to implement. In order to test the approach, a network scenario is designed with computer programs. The experimental results show that this method outperforms a common conventional method in terms of various metric values, namely transmission time, packet loss rate, jitter, availability, and throughput. As a consequence, the proposed method gives the average value of each individual metric as more advantageous and without rescaling the numerical values.
Keywords - Decision theory, multi-criteria decision analysis, multi-objective decision, rank aggregation, rank centrality.
--- Date of Submission: March 02, 2018 Date of Acceptance: March 23, 2018 ---
1.
INTRODUCTIONR
anking applications cover user/customer preferences on some measurements used in e-commerce, multi-agent systems, web services related to search engines, or some social activities like sports tournaments and vote inquiries. In recent studies some ranking algorithms have been proposed to satisfy the rank of objects in various information-based problems such as schema matching in database integration, search engine responses, decision-making processes, and multi-objective selections. There are also some studies that exhibit decision making methods which conclude joint decisions according to the preferences of several parties in a problem. One of these studies represents various voting rules including ranking steps to get the last decision among many possible alternatives [1]. In this case the voting schemes are beneficial for several kinds of daily problems such as task or resource allocations.Most of the ranking algorithms in the literature convert the ranking problem into a graph structure in order to solve it with the discrete mathematics tools. The graph structure is described as G=(V, E), in which the variables symbolize a set of ranked objects and pairs of compared objects [2]. The studies using the graphs represent multiple metrics in matrix forms and then give the eigenvectors to find the best ranked object. In a sample study the relationship between the ranking algorithms and Internet technologies was provided with the help of mathematical axioms and their properties in social choices which were obtained from the websites [3]. The ranking was performed as graph-theoretic considering the stationary probability distribution besides a node-related matrix. In this study, the authors proposed several axioms based on
graph theory properties such as isomorphism, predecessor and successor vertices.
In addition to eigenvectors, in some studies Markov chains were applied to represent objects as basic state structures. The state sequences were related to some state distributions, namely probability distributions [4]. When the system reached a constant point with a static state distribution, namely stationary distribution, the approximations on eigenvectors easily gave this distribution. The ranking scenarios were evaluated to define spam pages especially for web search results from keywords and the usage of search engine results. For details about some applications and methods see Dwork et al.[4].
Starting from the rank aggregation analysis of the web and some other web search and multimedia database applications, Domshlak et al. [7] proposed some rank aggregation methods for a database integration operation, namely schema matching to find the best ranked mappings. They presented two general algorithms to which they adapted their problem and compared the results with their novel algorithms. Their algorithms cover matrix-based operators and some properties of functions such as commutativity that are beyond the scope of this paper.
In another study the rank aggregation was combined with the similarity analysis of the objects [8]. The similarity property was measured through a predetermined function. Some measures such as Kendall Tau distance and Spearman footrule distance were used to provide the similarity measurements of the ranking values of the object pairs [4, 8, 9]. Each object had a ranking value and the sum of the distances between its value and those of all other objects. The basic purpose here was to find the ranking with a minimum distance [9]. The aggregate similarity position of an object was evaluated under the similarity function and the aggregate similarity ranked list [8]. The main goal was to decrease the similarity distance between an aggregate list and the input lists. In the last part the similarity information was used with several aggregation methods to solve a search engine process [8]. The keywords for web search were expanded to propose relevant keywords automatically.
The Kendall Tau test and Euclidean distance were also applied to some problem solutions by Yazdani et al. [10]. Their study gives a method to obtain the topology robustness through multiple metrics for the networks with various dimensions and configurations. The authors used several metrics such as node-connectivity, edge-connectivity, critical breakdown ratio, and spectral gap. They provided some network examples from hierarchical and distributed configurations. Making a direct comparison between the multiple metrics did not give a good measurement of network robustness as in a sample study [10]. For this reason, a score initialization was proposed in the beginning of the solution and through these values a rank aggregation method was performed during the process. Each metric firstly covered the score initialization as an input independently and then generated an aggregate ranking with other metrics. Here, each metric was standardized based on a percentage of an optimal theoretical value, but the authors mentioned that these theoretical optimal values might not be possible and there should be some trade-off between some metrics. A Kendall Tau test from the literature was applied to make a rank correlation statistically based on some coefficients between metric pairs [10]. The Euclidean distance was evaluated over the metrics of a given network and the complete network to find their closeness. The percentage operation, which gives the base of ranking in this study, covered metric correlations due to some fractions. However, in some problems the parameters may not be correlated according to some formulas because they are independent. Also, the adaptation of this solution to
another problem requires different formulas, so it is not an adaptive and flexible solution.
According to a statistical framework, the rank aggregators that are optimized with Kendall Tau calculations are difficult to compute; yet have a high performance [11]. The optimization is performed with respect to the Kendall Tau error measures. This framework monitors the performance of an aggregate ranker based on individual input rankers. It is obvious that the initialization values of the starting ranks during the optimization affect the last performance of the rank aggregators.
Shachnai et al. [12] generalized the rank aggregation problem which handles the input lists including the permutations of predetermined objects. In their study an input list contained a set of multiple orderings, namely multiple permutations of the objects. An overall permutation of the objects was compared with the individual permutations inside the set. At this stage Kemeny distance was used additionally to find the object number staying in different orders of two orderings. So the authors tried to obtain a single object order which minimizes the total distance. This also means the minimization of the total disagreements upon the object orders inside the lists. As the authors said, the problem occurs as NP-hard for four different input lists. This theorem is also mentioned in a different study [13]. In this paper’s method five different metrics which can be adapted as five different input lists are used as in below.
Additionally, some lecture notes gave detailed theoretical information about rank aggregation methods, especially on the basis of the metasearch problem that is the aggregation of search results from several search engines [13]. The above-mentioned Kendall Tau, Spearman footrule, and Kemeny distances can be observed along their formulas from these lecture notes.
The rest of this paper is organized as follows. In Section 2, the theoretical information about the conventional compared method and the proposed one is defined. In Section 3, the numerical computations based on computer programs are given. Lastly, several important conclusion points are mentioned in Section 4.
2.
T
HEORETICALB
ASELINEThere are several algorithms for rank aggregation as discussed above. In this section it is focused on a conventional method and then proposed the new method and compared both approaches.
2.1 Conventional rank aggregation method
In the literature Rank Centrality (RC) is one of the main rank aggregation algorithms that find a single score for each object [14]. This method becomes conventional as mentioned before, using a graph in which the nodes symbolize the ranked objects. Random walks along the edges of the graph represent pairwise comparisons of objects staying at the end nodes. The walking frequency on a node or the stationary distribution gives a score of the relevant object. This distribution measures the importance of a node between the other nodes giving the term
Now some important points and formulas of the RC method are briefly given. aij is a fraction that represents the number of times object j outperforms object i [14]:
kl l ij
ij
k
Y
a
1
)
/
1
(
(1)Here,
Y
ijl represents the result in comparison l. If joutperforms i, the result is 1; otherwise it is 0. The comparison of the objects is made according to the formulas: ji ij ij ij
a
a
a
A
(2)and ji ij ji ji
a
a
a
A
(3)In (2)-(3), the denominators are always equal to 1. Additionally, if the objects are not compared to each other,
Aij or Aji becomes 0. The value Aijconverges to the weight
fraction j i j
w
w
w
for large k ask
. P transitionmatrix and
stationary distribution are computed based on the Aij values. Here,
is the top left eigenvector of P.At the end each node gets a rank value or a numerical score [14].
2.2 Proposed method
In this subsection a new rank aggregation method is proposed. This method performs an easy computation throughout many objects and multiple metrics with their raw values and also without considering any normalization step. This method shall be called as Win Rank and the objects are labelled as winner candidates with an index c (
c
). The number of all objects is C andM={M1,M2,...,Md} is a set of metrics with
d
. It is assumed that Mci
RV
represents the ranking value of objectc with respect to the ith metric. Mc
i
RV
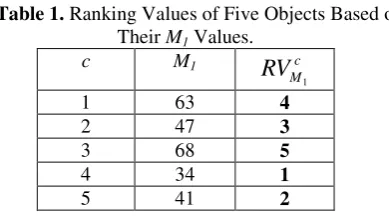
is an integer value that gives the order of object c among overall C objects based on their ascending/descending sorted Mi values. Fora numerical example, it is assumed that five objects (C=5) and an individual metric M1 are stayed. The third column of Table 1 is obtained according to the given first two columns.
Table 1. Ranking Values of Five Objects Based on Their M1 Values.
c M1 c
M
RV
11 63 4
2 47 3
3 68 5
4 34 1
5 41 2
Table 1 directly represents ranking values of the objects on their ascending sorted M1 values. In Win Rank each
metric has its own arrangement type as ascending or descending, which may be different from the others; the arrangement type is related to the metric characteristics. That is for a metric, if small numerical values are advantageous, the sorting should be ascending; if large values are advantageous, the descending arrangement is chosen. If a descending sort is used in Table 1, the
RV
Mc1
column occurs as 2, 3, 1, 5, and 4 respectively from top to bottom.
After completing the computation of the ranking values which depend on all metrics individually, the total ranking value (TRV) of object c is computed as an aggregation along all metrics as:
d i c MiRV
c
TRV
1)
(
(4)At the end, a comparative degree of an object c is found as Win Order WO(c) based on the TRV(c) results with a new process similar to the ascending sort for Mc
i
RV
. An example for this process is given in Table 2. Here it is assumed that there are five objects (C=5) and five metrics (d=5). TRV(c) is the sum of five Mc
i
RV
values for each object as in (4). In this way, the last column is obtained according to the first two columns in Table 2. The winner of this example is Object 2, as shown in Table 2. The steps of Win Rank can be seen from the pseudocode in Fig. 1.Table 2. WO(c) of Five Objects Based on Their TRV(c)
Values.
c TRV(c) WO(c)
1 15 3
2 9 1
3 18 4
4 14 2
Select all objects and randomly choose their metric values each from a predetermined set. For i=1 to d
Sort all C objects ascending/descending with respect to
their Mi values and find the order number of each
one.
For c=1 to C
Assign the object’s order number to Mc
i
RV
; TRV(c)+= Mci
RV
; If i==dSort all TRV(c) values ascending and find the new order number for each object.
Assign the object’s new order number to
WO(c);
The object with WO(c)=1 becomes the winner.
Figure 1. Pseudocode of Win Rank.
3.
E
MPIRICALE
VALUATIONIn this section several numerical comparisons between the conventional RC method and the Win Rank method are presented. It should be noted that Win Rank can be used with any kind of ranking-based selections such as decision-making processes. Also, the sample structure given in this section can be easily adapted to any other areas by reorganizing the design and the metrics.
In the Win Rank, an ad hoc network is set with 100 nodes and 116 edges totally. An edge is located in between two nodes, so all edges are connection ways for the relevant node pairs. Each edge is associated with several metrics such as transmission time, packet loss rate, jitter, availability, and link throughput. These metrics can be changed according to the problem area. The values of these metrics are randomly chosen from the ranges as shown in Table 3.
Table 3. Metrics and Their Ranges. Metric name Metric range Transmission
time
[1, 200]
Packet loss rate {10-7, 10-6, 10-5,10-4, 10-3, 10-2}
Jitter [1, 20]
Availability [0.999, 0.999999] Link throughput [1, 5000]
An edge array including at least one edge between any two nodes gives a path structure. There may be several paths in between two specific nodes, namely source and destination. The main target is to find the best path between any selected source-destination node pair with respect to the metric values. This is similar to the detection of the shortest path between any two cities as in logistics. But here there are multiple metrics, not only one metric such as the distance. For each path it should be had one aggregated value based on each metric value of the relevant edges. The used metrics have an additive or
multiplicative property over multiple edges. It is assumed that only the availability is multiplicative and the others are additive. This means that, for example, the overall jitter is computed along a path, summing up the jitter values of the edges which belong to this path. This operation is the same for transmission time, packet loss rate, and link throughput. On the other hand, the availability values of the relevant edges are multiplied to find an overall availability for a specific path. Additionally, as mentioned in Section 2.2, the arrangement type of availability and link throughput are descending and all others are ascending.
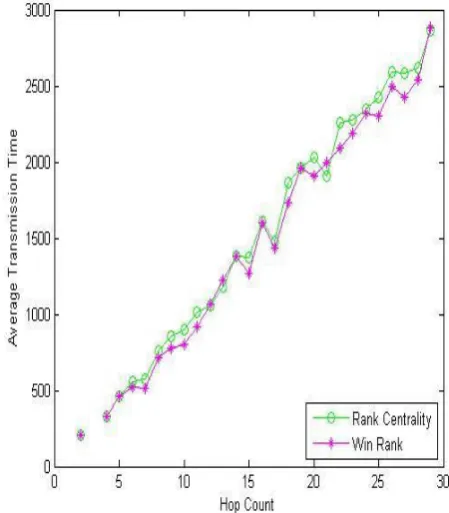
Now note that the objects are the paths. In the experiments 25 different source-destination pairs are chosen for the computation. Several paths (objects) starting at the source and ending at the destination nodes are determined. Two different data sets which have different metric and path numbers are constructed. Such distinction is preferred to show specifically the effect of the path numbers on the results. In the first experiment set 500 paths are used to compare four metrics, i.e. transmission time, packet loss rate, jitter, and availability. Figs. 2-5 show results of the comparison between RC and Win Rank methods on all metrics that get their average values from the winner paths relevant to any hop count.
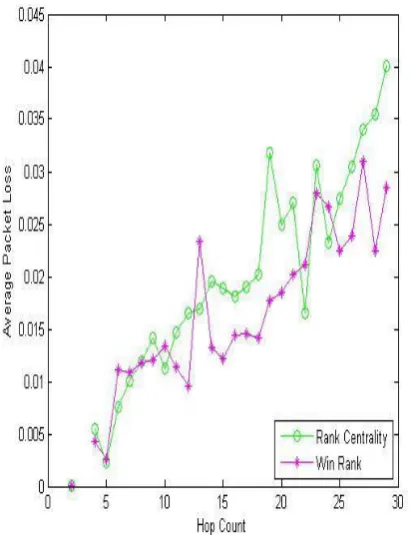
Figure 3. Packet loss rate (experiment set 1).
Figure 4. Jitter (experiment set 1).
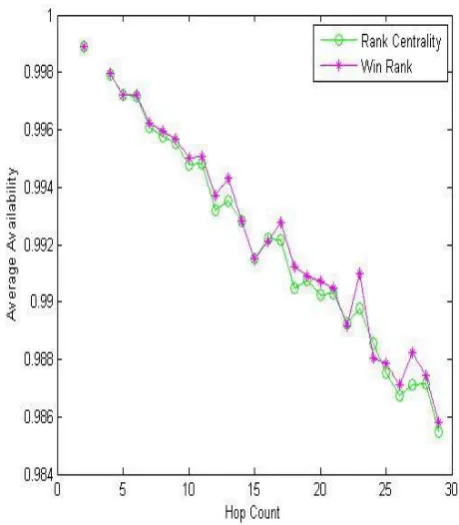
Figure 5. Availability (experiment set 1).
Each path has a hop count which defines the number of edges it includes. As seen in Figs. 2-5, a metric value on the y-axis is demonstrated as the average value of all winner paths having the relevant hop count on the x-axis. Figs. 2-5 demonstrate that Win Rank outperforms RC at almost all values. Note that large values of availability are preferable because they have a descending arrangement as mentioned before. On the contrary, small values of transmission time, packet loss rate, and jitter are preferable.
In the second experiment set, 5000 paths are used with considering the link throughput as well as the other metrics. Figs. 6-10 show comparison results for the 5 metrics.
Figure 6. Transmission time (experiment set 2).
Figure 7. Packet loss rate (experiment set 2).
Figure 8. Jitter (experiment set 2).
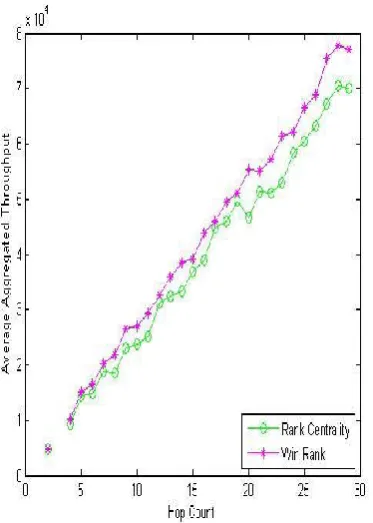
Figure 10. Aggregated throughput (experiment set 2).
According to the results in Figs. 6-10, Win Rank also outperforms RC in all metrics for the 5000-path set. Note that the throughput is handled as the aggregated value of all links along an entire path, not as the minimum throughput value in between all links’ values towards a path as in the usual network applications. Thus large values of the link throughput are preferable here. As seen in Figs. 6-10, a large number of paths gives a more distinct difference between RC and Win Rank than that from a small number as in Figs. 2-5.
4.
C
ONCLUSIONSA new rank aggregation method is constructed to solve the ranking problem easily. It was not needed to use any constant matrix structure which should have been set controlling the metric values. The raw data was used directly in the computations. In other words, the metric values were not scaled into any weight fraction. The proposed method, namely Win Rank was compared with a conventional one using matrix forms and eigenvectors. Win Rank outperforms this common method for both small and large numbers of objects. Win Rank gives better results in almost all metrics and hop counts. An empirical testbed was used for two network scenarios, but the proposed method can be specifically adapted to any other scenario in various correlative problem solutions that cover different testbeds and metrics. Additionally, the computer based implementation of Win Rank is very easy and extendible for new areas covering decision making processes especially with many comparison metrics. For each metric, the ranking value is computed independently. Then the total value of all ranking results of the metric values is obtained. Consequently, in any research area, the
winner between the objects in a decision making process can be easily detected according to the comparisons in this method.
5.ACKNOWLEDGEMENTS
This work was supported by Scientific Research Projects Coordination Unit of Istanbul University. Project Number:
10590. The author sincerely thanks Dr. Ergün Gümüş for
sharing his comments during the preparation of this study. REFERENCES
[1] V. Conitzer, Making decisions based on the preferences of multiple agents, Communications of the ACM,53, 2010, 84-94.
[2] L.H. Lim, X. Jiang, Y. Yao, and Y. Ye, Graph
helmholtzian and rank learning.
http://www.stat.uchicago.edu/~lekheng/work/nips.pd f, 2008, Last accessed: March 2018.
[3] A. Altman and M. Tennenholtz, Ranking systems: The PageRank axioms, Proc. 6th ACM Conference on Electronic Commerce, Vancouver, British Columbia, Canada, 2005, 1-8.
[4] C. Dwork, R. Kumar, M. Naor, and D. Sivakumar, Rank aggregation methods for the web, Proc. Tenth Int. World Wide Web Conference (WWW10), Hong Kong, 2001, 613-622.
[5] Z. Gormez, E. Gumus, A. Sertbas, and O. Kursun, Comparison of aggregators for multi-objective SNP selection, Proc. 35th Annual International Conference of the IEEE EMBS, Osaka, Japan, 2013, 3062-3065.
[6] F.E.M. Arasi, A. Anand, and S. Kumar, QoS based ranking for composite web services, International Journal of Science, Engineering and Technology Research (IJSETR), 3, 2014, 1041-1046.
[7] C. Domshlak, A. Gal, and H. Roitman, Rank aggregation for automatic schema matching, IEEE Transactions on Knowledge and Data Engineering, 19, 2007, 538-553.
[8] D. Sculley, Rank aggregation for similar items.
http://www.eecs.tufts.edu/~dsculley/papers/mergeSim ilarRank.pdf, 2006, Last accessed: March 2018. [9] L.P. Dinu and F. Manea, An efficient approach for
the rank aggregation problem, Theoretical Computer Science,359, 2006, 455-461.
[11] S. Adalı, B. Hill, and M. Magdon-Ismail, Information vs. robustness in rank aggregation: Models, algorithms and a statistical framework for evaluation,
http://www.cs.rpi.edu/~magdon/ps/journal/ahm_jdim .pdf, Last accessed: March 2018.
[12] H. Shachnai, L. Zhang, and T. Matsui, On rank aggregation of multiple orderings in network design,
http://www.cs.technion.ac.il/~hadas/PUB/agg.pdf, Last accessed: March 2018.
[13] R. Kumar, Rank aggregation. Lecture Notes,
University of Rome, Italy, 2008.
[14] S. Negahban, S. Oh, and D. Shah, Rank centrality: Ranking from pair-wise comparisons,
http://arxiv.org/abs/1209.1688v2, Cornell University Library. Presented in part at NIPS, 2012 in Lake Tahoe. Last accessed: March 2018.
Biography